

What Is Elliott Wave in Forex?
Elliott Wave in forex is a technical-analysis framework that labels selected price swings into possible wave-count scenarios. Traders use those labels to organize how a directional move and its corrections may fit together on a currency-pair chart.
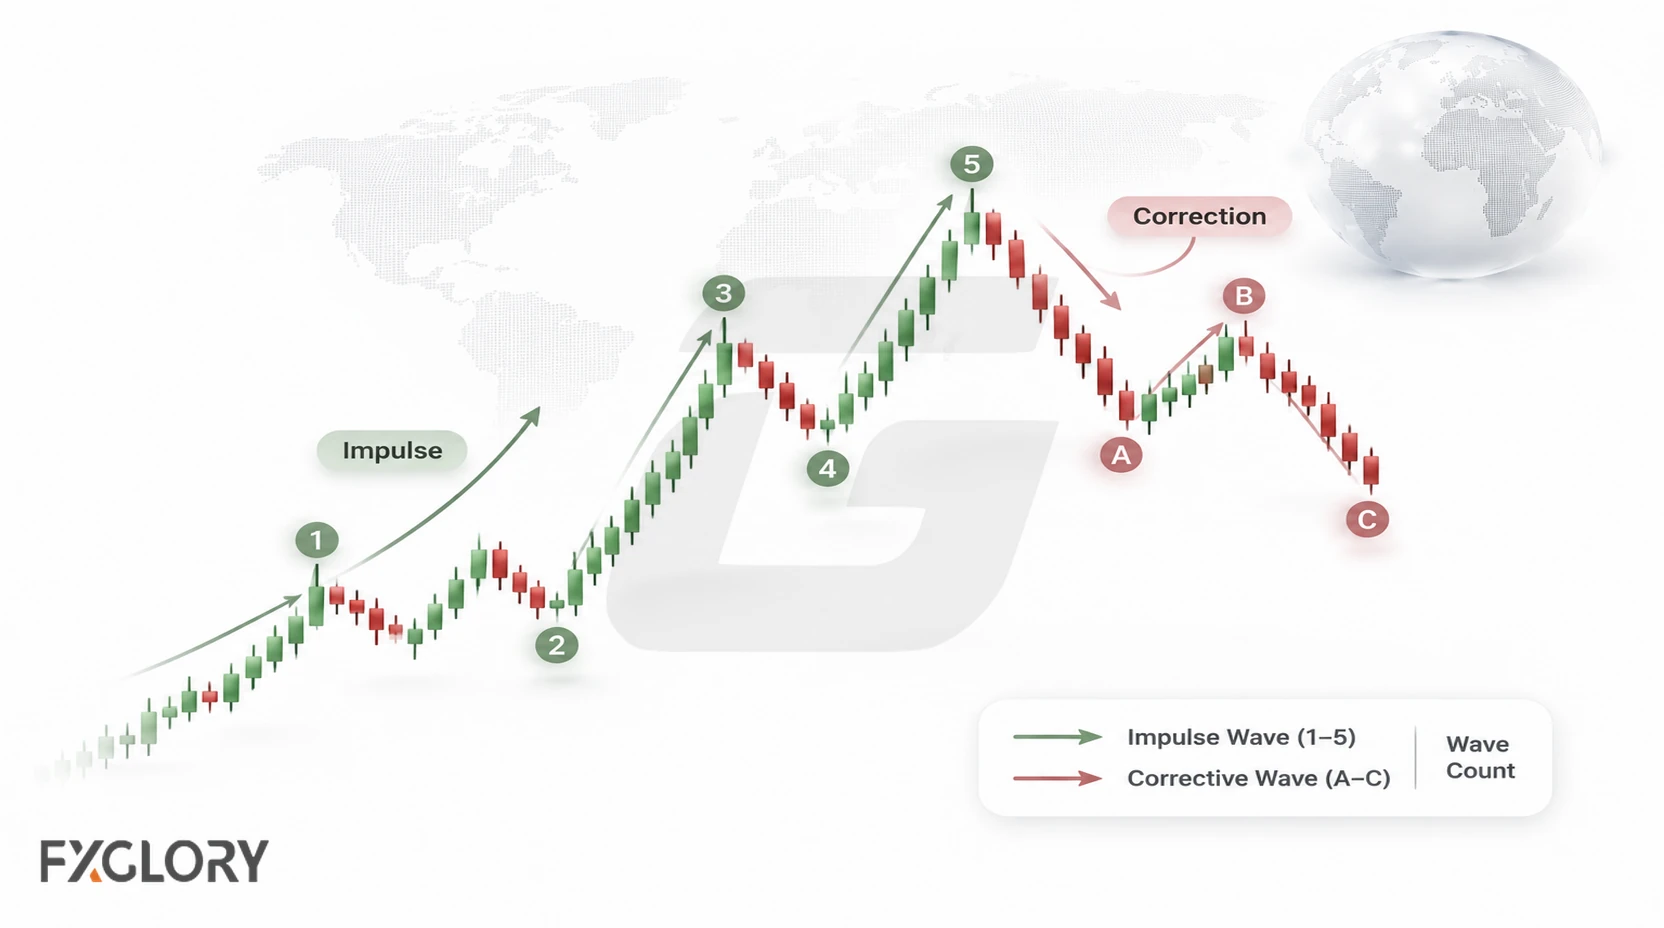
A wave count is an interpretation of price structure, not an objective label printed on the chart. Two traders may label the same movement differently, and a count can change as new price action extends, overlaps, or invalidates the original scenario.
The basic idea is to separate directional movement from corrective movement and then test the proposed sequence against Elliott Wave rules. The count organizes a scenario; it does not prove what price must do next.
This guide focuses on Elliott Wave analysis inside forex technical analysis. For the broader chart-reading framework, start with technical analysis forex.
How Elliott Wave Analysis Fits Into Forex Technical Analysis
Elliott Wave is one approach inside technical analysis. It is different from a simple indicator reading because it requires the trader to interpret the structure of price movement and label waves manually.
Manual interpretation can organize a chart, but it can also create different counts on the same price movement. A wave count should be tested against current price behavior, invalidation, and risk.
Wave analysis also connects with broader price reading. To understand the raw movement behind waves, see what is price action in forex.
Impulse Waves and Corrective Waves
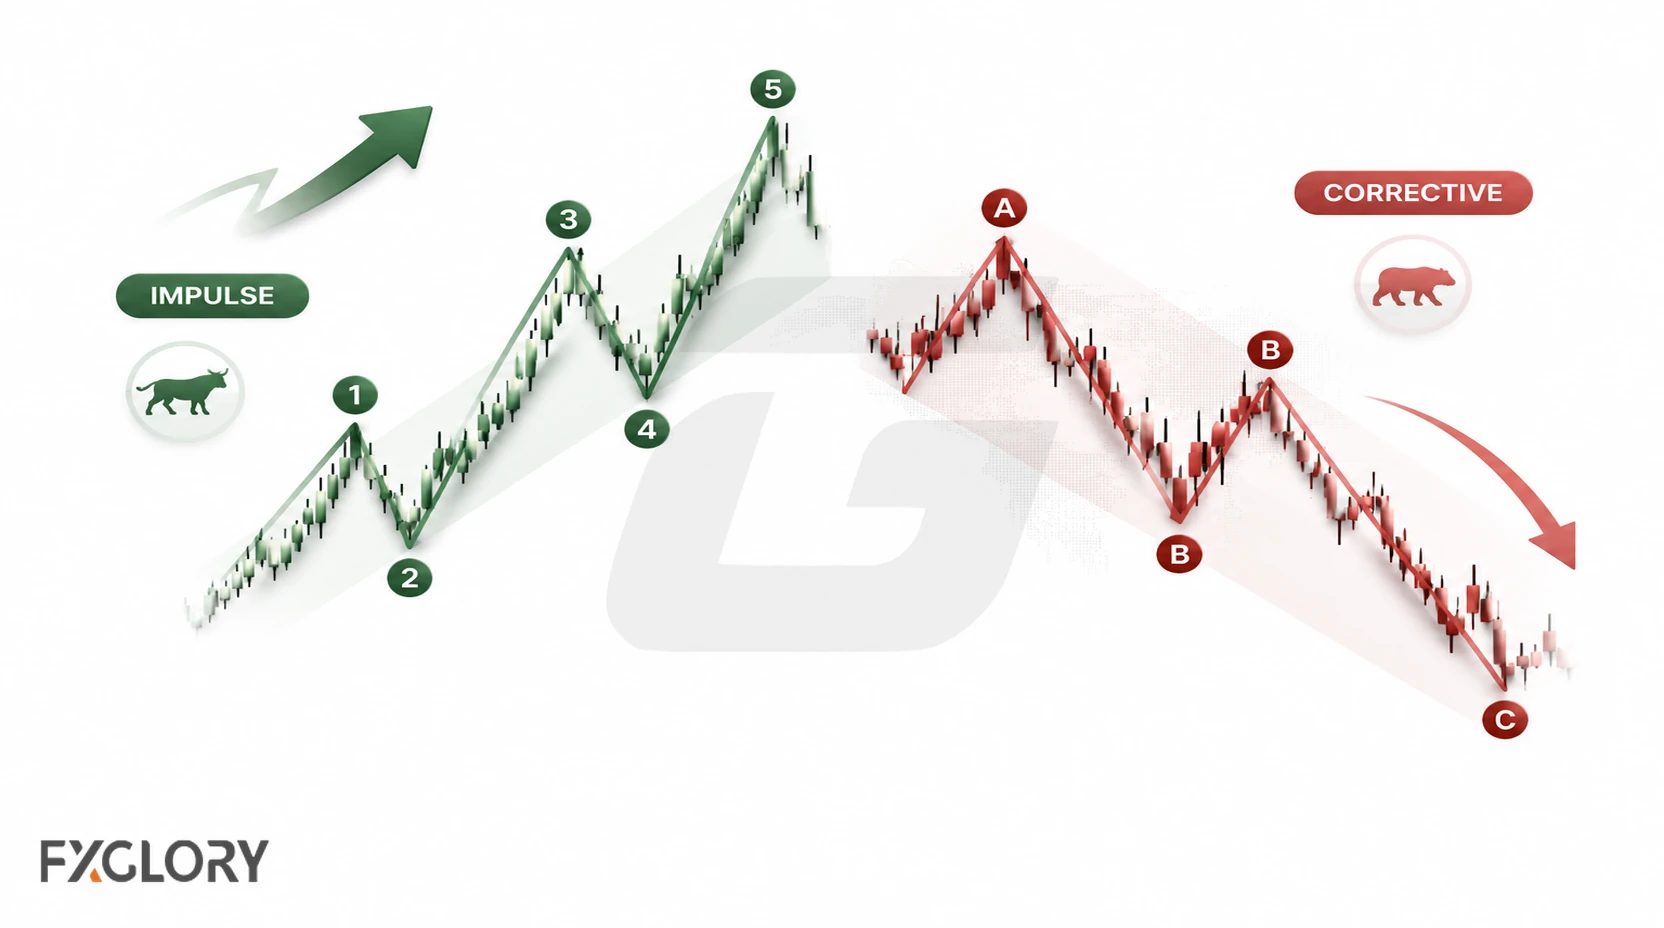
Elliott Wave analysis often separates price movement into impulse waves and corrective waves. This distinction helps traders describe whether price is moving with the larger structure or reacting against it.
| Wave Type | Basic Idea | Common Labels | Beginner Risk |
|---|---|---|---|
| Impulse waves | Five-wave motive structures that move with the larger trend | 1, 2, 3, 4, 5 | Counting the move too early before structure is clear |
| Corrective waves | Movement against or within the prior move | A, B, C | Corrections can become complex and hard to label |
| Fractal waves | Smaller waves can appear inside larger waves | Different wave degrees | Confusing short-term noise with larger structure |
This is a simplified model for learning the language of wave analysis. Real charts can be less clean than completed examples, especially when price is still forming the structure.
The Basic 5-Wave and 3-Wave Elliott Wave Structure
The most common beginner version of Elliott Wave Theory is a 5-wave move followed by a 3-wave correction.
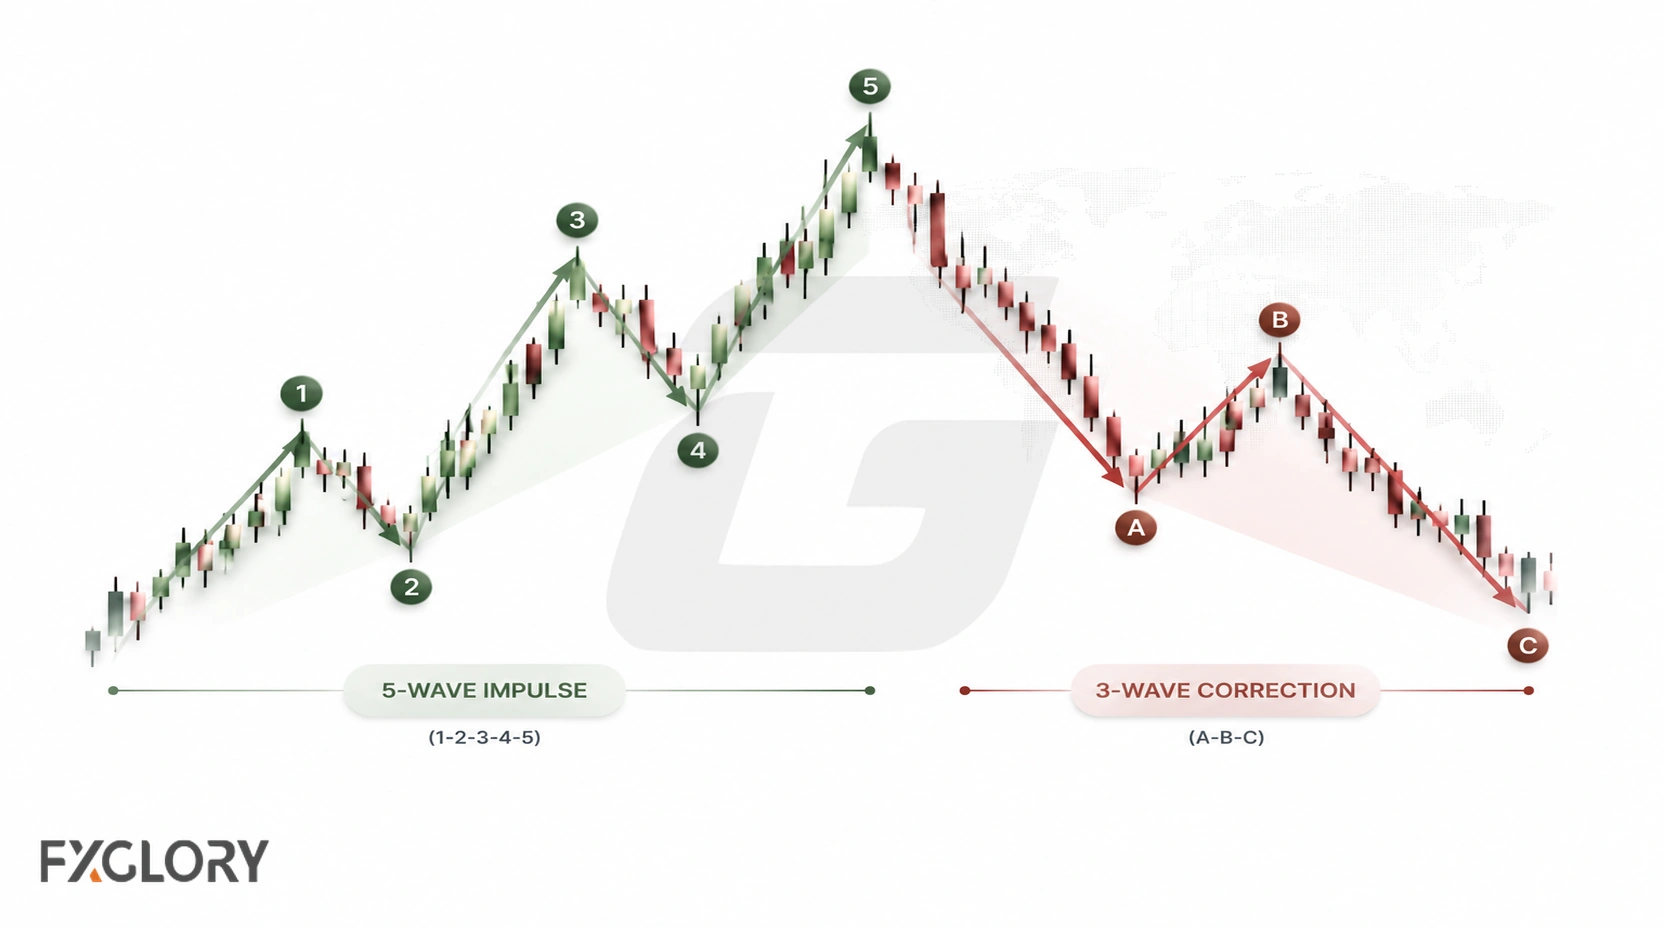
- Wave 1: The first directional move in a possible new sequence.
- Wave 2: A correction against Wave 1.
- Wave 3: A directional motive wave that continues the impulse. In a standard impulse, it must not be the shortest of Waves 1, 3, and 5.
- Wave 4: A correction after Wave 3.
- Wave 5: A final directional wave in the basic impulse model.
- A-B-C: A three-part correction after the impulse scenario.
This model teaches the basic labels before real charts become more complex. It should not be forced onto every forex chart. Some price movement is too choppy, compressed, or unclear to count cleanly.
Wave Counts and Timeframes
A wave count is the label a trader places on selected price swings to describe a possible Elliott Wave scenario. A count can be bullish, bearish, incomplete, corrective, or invalidated depending on how price behaves.
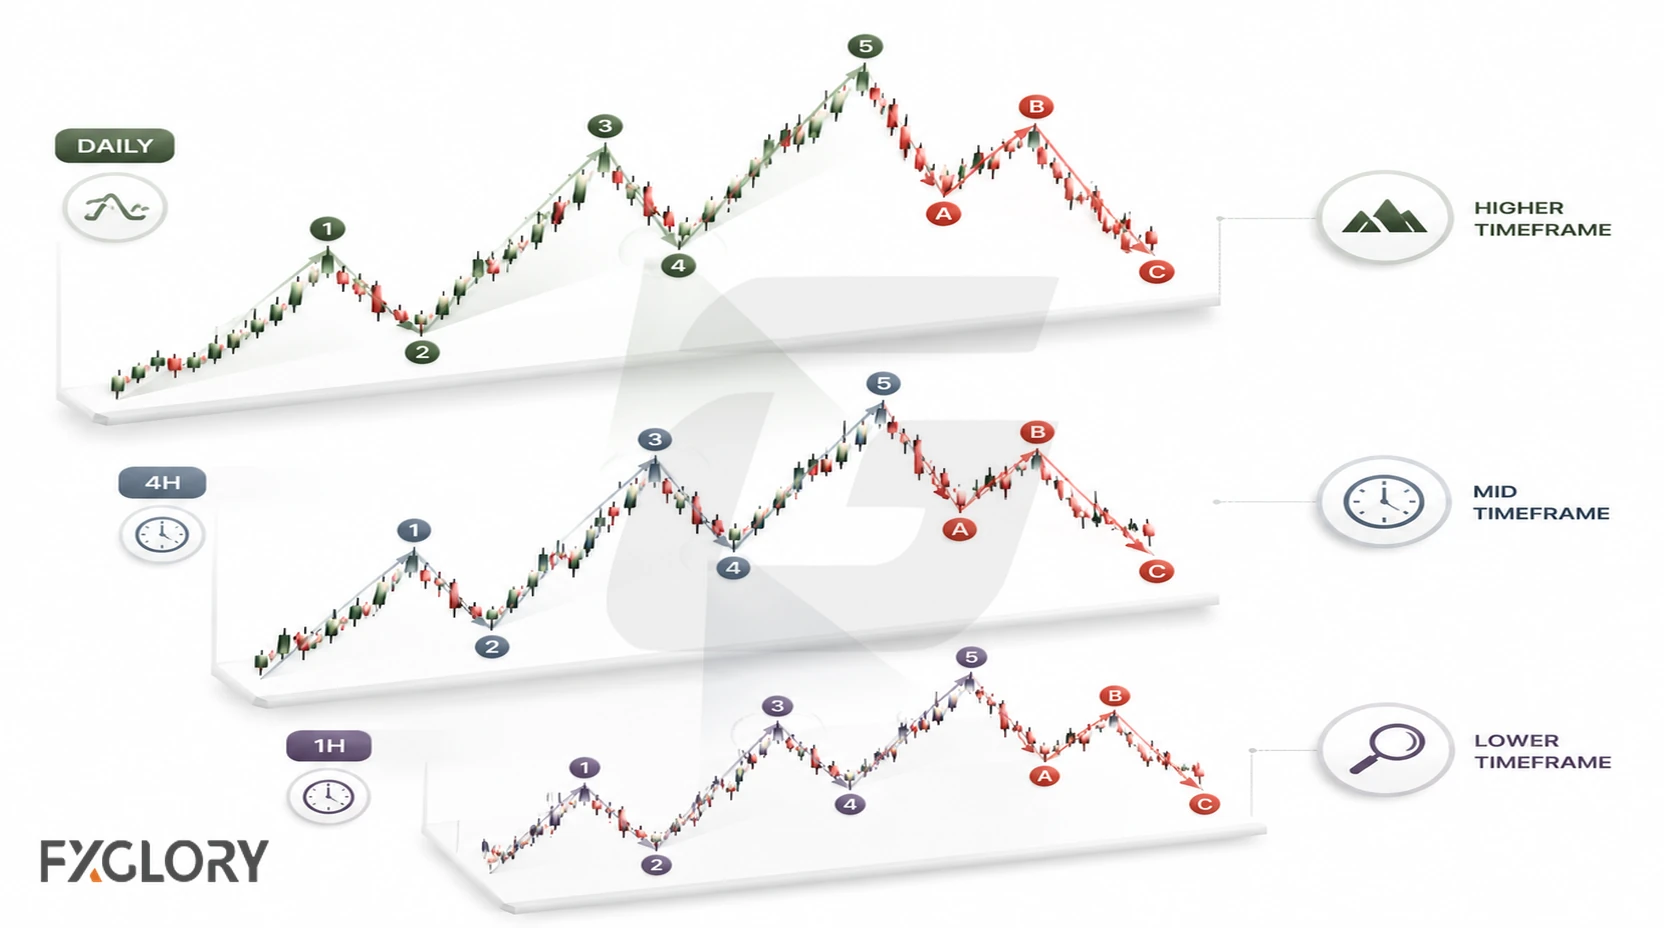
Timeframe matters because smaller waves can appear inside larger waves. A short-term chart may show a possible 5-wave move while a higher timeframe still shows a larger correction or range. To understand the broader swing arrangement behind this, see forex market structure.
- Higher timeframe: Helps define the broader wave scenario.
- Lower timeframe: May show smaller waves inside the larger structure.
- Conflicting counts: Different timeframes may suggest different wave scenarios.
- Invalidation: Price behavior that shows the current wave count no longer fits.
A wave count is useful only when the trader can explain the timeframe, the current wave scenario, and the price behavior that would make the count wrong.
ABC Corrections in Forex
An ABC correction is a common way to label corrective price movement. It is often used after a directional move, but it can also appear inside larger wave structures.
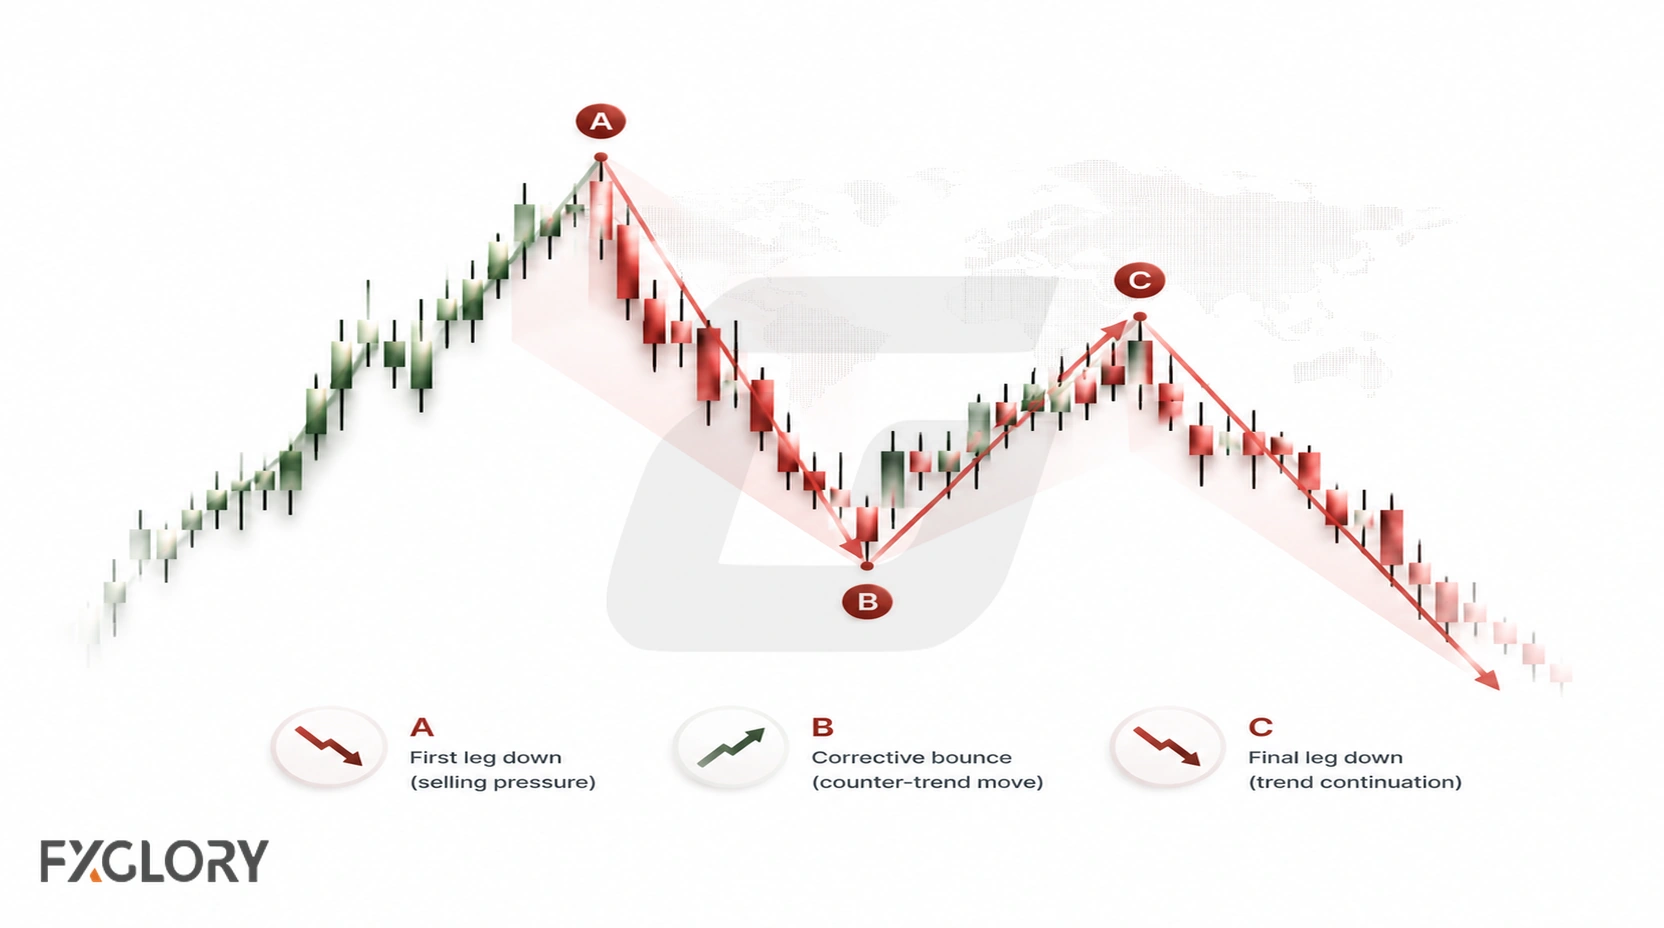
- Wave A: The first move against the prior directional structure.
- Wave B: A reaction against Wave A.
- Wave C: A continuation or completion of the correction scenario.
Corrections are often where beginners struggle. A correction may be sharp, sideways, overlapping, or extended. Some traders describe corrections as zigzags, flats, or triangles, but this page keeps the idea at beginner level.
Triangles can also appear as broader chart structures. For a separate guide to named formations, see forex chart patterns.
Fibonacci and Elliott Wave Forex
Fibonacci levels are often used with Elliott Wave analysis to compare possible wave relationships, retracements, or extensions. They may help a trader review whether a wave relationship is reasonable, but they do not confirm a wave count by themselves.
For example, a trader may compare a correction against a previous wave or study whether an extension is forming. The level can fail, and the count can still be wrong.
Fibonacci should be treated as supporting context, not proof. Price still needs confirmation, invalidation, and risk control.
Core Elliott Wave Rules for a Standard Impulse
Elliott Wave traders often use rules and guidelines to keep wave counts from becoming random. Beginners should understand these as structure checks, not trade signals.
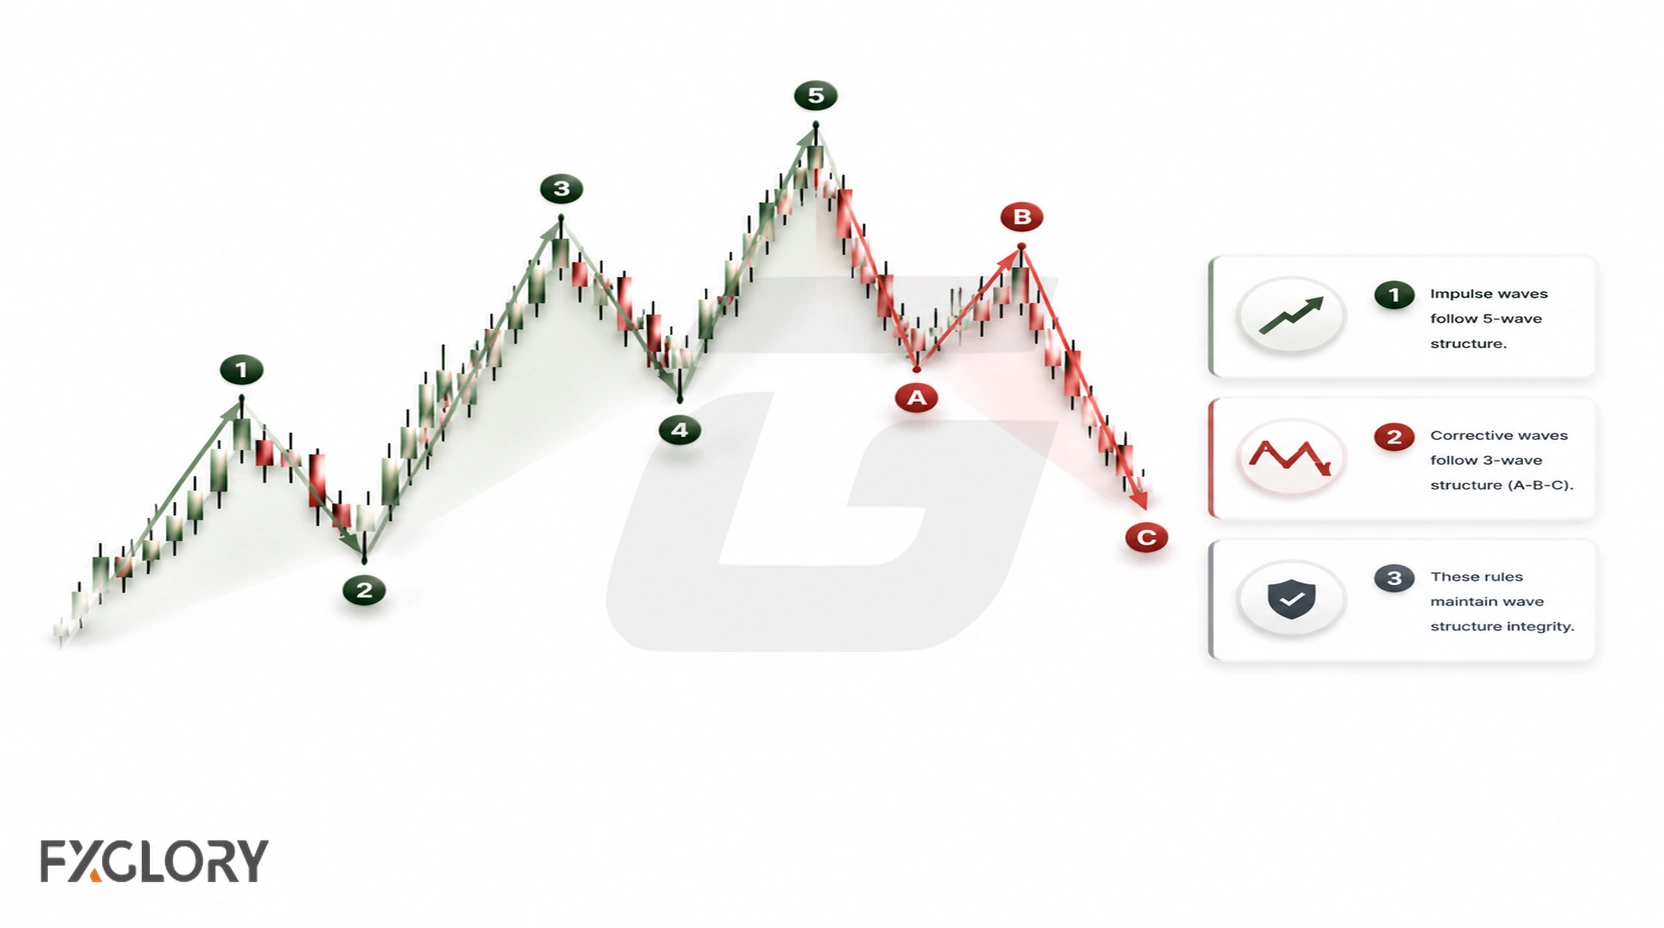
- Wave 2 and Wave 1: In a standard impulse, Wave 2 must not retrace beyond the start of Wave 1.
- Wave 3 length: In a standard impulse, Wave 3 must not be the shortest of Waves 1, 3, and 5.
- Wave 4 overlap: In a standard impulse, Wave 4 must not overlap Wave 1 price territory.
- Corrective labeling: Corrections are often labeled A-B-C, but they can develop in different forms.
- Invalidation: If price breaks the rule or no longer fits the count, the scenario must be reviewed.
These are core rules for a standard impulse and do not describe every Elliott Wave structure, such as diagonals. A useful count needs explicit boundaries; otherwise price can be relabeled after the fact without a meaningful test of the original scenario.
Why Wave Counts Change
Wave counts can change because live forex charts are incomplete. A structure that looks like one count can become another when price extends, overlaps, fails, or breaks invalidation.
- Incomplete waves: A wave may look finished before price actually completes the structure.
- Complex corrections: Corrections can overlap, extend, or move sideways longer than expected.
- Wrong timeframe: The trader may count small movement as a major wave.
- Forced labeling: The trader sees the count they want instead of the structure price is showing.
- News volatility: Fast movement can invalidate a count quickly.
- No invalidation: Without a wrong point, the wave count can keep changing to fit the chart.
When Elliott Wave Is Not Clear Enough
Elliott Wave should not be forced onto every forex chart. Some price movement is too messy, overlapping, or incomplete to support a useful wave count.
- Overlapping swings: Price keeps moving back and forth without a clean wave sequence.
- No clean impulse or correction: The chart does not show a clear directional move or corrective structure.
- Forced count: The trader adjusts labels until the chart fits the preferred scenario.
- Conflicting timeframes: A lower-timeframe count disagrees with the broader chart condition.
- News volatility: Fast movement changes the structure before a count can be tested.
- No invalidation point: The trader cannot explain where the wave count is wrong.
Common Mistakes With Elliott Wave Forex
Elliott Wave mistakes often come from treating a possible count as if it already explains the next move.
- Forcing every chart into five waves: Some forex movement is too messy or range-bound for a clean impulse count.
- Changing the count after every move: Constant relabeling can hide that the original scenario was weak.
- Ignoring invalidation: A count without a wrong point can turn into hope-based trading.
- Treating Fibonacci as proof: A Fibonacci relationship does not confirm the count by itself.
- Mixing timeframes: A lower-timeframe count may conflict with the broader structure.
- Seeing the count after the move: Finished charts often look cleaner than live charts.
- Using Elliott Wave alone: A wave count still needs context, confirmation, position sizing, and risk control.
Forex Context: Sessions, News, Liquidity, and Pairs
Elliott Wave analysis in forex should be read with market context because currency pairs trade across global sessions. Wave behavior can change during active sessions, quiet periods, session overlaps, and high-impact news.
- Session behavior: Waves may appear cleaner during active movement and less clear during thin liquidity.
- News events: Economic releases and central-bank events can invalidate a count quickly.
- Timeframes: Smaller waves may conflict with larger wave scenarios.
- Pair behavior: Different currency pairs can show different volatility, trend behavior, and correction depth.
- Spread and slippage: Fast movement can affect entries, exits, and risk control around wave-based scenarios.
A count can lose meaning when session conditions, news, liquidity, or spread behavior changes the chart quickly.
Example: Elliott Wave Analysis on EUR/USD
Suppose EUR/USD has made a clear directional move followed by a pullback. A beginner may try to label selected swings in the directional move as a possible impulse and the pullback as a possible correction.
If the pullback forms three visible legs, the trader may describe it as a possible ABC correction. If price extends, overlaps, or breaks the level that made the count reasonable, the wave count needs to be reviewed.
That observation does not create a complete trade by itself. The trader still needs chart context, confirmation, invalidation, position size, and risk control before using the wave count in a live decision.
A Safer Way to Use Elliott Wave in Forex
Elliott Wave analysis helps traders label selected swings into possible impulse and corrective structures. It can organize trend and correction scenarios, but it should not be treated as a prediction method or a standalone trading system.
A beginner should learn the 5-wave and 3-wave idea, understand impulse and corrective waves, and treat every count as a scenario that can be confirmed, rejected, or revised. Fibonacci can support a count, but it does not prove it.
Wave analysis becomes more useful when it supports a repeatable process. The trader should be able to explain the count, the timeframe, the invalidation point, and the risk before using real money.