
Fibonacci Trading Strategy Forex In 60 Seconds
- Best setup in this test: Deep Fibonacci retracement continuation.
- Best retracement zone: 61.8%-78.6%.
- Best extension/reversal zone: 127.2%-161.8%.
- Weak setup: Breakout-to-extension continuation after a pullback.
- Main warning: The overall model turned negative under the high spread/slippage assumption.
What Is A Fibonacci Trading Strategy In Forex?
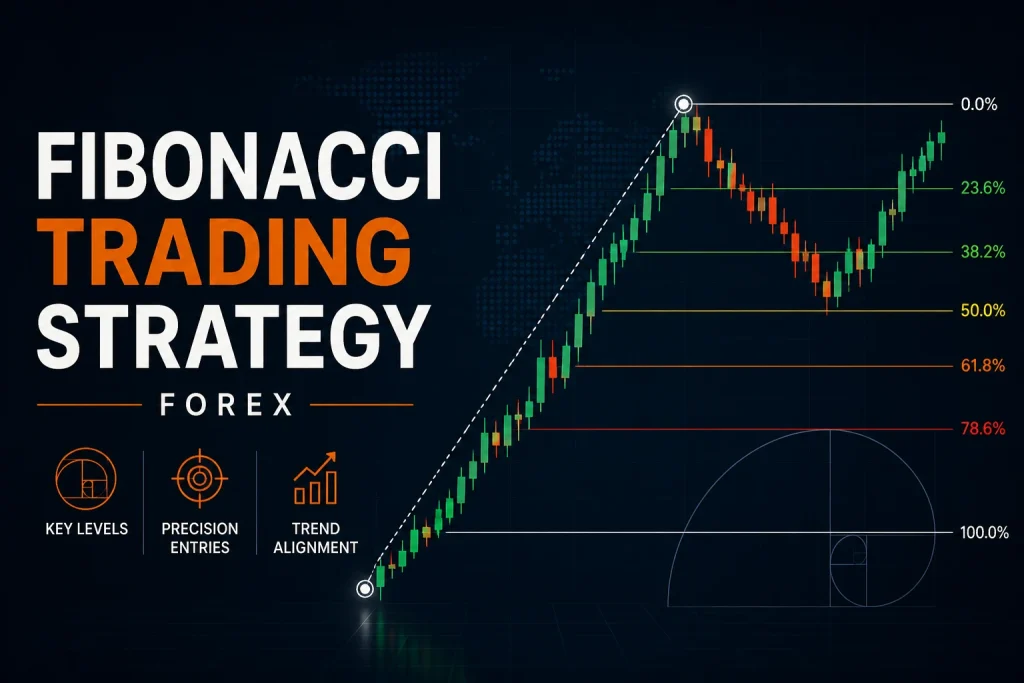
A Fibonacci trading strategy in forex is a rule-based method that uses Fibonacci retracement or extension levels to organize pullback entries, invalidation, and target planning. The strategy usually starts with a clear swing high and swing low, then uses levels such as 38.2%, 50%, 61.8%, 78.6%, 127.2%, and 161.8% as chart zones.
A Fibonacci level is not a trade by itself. A level only becomes part of a forex Fibonacci strategy when it is connected to trend context, a trigger, a stop, a target, spread/slippage assumptions, and a rule for skipping weak setups.
This page focuses on the strategy side. For the wider explanation of ratios, drawing tools, and Fibonacci basics, use the Fibonacci in Forex Trading guide. For the broader pullback concept, use Retracement Forex.
How A Fibonacci Forex Strategy Works
A forex Fibonacci strategy starts by choosing the swing being measured. In an uptrend, traders often draw from a swing low to a swing high and watch the retracement zone below the high. In a downtrend, they often draw from a swing high to a swing low and watch the retracement zone above the low. The trade idea is not the line itself; it is the reaction around the zone.
A complete Fibonacci trading system forex traders can test usually has five parts:
- Context: Is the market trending, ranging, breaking out, or extended?
- Anchor swing: Which swing high and swing low define the Fibonacci measurement?
- Zone: Which retracement or extension area matters for this setup?
- Trigger: What price action confirms that the zone is being respected?
- Invalidation: Where is the setup wrong, and where should the trade be exited?
How To Draw Fibonacci For A Forex Strategy
Use the same drawing direction as the move you are measuring. For a bullish pullback strategy, draw from the swing low to the swing high. For a bearish pullback strategy, draw from the swing high to the swing low. The retracement levels then show possible pullback zones, not guaranteed reversal points.
| Market Situation | How To Draw | Main Zone To Watch | Invalidation Idea |
|---|---|---|---|
| Bullish trend pullback | Swing low to swing high | 38.2%-78.6% retracement | The pullback breaks the swing origin or the latest structure low |
| Bearish trend pullback | Swing high to swing low | 38.2%-78.6% retracement | The pullback breaks the swing origin or the latest structure high |
| Breakout continuation | Measure the impulse before the pullback | Prior swing extreme and 127.2% extension | Breakout fails and price returns through the pullback pivot |
| Extension exhaustion | Measure the prior impulse and extension leg | 127.2%-161.8% extension | Price continues through the extension without reversal trigger |
Do not keep redrawing Fibonacci after every candle to justify a trade. The swing anchors should be chosen before entry. If the anchors change after the trade fails, the result becomes hindsight analysis instead of a testable forex trading Fibonacci strategy. The same drawing logic can be applied on common charting platforms such as MT4, MT5, TradingView-style tools, or any platform that includes Fibonacci retracement and extension tools.
Fibonacci Confluence: What To Check Before Entry
Fibonacci confluence means a retracement or extension zone lines up with another reason to care about that price area. The extra factor does not make the trade safe, but it can help reject weak Fibonacci signals that appear in the middle of random price movement.
| Confluence Check | What It Adds | Skip The Trade When |
|---|---|---|
| Trend direction | Keeps retracement trades aligned with the broader move | The Fibonacci entry fights a clear higher-timeframe trend |
| Support and resistance | Shows whether the Fibonacci zone overlaps a known reaction area | The level sits in the middle of a range with no nearby structure |
| Prior swing high or low | Connects the zone to market structure instead of only a ratio | The swing anchor is unclear or repeatedly redrawn |
| Moving-average slope | Adds a simple trend filter for continuation setups | Price chops above and below the average without direction |
| Rejection or breakout candle | Creates a visible trigger after price reaches the zone | Price touches the level but gives no trigger |
| Spread and stop distance | Checks whether the setup still has room after costs | The stop is too tight, too wide, or cost consumes the potential edge |
For structure-based confluence, review Support And Resistance In Forex. For trend context, review Forex Trend Trading Strategy.
Fibonacci Entries, Stops, And Targets
A publishable forex Fibonacci strategy should separate entry levels from invalidation and target logic. The table below keeps those jobs separate.
| Strategy Component | Common Fibonacci Use | Rule-Based Interpretation |
|---|---|---|
| Entry zone | 38.2%, 50%, 61.8%, or 78.6% retracement | A review area where the trader waits for a trigger, not a buy/sell command |
| Invalidation | Beyond pullback pivot, swing origin, or extension extreme | The point where the setup is wrong and should be exited |
| Continuation target | Prior swing extreme or 127.2%/161.8% extension | A planned exit area that must be checked against risk distance |
| Exhaustion target | Retracement back from a 127.2%-161.8% extension | A reversal target only after a reversal trigger appears |
| Cost filter | Spread and slippage converted into R | A setup can be skipped when costs leave too little expected room |
Fibonacci Strategy Types Tested
The backtest compared five mechanical Fibonacci strategy families. The rules are simplified so they can be tested consistently across six major forex pairs. They are not meant to replace discretionary chart analysis.
1. Shallow Fibonacci Retracement Continuation
This setup looks for a shallow 23.6%-38.2% pullback after a strong swing, then enters only if price starts moving back in the original direction. The idea is that shallow retracements can appear in strong trends, but the test showed that this group was not strong after costs.
- Best use case: Strong trend continuation.
- Main weakness: Pullback can be too small, leaving poor stop and target structure.
- Baseline result: 224 trades, -0.0283R expectancy, 0.946 profit factor, and -6.3293R total net R.
2. Golden-Zone Fibonacci Retracement Continuation
This setup uses the commonly watched 38.2%-61.8% retracement area. Many Fibonacci forex strategy lessons focus on this zone because it is deep enough to offer a pullback but not always deep enough to invalidate the original swing.
- Best use case: Trend continuation after a measured pullback.
- Main weakness: The combined 38.2%-61.8% group was only slightly positive in this test.
- Baseline result: 616 trades, +0.0175R expectancy, 1.0313 profit factor, and +10.8088R total net R.
3. Deep Fibonacci Retracement Continuation
This setup waits for a deeper 61.8%-78.6% pullback, then enters only after price begins moving back in the original swing direction. In this backtest, it was the strongest core Fibonacci retracement strategy.
- Best use case: A trend remains valid after a deep pullback.
- Main weakness: A deep retracement can also mean the trend is weakening, so invalidation must be clear.
- Baseline result: 457 trades, +0.1841R expectancy, 1.3525 profit factor, and +84.1453R total net R.
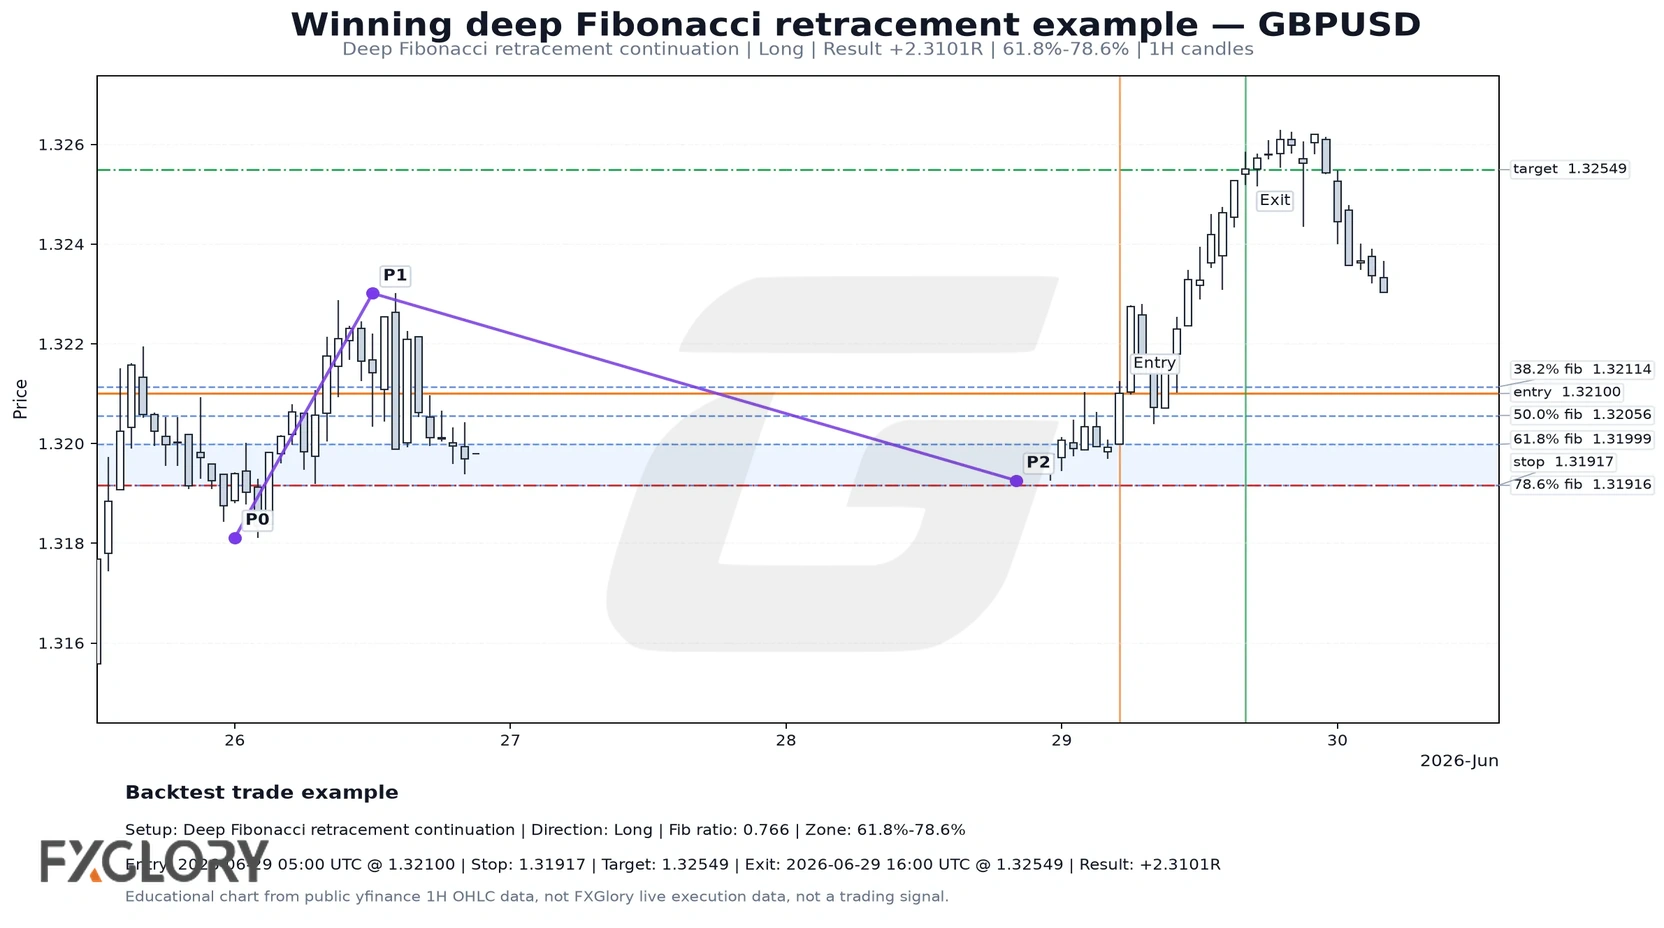
The chart below shows a deep 61.8%-78.6% retracement continuation winner from the educational backtest. It is included because deep retracement continuation was the strongest core setup group in the test.
4. Fibonacci Breakout-To-Extension Continuation
This setup waits for a pullback, then enters when price breaks beyond the original swing extreme and aims toward an extension target. It sounds attractive because it combines Fibonacci retracement with breakout logic, but this was the weakest setup group in the test.
- Best use case: Clean breakouts after a pullback.
- Main weakness: Breakouts can occur after much of the move has already happened.
- Baseline result: 482 trades, -0.0651R expectancy, 0.8496 profit factor, and -31.3724R total net R.
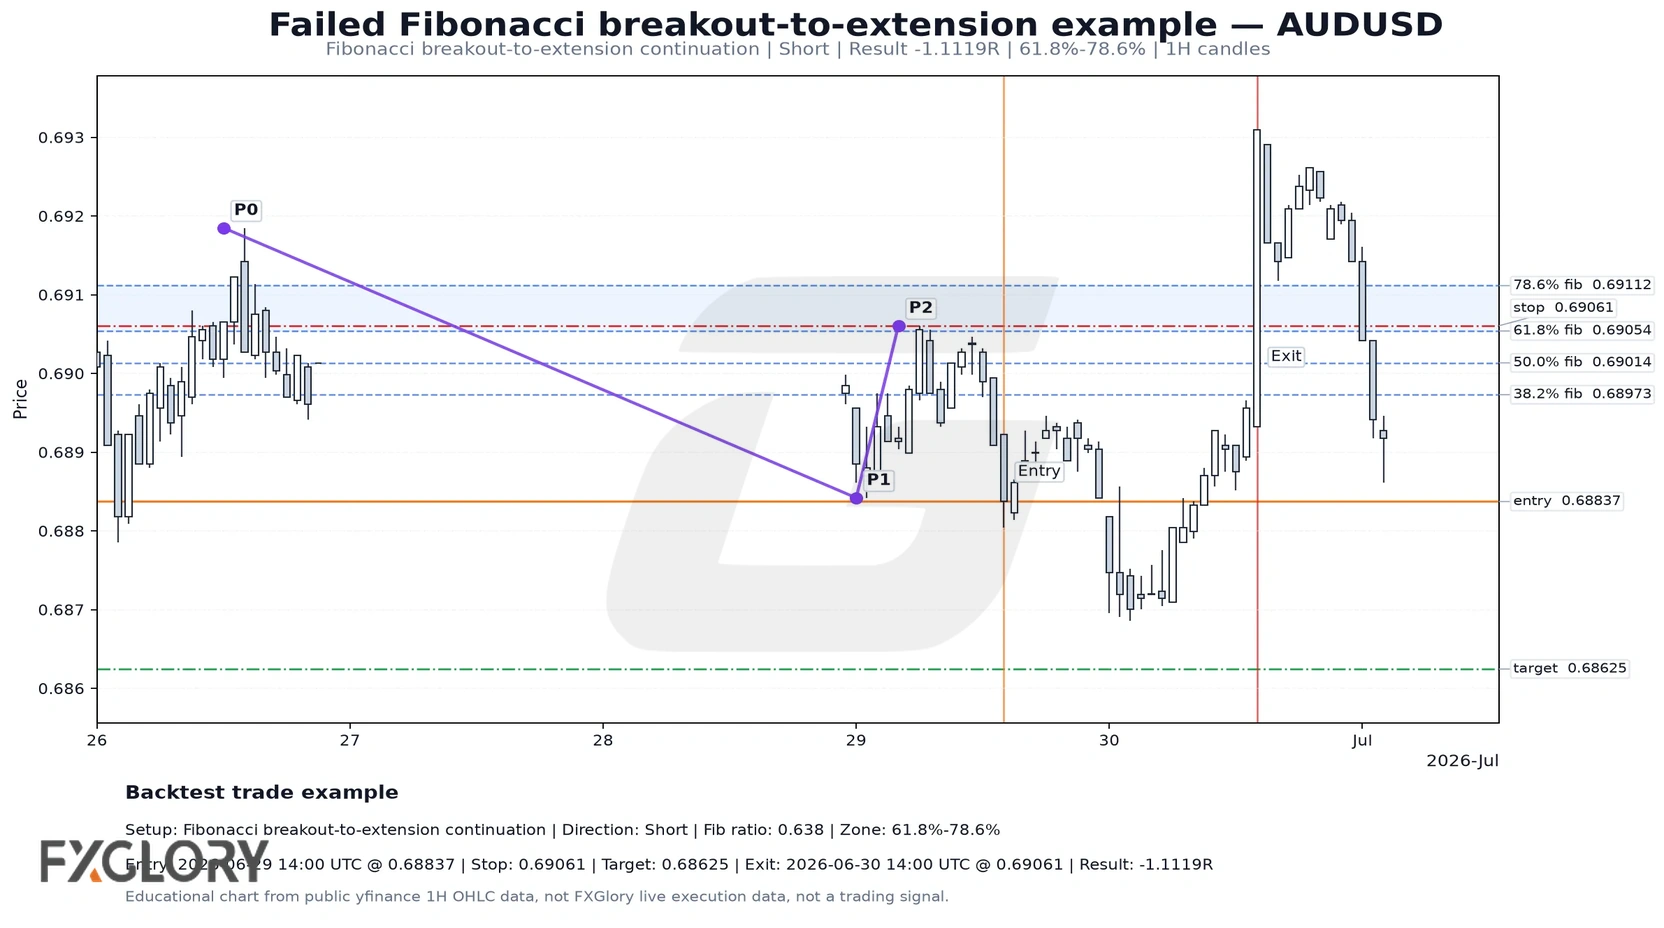
The chart below shows the type of breakout-to-extension failure the test was designed to catch. The setup breaks beyond the prior swing after a Fibonacci pullback, but price returns through the invalidation area instead of continuing toward the extension target.
5. Fibonacci Extension Exhaustion Reversal
This setup looks for price to reach a 127.2%-161.8% extension zone and then trigger a reversal. In this test, the setup had the highest win rate and a strong profit factor, but the sample was smaller than the retracement continuation groups.
- Best use case: Extended price swings that begin to reverse from a measured extension area.
- Main weakness: Extension zones can be broken during strong trends.
- Baseline result: 142 trades, 58.45% win rate, +0.1830R expectancy, 1.4746 profit factor, and +25.9832R total net R.
Backtest Trade Walkthroughs
The examples below are rows from the educational backtest, not FXGlory live execution data. They show how the rules translate into entry, stop, target, exit, and R outcome.
| Pair | Direction | Setup | Entry Time | Entry | Stop | Target | Exit | Fib Ratio | Zone | Exit Reason | Net R |
|---|---|---|---|---|---|---|---|---|---|---|---|
| GBPUSD | Long | Deep Fibonacci retracement continuation | 2026-06-29T05:00:00 UTC | 1.32100 | 1.31917 | 1.32549 | 1.32549 | 0.766 | 61.8%-78.6% | Fib Target Hit | +2.3101R |
| AUDUSD | Short | Fibonacci breakout-to-extension continuation | 2026-06-29T14:00:00 UTC | 0.68837 | 0.69061 | 0.68625 | 0.69061 | 0.638 | 61.8%-78.6% | Stop Loss | -1.1119R |
The first example shows why the deep retracement group led the test: the setup had a defined pullback zone, entry, stop, and target. The second example shows why breakout-to-extension logic was weaker: a breakout after a Fibonacci pullback can still fail quickly when price returns through the invalidation area.
Backtest Summary
The educational backtest used public yfinance 1H OHLC data, 4H swing detection, and 1H trigger/exit logic across EURUSD, GBPUSD, USDJPY, AUDUSD, USDCAD, and USDCHF. It measured results in R only. It did not simulate account balance, compounding, leverage, swap, margin, partial fills, or FXGlory live execution.
| Metric | Baseline Result |
|---|---|
| Setup candidates | 3067 |
| Accepted trades | 1921 |
| Win rate | 43.31% |
| Average win | 1.2594R |
| Average loss | -0.8858R |
| Expectancy | +0.0433R |
| Profit factor | 1.0863 |
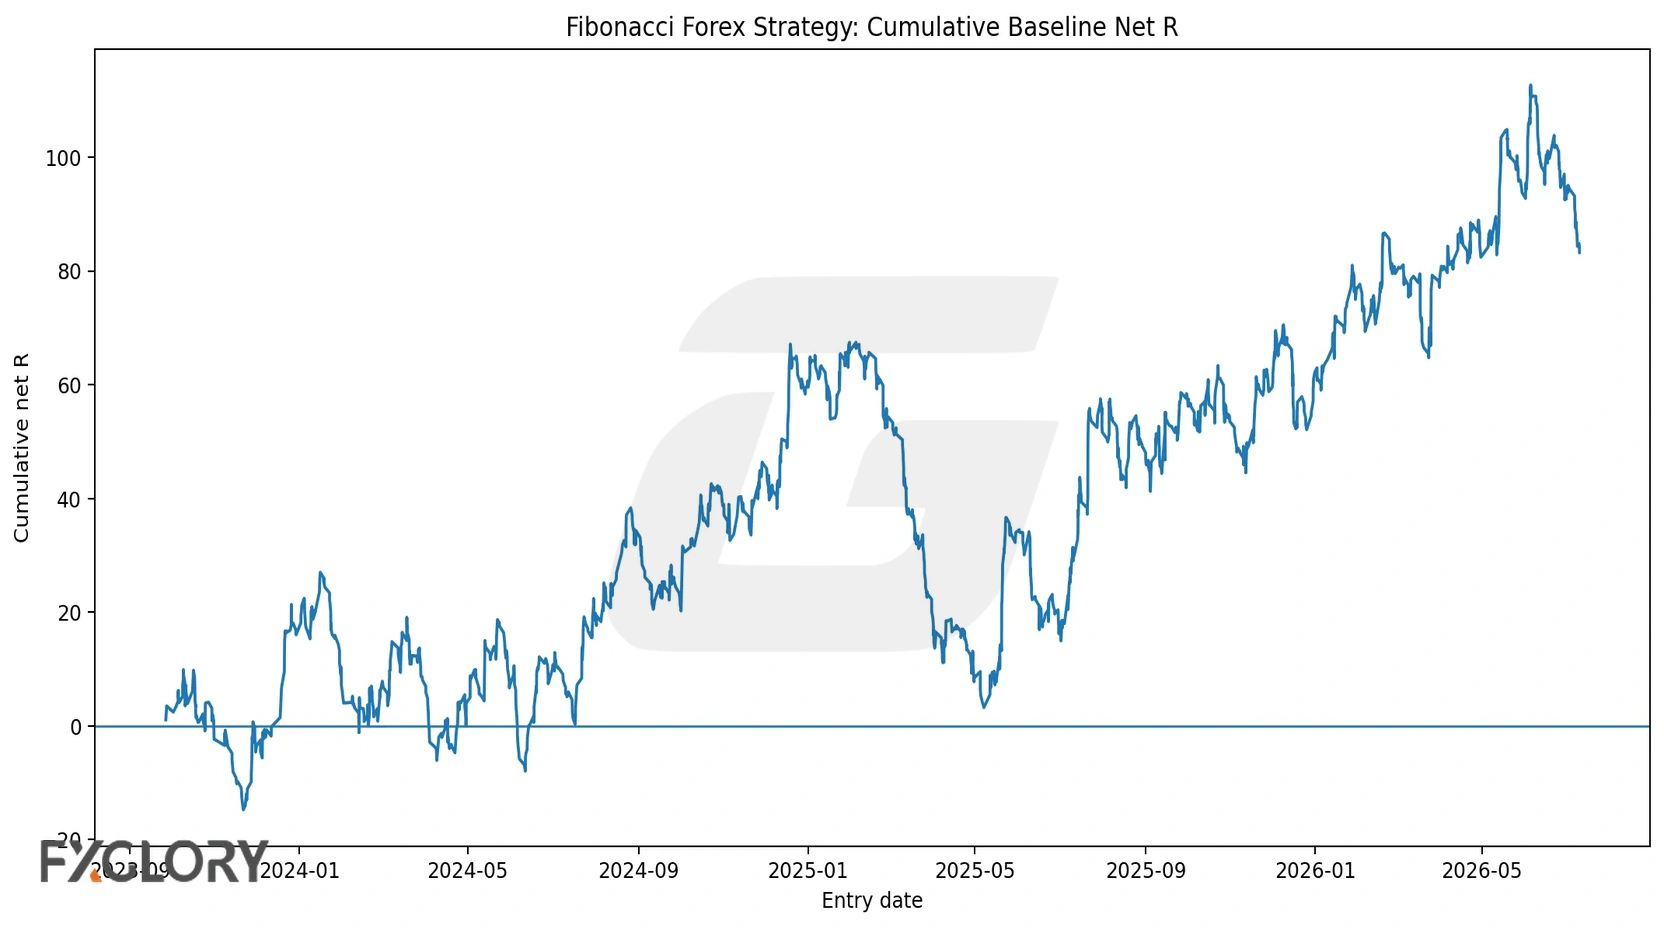
| Total net R | +83.2357R |
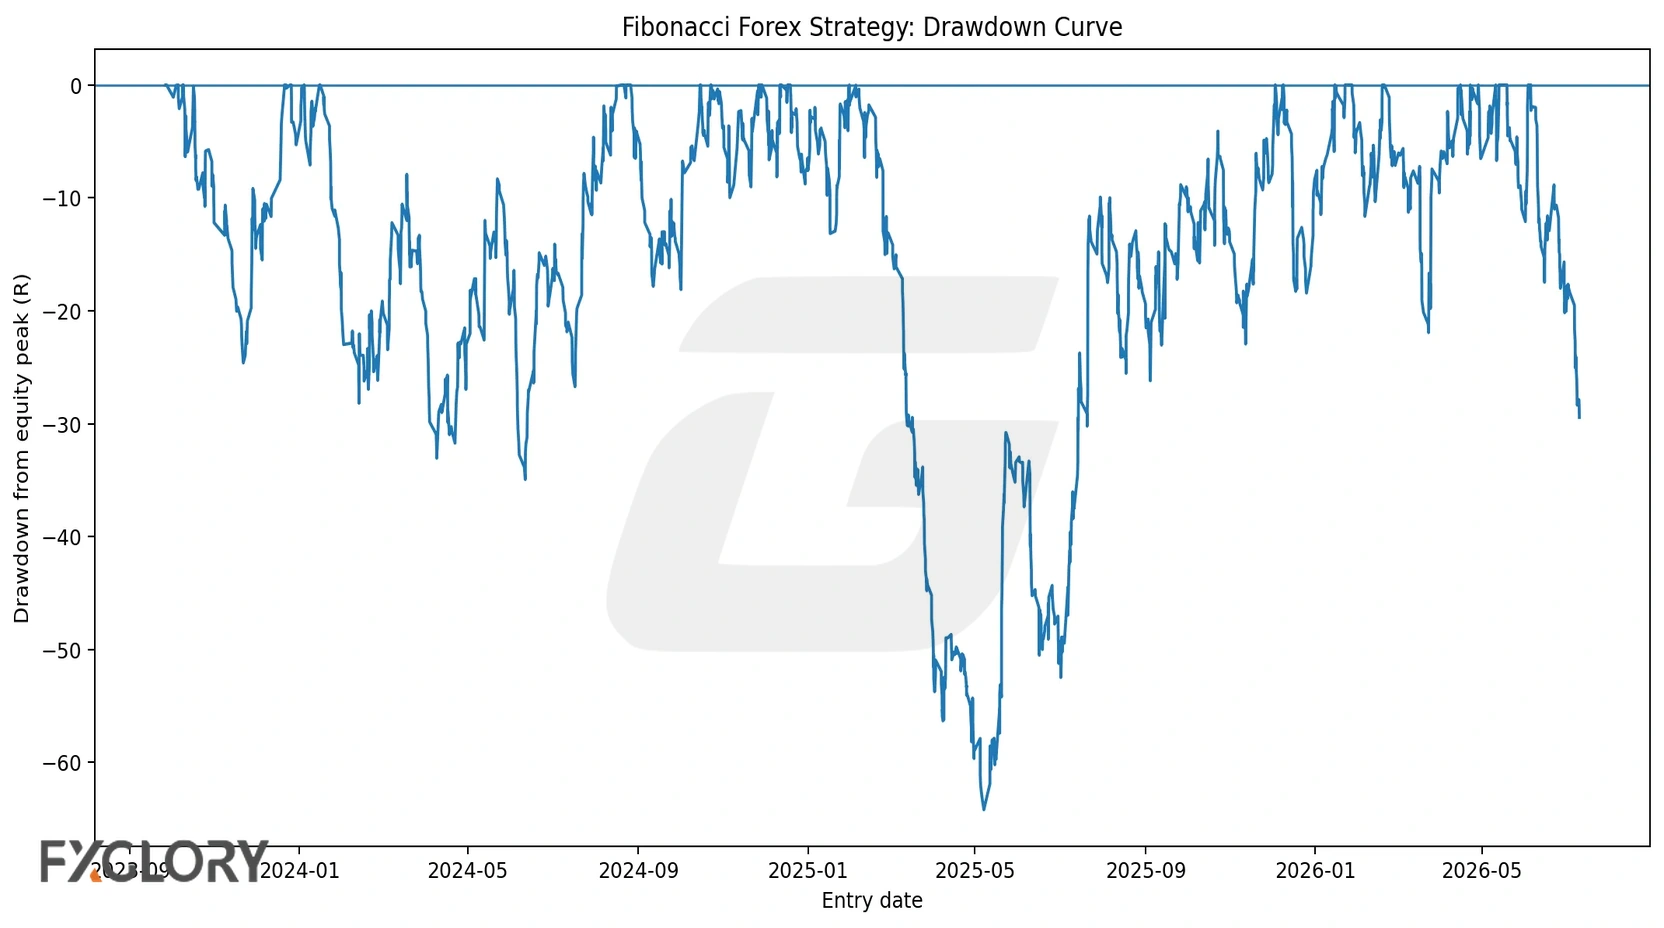
| Maximum drawdown | -64.1884R |
| Worst losing streak | 21 |
| Friday-flat exit rate | 34.83% |
The baseline result was positive, but not strong enough to ignore costs or drawdown. The model produced +0.0433R expectancy and +83.2357R total net R across 1,921 trades, while also reaching a -64.1884R maximum drawdown and a 21-trade worst losing streak.
Setup Results
Setup-level results show why the article should not say “Fibonacci works” in a broad way. Some Fibonacci ideas were positive, while others were negative under the same baseline cost model.
| Setup Type | Trades | Win Rate | Expectancy | Profit Factor | Total Net R | Max Drawdown |
|---|---|---|---|---|---|---|
| Deep Fibonacci retracement continuation | 457 | 44.86% | +0.1841R | 1.3525 | +84.1453R | -18.2660R |
| Fibonacci extension exhaustion reversal | 142 | 58.45% | +0.1830R | 1.4746 | +25.9832R | -6.2059R |
| Golden-zone Fibonacci retracement continuation | 616 | 38.64% | +0.0175R | 1.0313 | +10.8088R | -34.6460R |
| Shallow Fibonacci retracement continuation | 224 | 38.84% | -0.0283R | 0.946 | -6.3293R | -29.7515R |
| Fibonacci breakout-to-extension continuation | 482 | 45.44% | -0.0651R | 0.8496 | -31.3724R | -35.5387R |
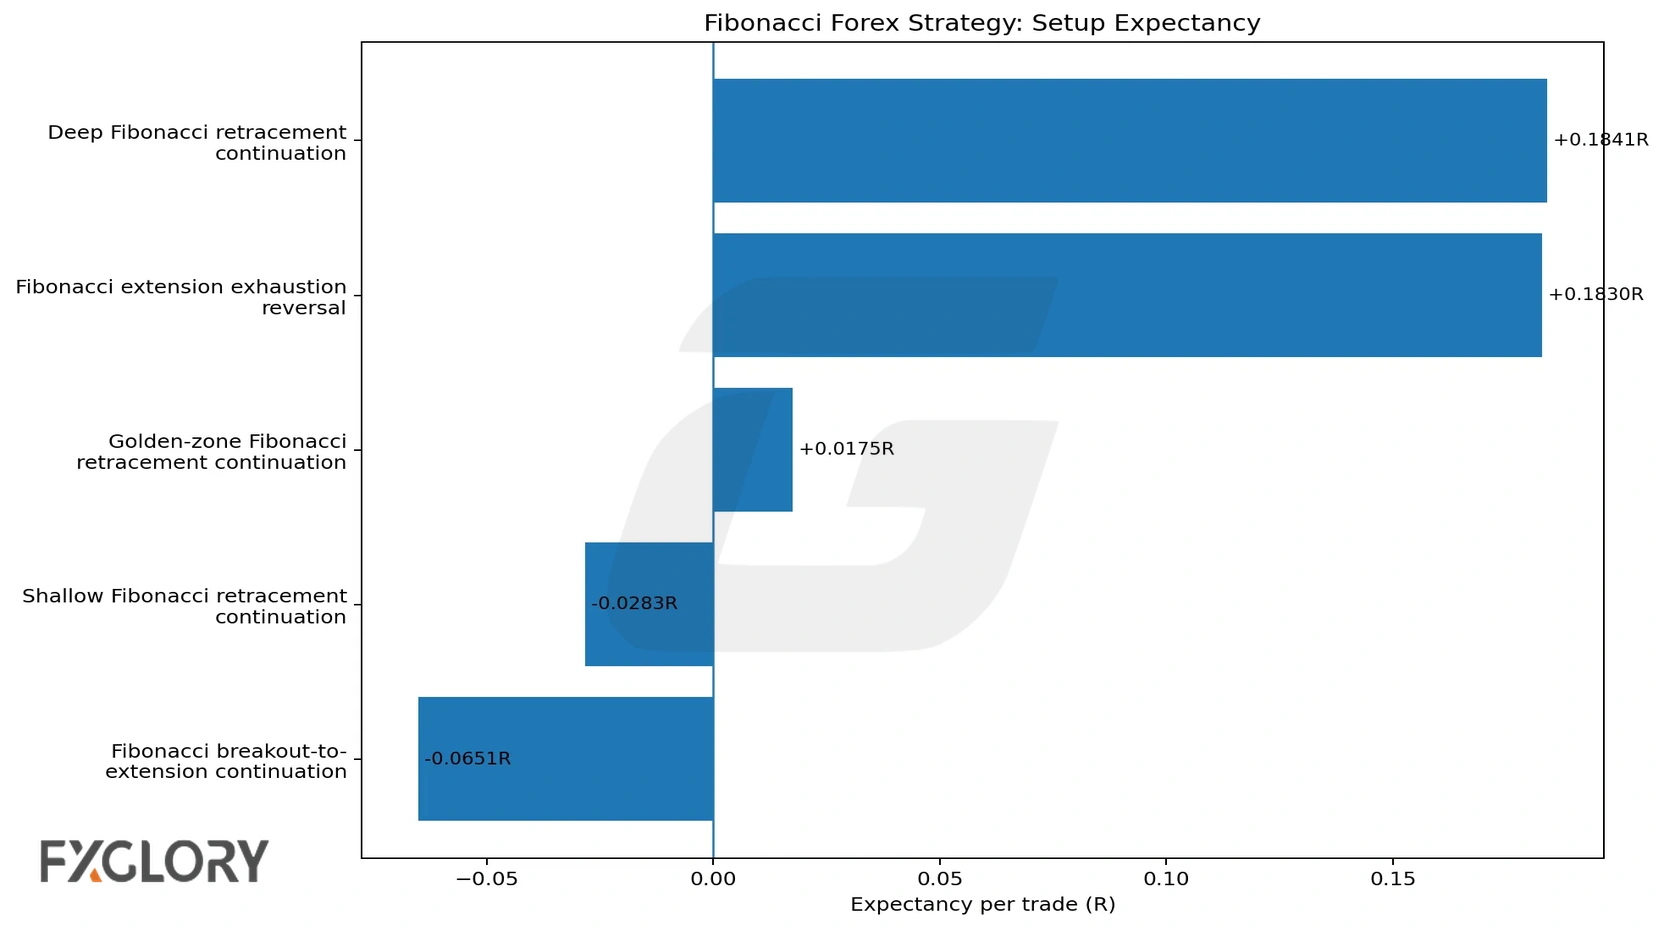
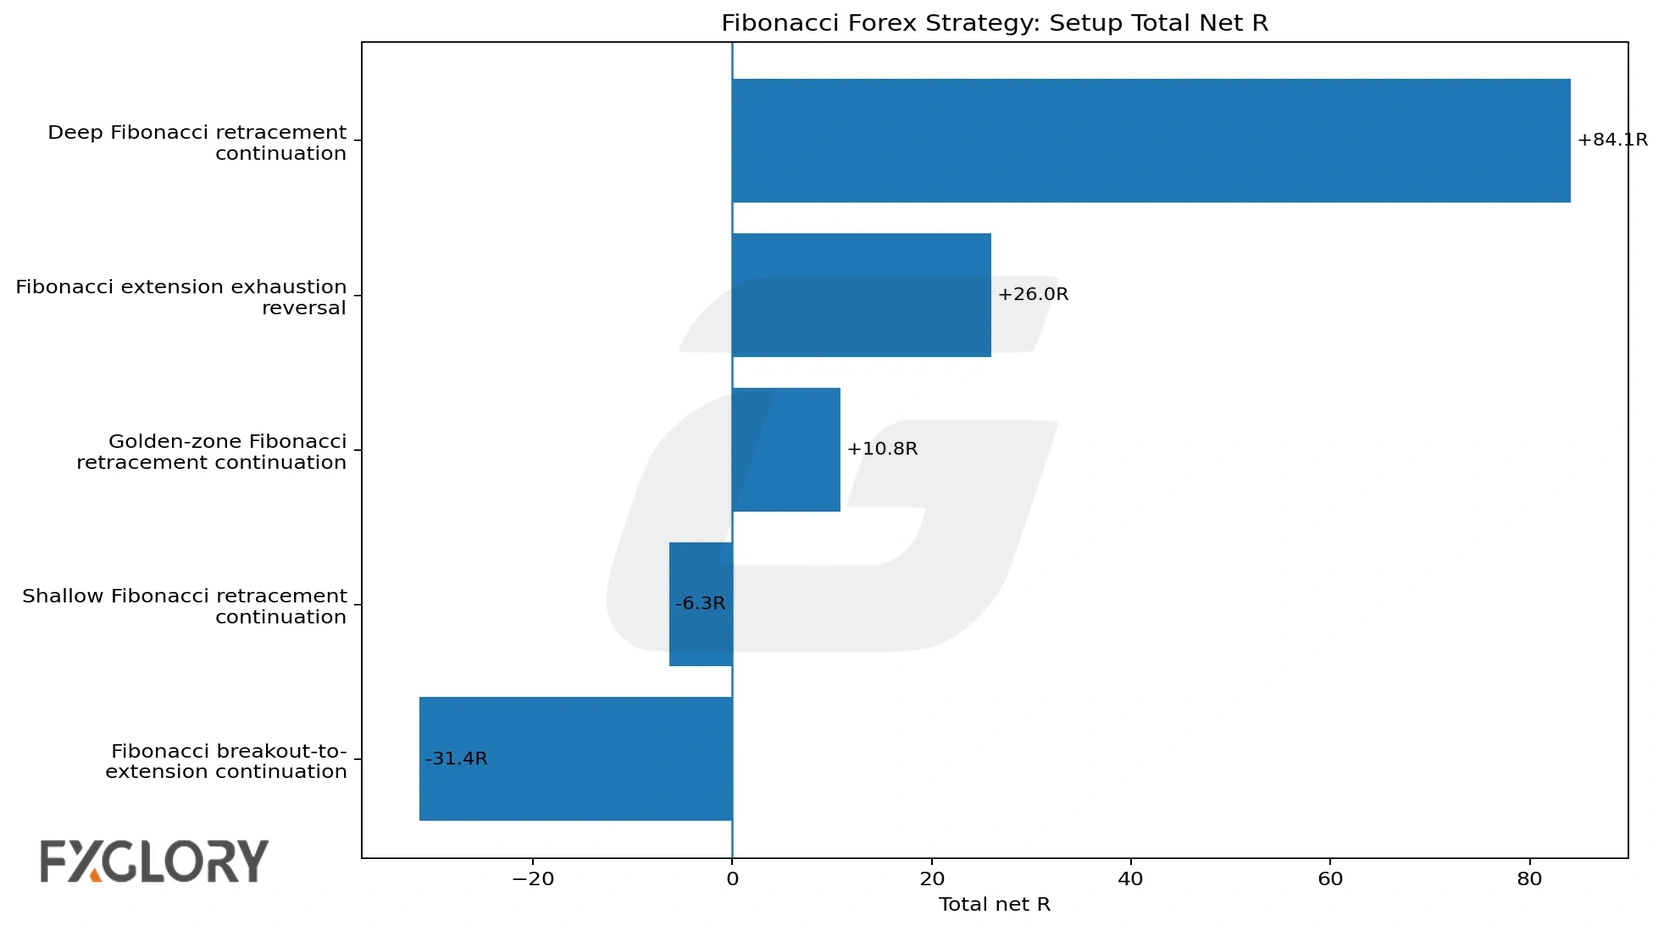
The strongest finding was narrow: deep retracement continuation and extension exhaustion performed best. Breakout-to-extension continuation was negative, even though many traders like the idea of using Fibonacci extensions as breakout targets.
Fibonacci Zone Results
The zone breakdown directly answers which Fibonacci levels were strongest and weakest in this test. The 61.8%-78.6% retracement zone was the best retracement group, while the 127.2%-161.8% extension zone performed well as an exhaustion/reversal area.
| Fibonacci Zone | Trades | Win Rate | Expectancy | Profit Factor | Total Net R |
|---|---|---|---|---|---|
| 127.2%-161.8% | 142 | 58.45% | +0.1830R | 1.4746 | +25.9832R |
| 61.8%-78.6% | 559 | 45.8% | +0.1432R | 1.2857 | +80.0386R |
| 50%-61.8% | 537 | 42.83% | +0.0349R | 1.0685 | +18.7484R |
| 23.6%-38.2% | 224 | 38.84% | -0.0283R | 0.946 | -6.3293R |
| 38.2%-50% | 459 | 38.34% | -0.0767R | 0.8525 | -35.2053R |
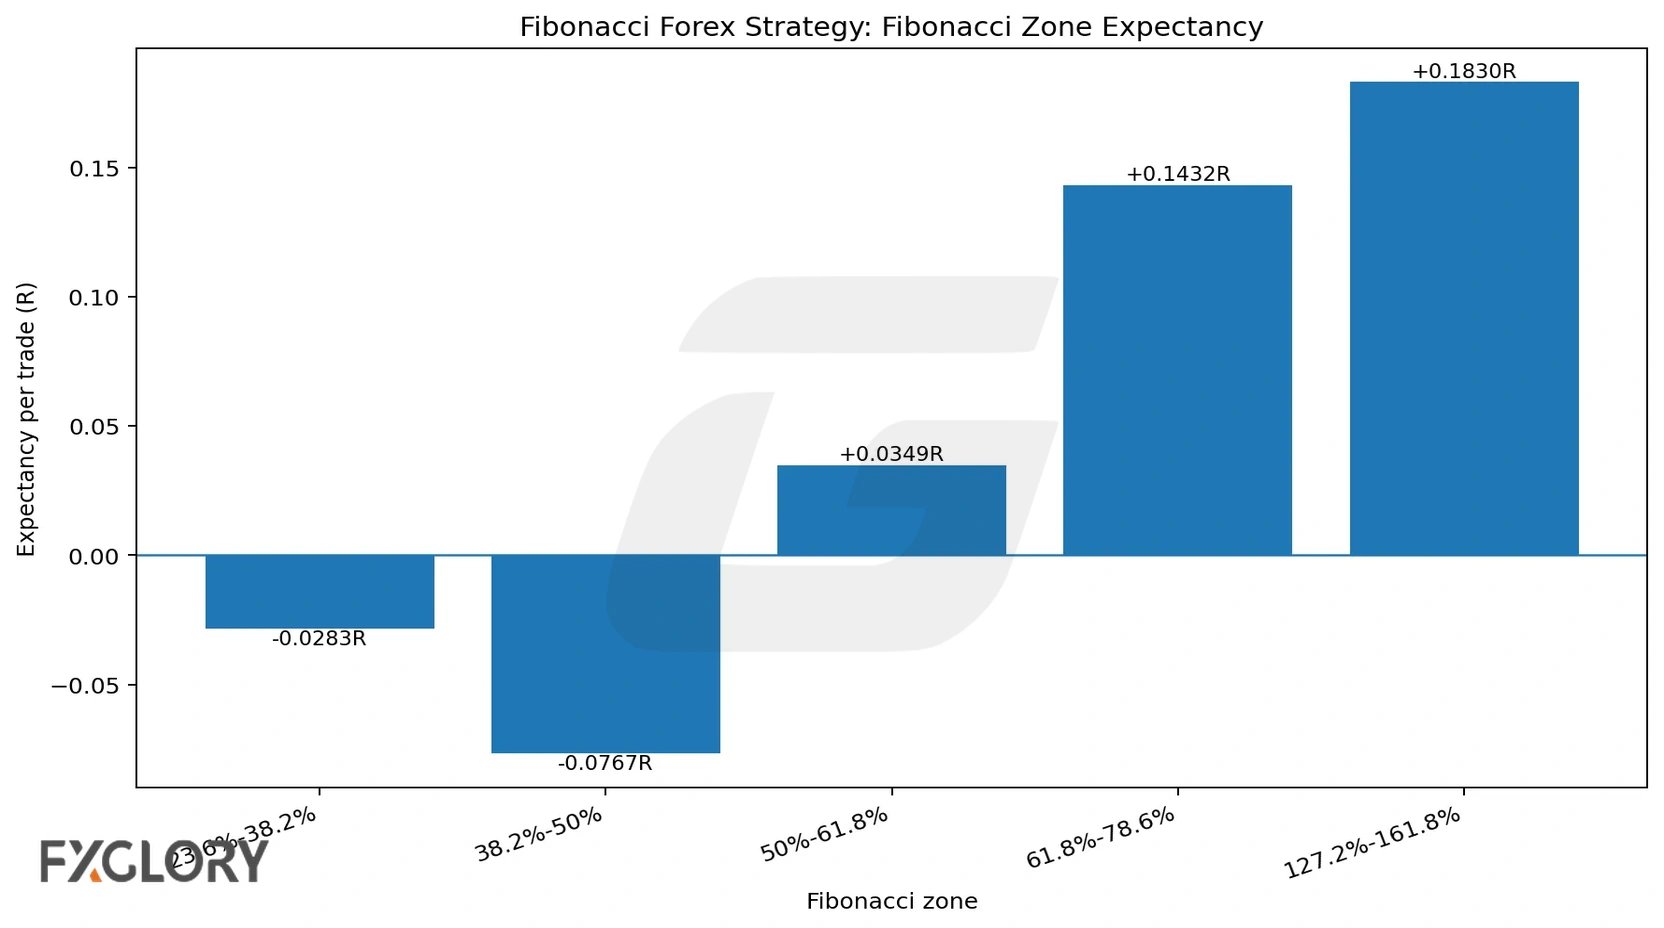
The weak result around the 38.2%-50% zone warns against assuming every popular Fibonacci level has the same value. In this model, the deeper 61.8%-78.6% retracement group was materially stronger.
Spread And Slippage Sensitivity
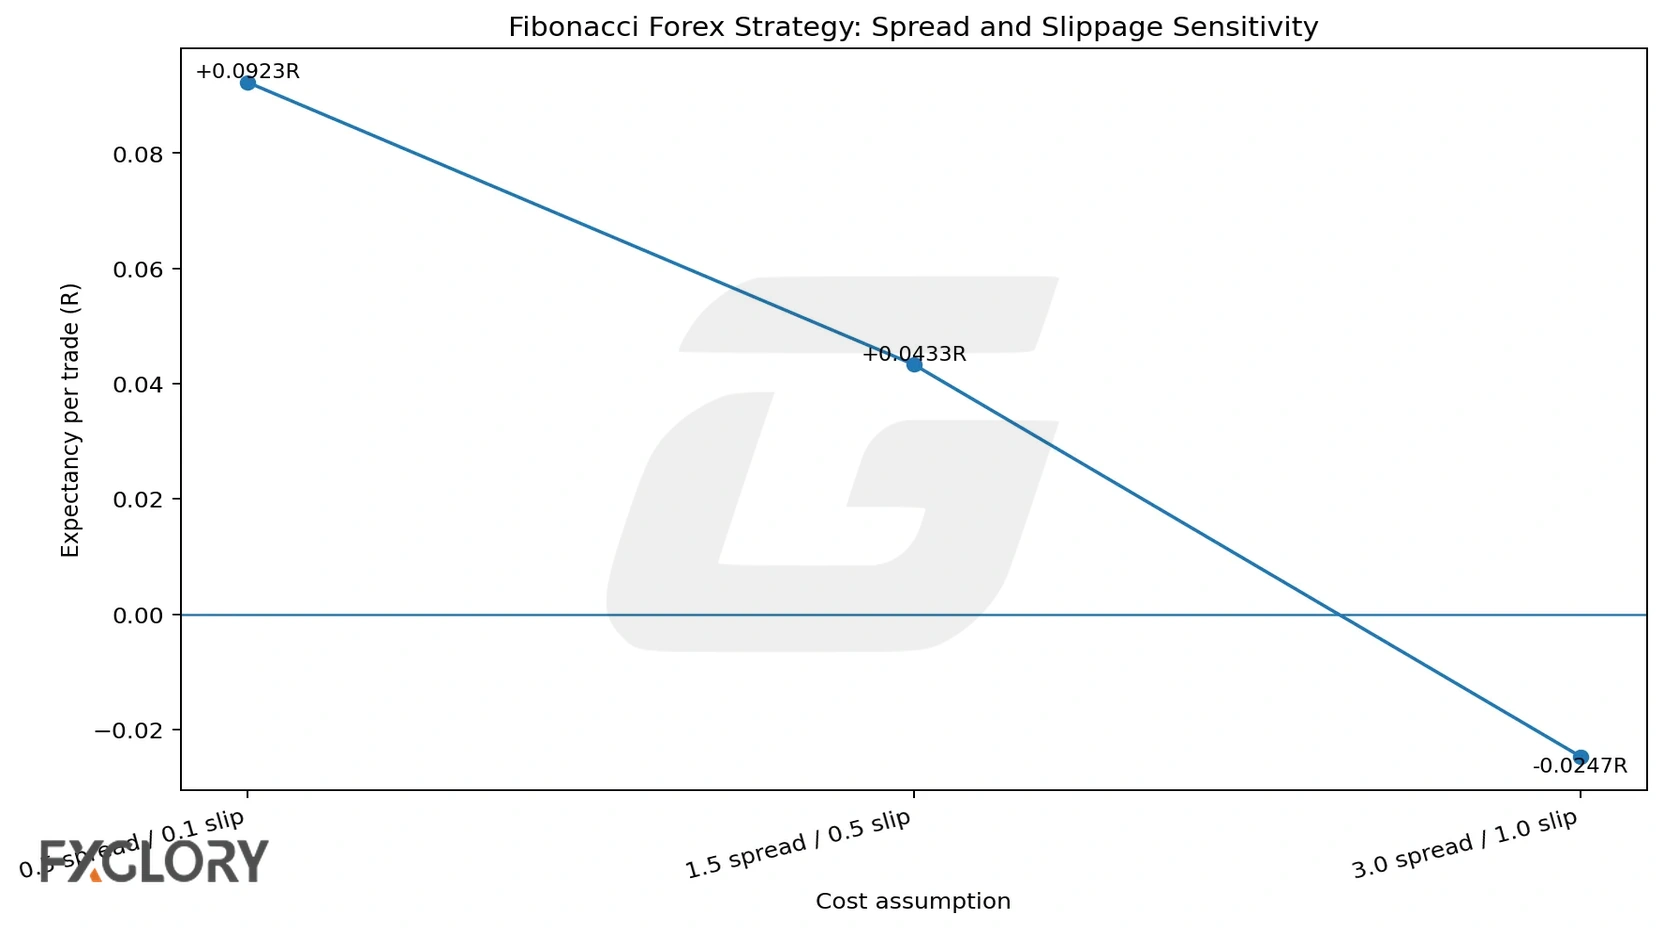
The strategy was cost-sensitive. Under the low-cost assumption, expectancy rose to +0.0923R. Under the baseline assumption, expectancy was +0.0433R. Under the high-cost assumption, the same accepted trades fell to -0.0247R expectancy and -47.4570R total net R.
| Cost Case | Spread | Slippage | Trades | Expectancy | Profit Factor | Total Net R |
|---|---|---|---|---|---|---|
| Low cost | 0.5 pips | 0.1 pips/side | 1921 | +0.0923R | 1.1944 | +177.3344R |
| Baseline | 1.5 pips | 0.5 pips/side | 1921 | +0.0433R | 1.0863 | +83.2357R |
| High cost | 3.0 pips | 1.0 pips/side | 1921 | -0.0247R | 0.9543 | -47.4570R |
Pair-Level Results
The same Fibonacci strategy rules did not behave equally across all forex pairs. USDJPY produced the strongest total net R, while GBPUSD was negative in this run.
| Pair | Trades | Win Rate | Expectancy | Profit Factor | Total Net R | Max Drawdown |
|---|---|---|---|---|---|---|
| USDJPY | 336 | 44.94% | +0.1221R | 1.2557 | +41.0288R | -14.8195R |
| EURUSD | 291 | 46.39% | +0.1005R | 1.2079 | +29.2513R | -14.8249R |
| USDCHF | 351 | 43.87% | +0.0623R | 1.1242 | +21.8794R | -14.3955R |
| AUDUSD | 323 | 43.34% | +0.0411R | 1.0822 | +13.2716R | -24.4248R |
| USDCAD | 305 | 45.57% | +0.0353R | 1.0753 | +10.7749R | -23.9143R |
| GBPUSD | 315 | 35.87% | -0.1047R | 0.8197 | -32.9703R | -41.1261R |
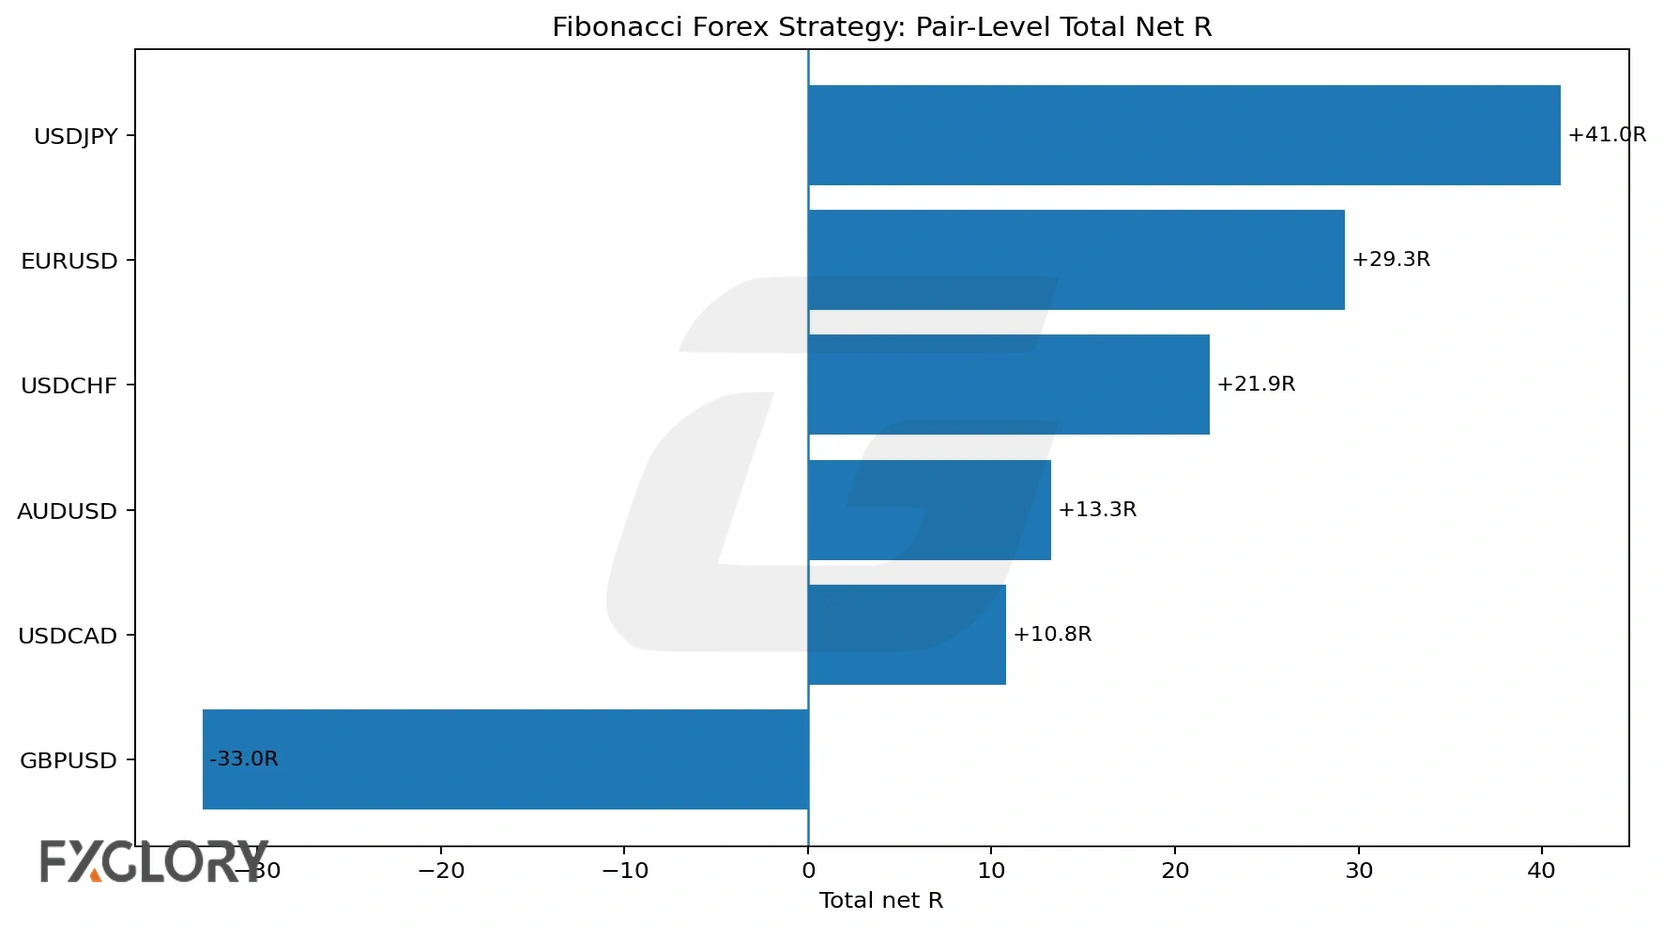
Pair-level variation matters because a Fibonacci trading system forex traders apply across every market may become weaker if spread, volatility, session behavior, or trend structure differ by pair. Review available currency pairs before assuming the same setup belongs on every chart.
Session Results
Session results grouped entries by UTC time. London morning was strongest, while the London/New York overlap group was negative in this test.
| Session Group | Trades | Win Rate | Expectancy | Profit Factor | Total Net R |
|---|---|---|---|---|---|
| London morning | 342 | 50.58% | +0.2166R | 1.4731 | +74.0734R |
| Early New York afternoon | 301 | 48.17% | +0.0835R | 1.2067 | +25.1331R |
| Rollover/off-hours | 837 | 39.55% | +0.0234R | 1.0421 | +19.5711R |
| London/New York overlap | 441 | 41.5% | -0.0806R | 0.8399 | -35.5420R |
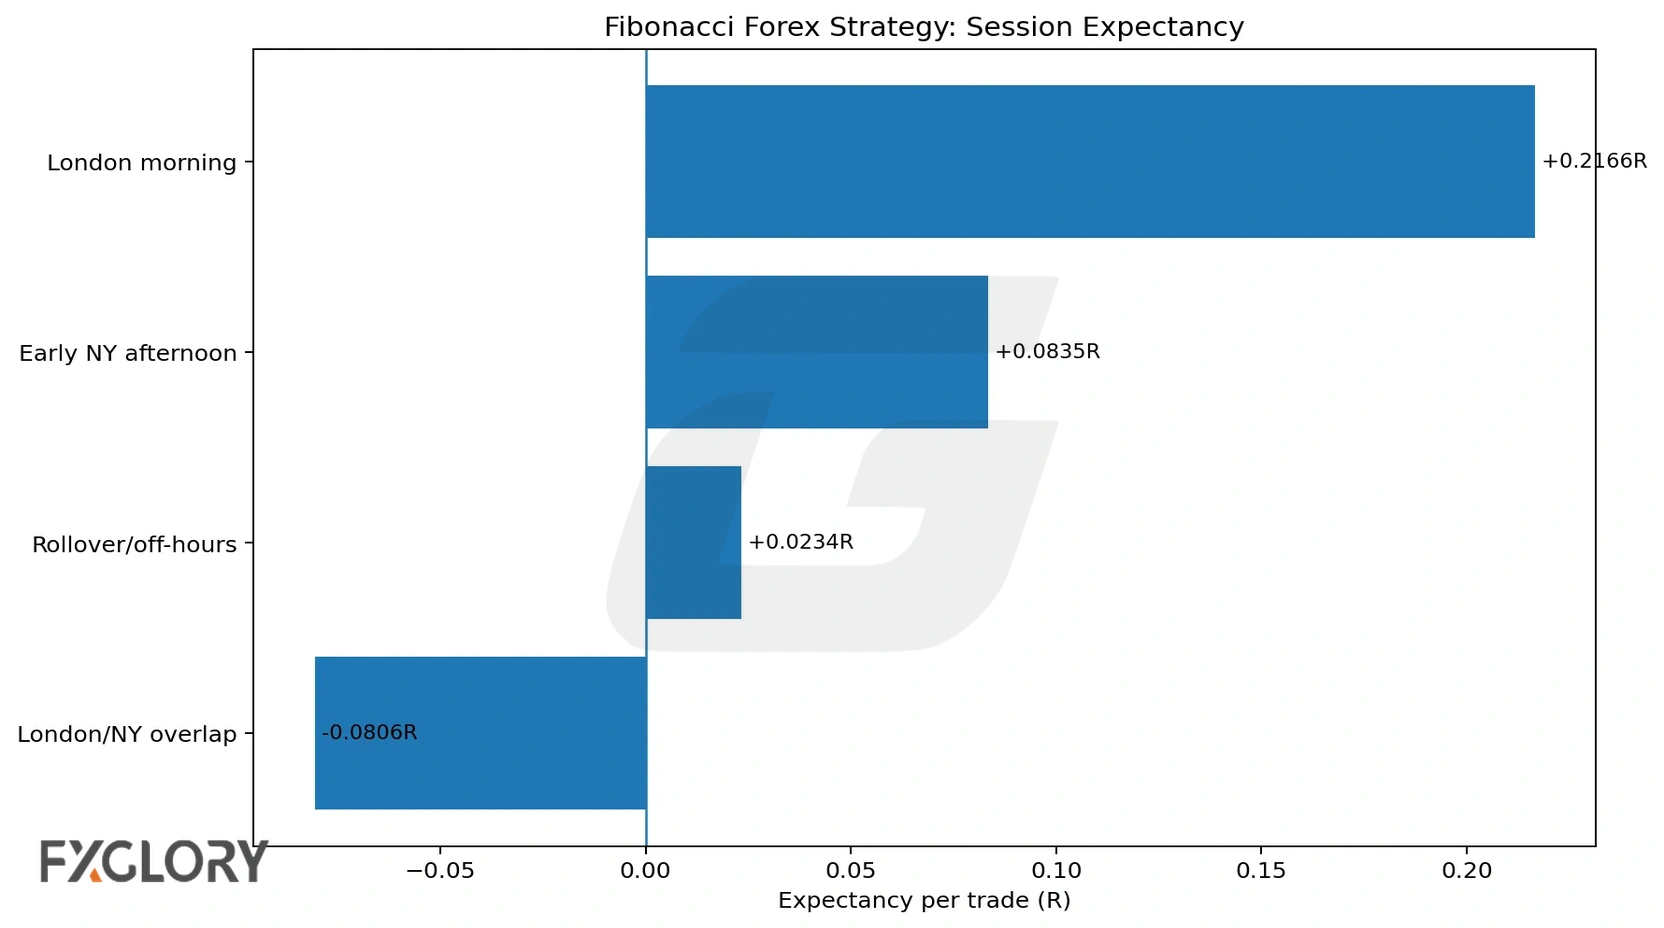
This does not mean one session will always be better. It means a forex Fibonacci strategy should be reviewed alongside liquidity, spread, volatility, rollover timing, and news-event risk.
Robustness Checks
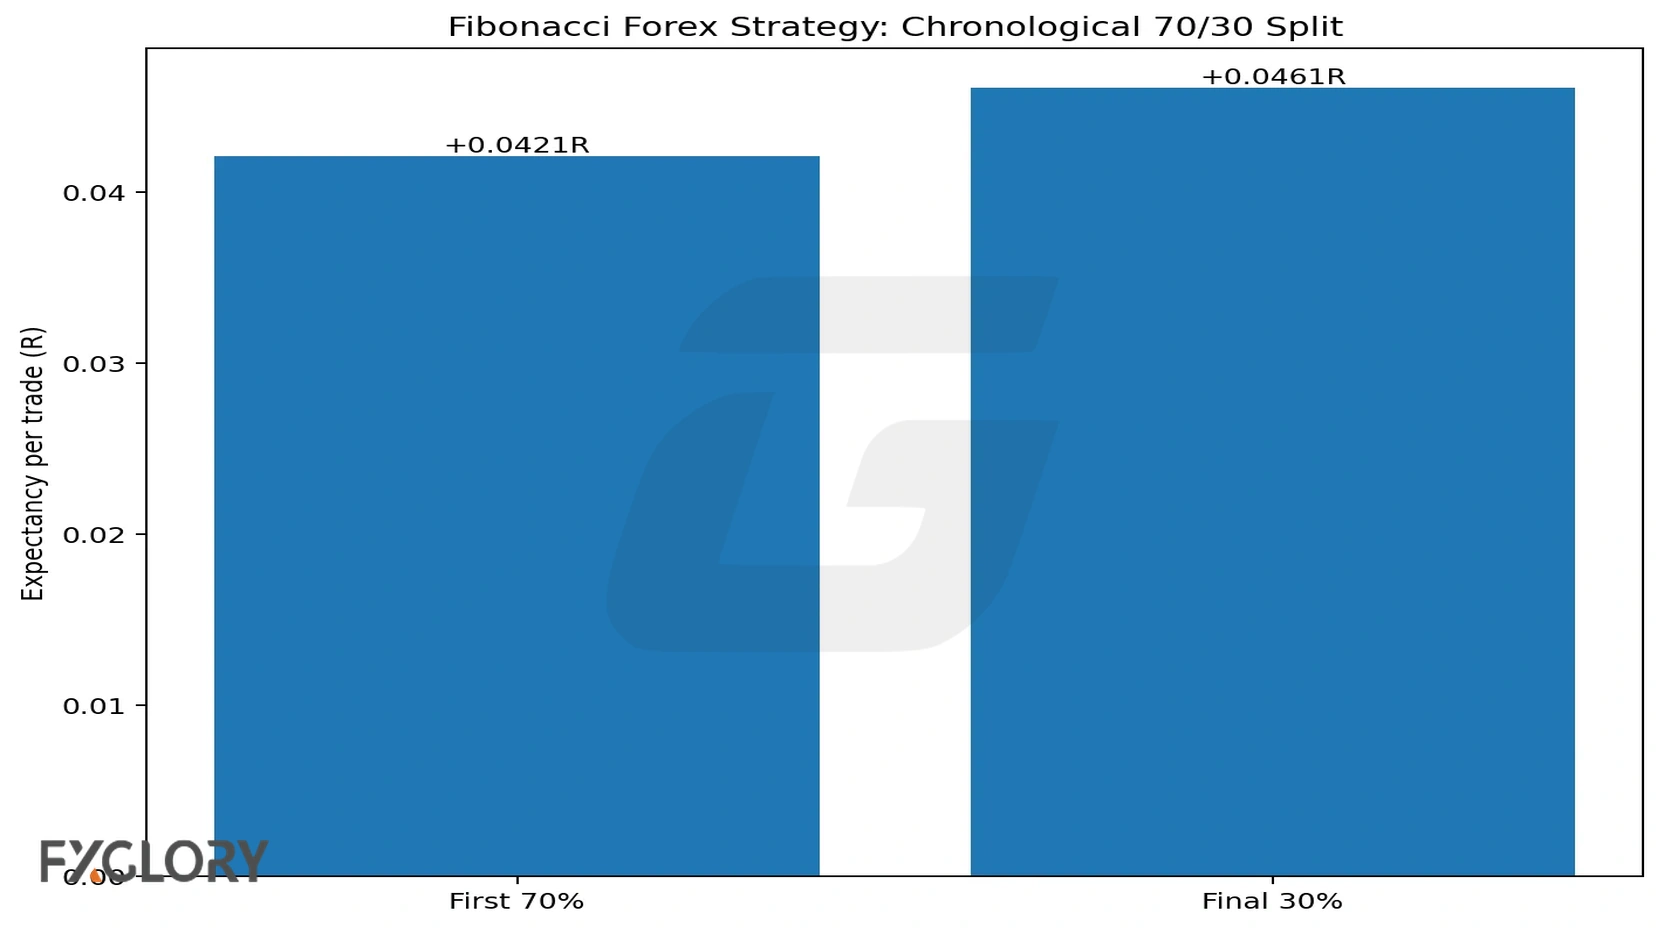
The v2 test added robustness diagnostics because one positive overall number is not enough. The chronological 70/30 split stayed positive in both segments: +0.0421R in the first 70% and +0.0461R in the final 30%. A one-open-trade-per-pair diagnostic also stayed positive at +0.0436R expectancy, but with fewer trades and lower total net R.
| Diagnostic | Trades | Expectancy | Profit Factor | Total Net R | Max Drawdown |
|---|---|---|---|---|---|
| First 70% chronological segment | 1344 | +0.0421R | 1.0826 | +56.6450R | -64.1884R |
| Final 30% chronological segment | 577 | +0.0461R | 1.0953 | +26.5907R | -29.4345R |
| One-open-trade-per-pair diagnostic | 1110 | +0.0436R | 1.0827 | +48.3742R | -50.6182R |
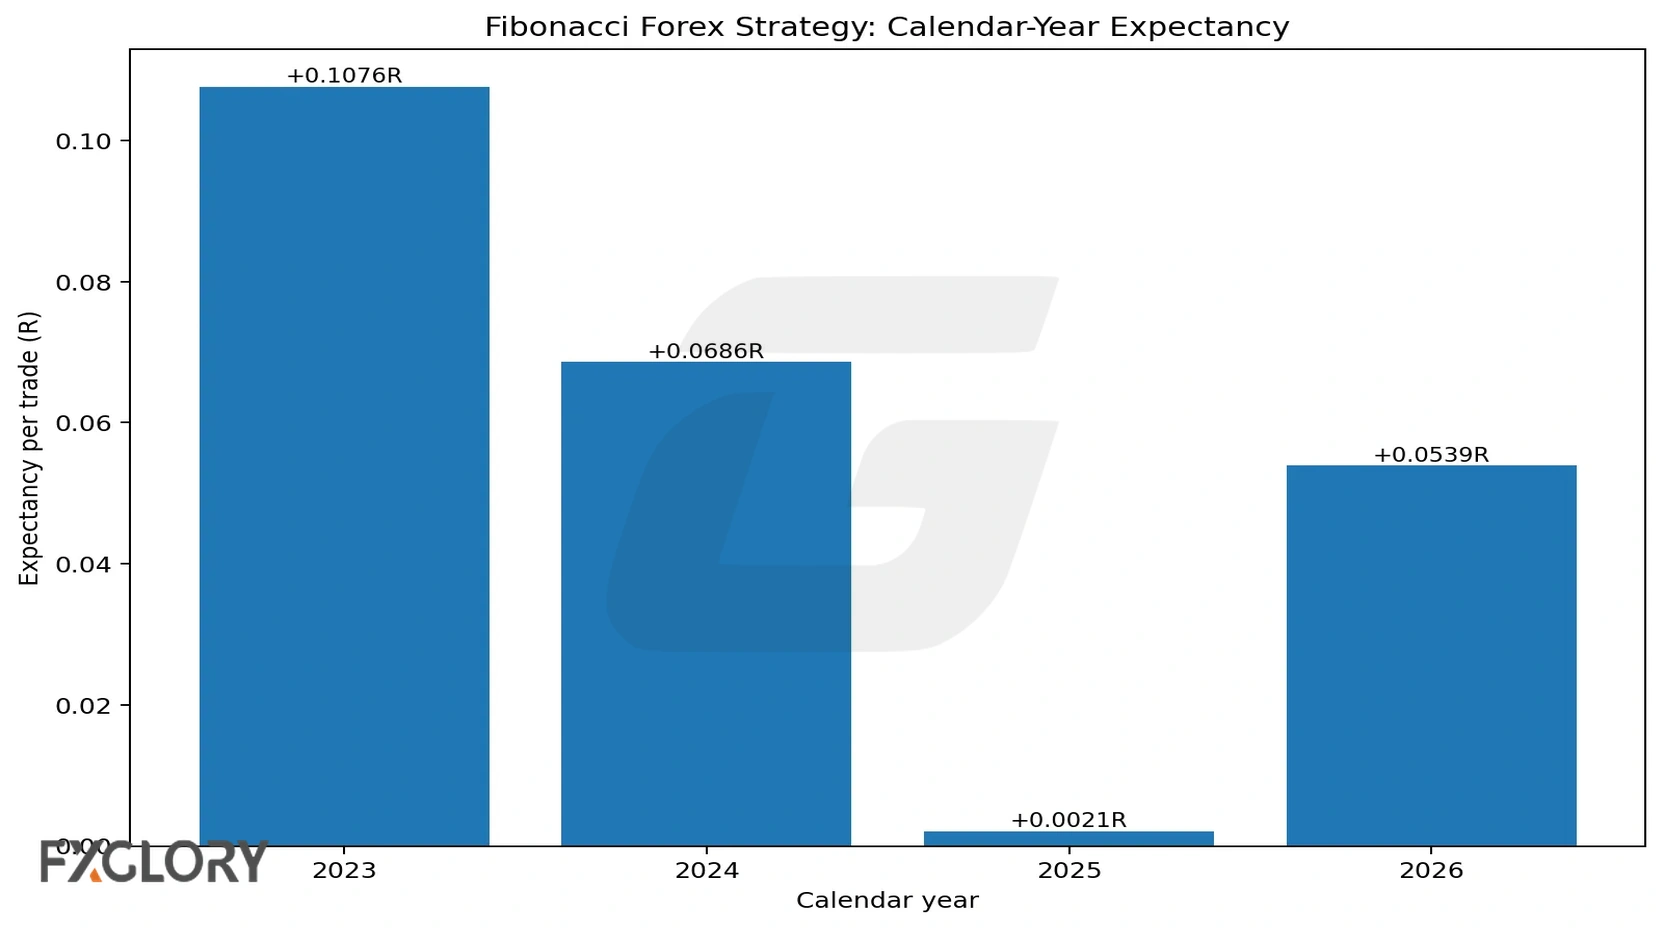
Calendar-year results were positive in 2023, 2024, and 2026, but nearly flat in 2025. That prevents the page from overstating the result.
| Year | Trades | Win Rate | Expectancy | Profit Factor | Total Net R |
|---|---|---|---|---|---|
| 2023 | 149 | 46.31% | +0.1076R | 1.2214 | +16.0386R |
| 2024 | 650 | 44.0% | +0.0686R | 1.1361 | +44.5856R |
| 2025 | 731 | 41.59% | +0.0021R | 1.004 | +1.5301R |
| 2026 | 391 | 44.25% | +0.0539R | 1.1136 | +21.0813R |
Timeframes, Scalping, And Swing Trading
This backtest is not a one-minute Fibonacci scalping model. It used 4H swing context and 1H trigger/exit logic, so the results belong closer to swing-style forex strategy research than ultra-short-term scalping.
Shorter timeframes can create more Fibonacci touches, but they also make spread, slippage, and noise more important. A Fibonacci forex trading strategy that looks acceptable on a 1H chart can behave differently on a 5-minute or 1-minute chart because the stop distance is usually smaller and the cost deduction can become larger in R terms.
Practical Rules For A Fibonacci Trading Strategy Forex Traders Can Test
- Use Fibonacci as a zone tool, not a signal generator. A 61.8% retracement means price is in a reference area; it does not mean price must reverse.
- Anchor the swing before entry. Do not redraw the swing after the trade fails.
- Separate retracement strategies from breakout strategies. In this test, deep retracement continuation was positive, while breakout-to-extension continuation was negative.
- Define invalidation before entry. A setup without a stop rule is not a strategy.
- Check trading costs. The high-cost model turned negative, so spread and slippage cannot be ignored.
- Review pair and session behavior. USDJPY and London morning were strongest in this run, but that does not guarantee future performance.
Common Fibonacci Forex Strategy Mistakes
| Mistake | Why It Hurts The Strategy | Better Rule |
|---|---|---|
| Buying or selling every Fibonacci level | Levels appear often and many will fail | Require trend context, trigger, stop, and target |
| Redrawing swings after entry | Turns the method into hindsight analysis | Choose the swing before entry and keep it fixed |
| Using 61.8% as a magic number | A ratio is not proof of reversal | Treat the zone as a place to investigate, not a prediction |
| Ignoring spread and slippage | Small edges can disappear after costs | Run low, baseline, and high-cost tests |
| Using the same rule on every pair | Pairs differ in volatility and cost behavior | Review pair-level results before applying rules broadly |
Where This Strategy Fits In FXGlory Learn
This page should not replace the Fibonacci indicator/technical-analysis guide. The Fibonacci in Forex Trading page owns Fibonacci definitions, ratios, and drawing basics. This page owns tested Fibonacci strategy rules.
For related strategy context, use Forex Swing Trading Strategy, Forex Trend Trading Strategy, Forex Entry And Exit Strategy, Forex Risk Management Strategy, and Forex Multiple Time Frame Analysis.
Final Takeaway
The best Fibonacci strategy for forex in this educational mechanical test was not the most common generic answer. The strongest core setup was deep 61.8%-78.6% retracement continuation, while 127.2%-161.8% extension exhaustion reversal also performed well on a smaller sample.
The overall baseline model was positive, but fragile enough to require caution: +0.0433R expectancy, 1.0863 profit factor, +83.2357R total net R, -64.1884R maximum drawdown, and a negative result under high cost assumptions. A Fibonacci forex strategy can organize swing entries and targets only when confirmation, invalidation, risk control, and cost testing are defined before entry.