Time Zone: GMT +3

Time Frame: 4 Hours H4

Fundamental Analysis:

The XAUUSD pair, also known as Gold Spot versus the US Dollar, remains highly sensitive to USD news today as traders monitor ADP employment data, S&P Global Services PMI, ISM Services PMI, Factory Orders, the Fed Beige Book, EIA crude inventories, and speeches from Fed officials including Goolsbee, Barr, and Logan. Stronger than expected US labor or services data could support the US Dollar and Treasury yields, which may pressure Gold price action, while weaker data or dovish Federal Reserve commentary could increase demand for Gold as a safe haven asset. This makes today’s XAUUSD H4 technical and fundamental analysis especially important, as Gold daily chart sentiment may shift quickly depending on inflation expectations, interest rate outlook, and broader market risk appetite.

Price Action:

The Gold H4 chart shows a bearish to sideways correction, with price making lower highs beneath the red descending trendline after a strong previous rally. Current XAU/USD price action is holding near the 4471 support area, but the market remains capped below the main resistance zone around 4700, showing that sellers still control the short term structure. The broader Gold H4 forecast suggests consolidation unless buyers break above the descending triangle resistance, while a failure to hold 4471 and 4380 could extend bearish momentum toward lower support zones.

Key Technical Indicators:

Bollinger Bands(20,2.000): The Bollinger Bands on the Gold H4 chart are tightening, showing reduced volatility and a possible buildup before the next breakout. Price is trading near the lower side of the bands, which reflects weak bullish momentum and continued downside pressure. For XAU-USD technical analysis, this setup suggests that Gold may remain in consolidation unless price breaks clearly above the middle band and descending trendline.

MACD(12,26,9): The MACD is flat and slightly bearish, with values around -5.774 and -1.355, confirming weak momentum on the XAU/USD H4 chart. The lack of strong histogram expansion suggests that sellers are present but not yet driving a major impulsive move. Traders should watch for a bearish widening below the signal line or a bullish crossover to confirm the next Gold market direction.

RSI(14): The RSI is around 43, which indicates weak momentum but not yet oversold conditions. This means Gold still has room to move lower before reaching extreme downside exhaustion. In XAUUSD H4 price action analysis, RSI below the 50 level supports the bearish to neutral outlook unless buyers regain momentum above the midline.

Support and Resistance:

Support: The immediate support area is near 4471, followed by stronger downside support around 4380 and 4338 if selling pressure continues.

Resistance: The nearest resistance is around 4700, followed by 4880 and 5060, while a stronger bullish breakout could expose 5240, 5420, and 5605.

Conclusion and Consideration:

The XAU-USD H4 technical analysis shows Gold trading in a bearish to sideways correction, with price compressed under a descending red trendline and struggling to regain bullish momentum. Bollinger Bands, MACD, RSI, and Fibonacci levels all suggest caution, as Gold price action remains weak while holding near support. Fundamentally, today’s USD news, Fed speeches, ADP employment data, Services PMI, ISM PMI, Factory Orders, and Beige Book could create sharp volatility in GOLD versus the US Dollar. A breakout above 4700 may shift the Gold H4 outlook toward recovery, while a breakdown below 4471 and 4380 could strengthen the bearish daily chart forecast.

Disclaimer: The analysis provided for GOLD/USD is for informational purposes only and does not constitute investment advice. Traders are encouraged to perform their own analysis and research before making any trading decisions on GOLDUSD. Market conditions can change quickly, so staying informed with the latest data is essential.

GOLD H4 Technical and Fundamental Analysis for 06.03.2026

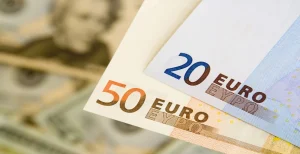
Time Zone: GMT +3

Time Frame: 4 Hours (H4)

Fundamental Analysis:

The EURUSD H4 technical and fundamental analysis is expected to remain sensitive to Eurozone retail sales, manufacturing PMI data, ECB money supply, private loans, and unemployment figures, all of which can influence expectations for Eurozone economic strength. Stronger-than-expected EUR data could support the Euro by signaling healthier consumer spending, business activity, and credit growth. On the USD side, traders are monitoring remarks from Federal Reserve Governor Jerome Powell, S&P Global Manufacturing PMI, ISM Manufacturing PMI, ISM Prices Paid, and Construction Spending. Hawkish Fed commentary or stronger US manufacturing data could support the US Dollar and pressure the EURUSD price action. Overall, today’s EURUSD daily analysis and H4 forex forecast suggests that both European growth indicators and US monetary policy expectations may drive volatility.

Price Action:

The EURUSD H4 price action analysis shows that despite the candles falling with gradual speed, the lower levels of the chart are forming a classic bullish pennant-style structure. Price is now moving closer to the tip of the triangle, where the rising support line and descending resistance line are narrowing the trading range. This compression suggests that the market is preparing for a stronger directional breakout after the current consolidation phase. Given the bullish pennant formation and the recent respect of the ascending support line, a future breakout above the descending resistance line remains possible. However, confirmation is needed before the EURUSD H4 chart analysis shifts decisively toward bullish continuation.

Key Technical Indicators:

Bollinger Bands (95): The candles are positioned near the middle line of the Bollinger Bands, showing balanced short-term momentum. The narrowing bands suggest lower volatility and indicate that a breakout phase may be developing.

RSI (14): The RSI currently stands at 54.87, slightly above the neutral 50 level. This reflects mild bullish momentum, but not enough to confirm a strong breakout without further price confirmation.

MACD (12,26,9): The MACD values at 0.000672 and 0.000368 indicate that bullish momentum is currently present. The positive MACD structure supports the possibility of an upside breakout if price clears the descending resistance line.

Support and Resistance:

Support: The nearest support level is located around 1.15890, aligning with the rising support line that forms the lower boundary of the bullish pennant pattern.

Resistance: The closest resistance zone appears near 1.17300, matching the descending trendline that must be broken to confirm bullish continuation.

Conclusion and Consideration:

The current EURUSD H4 technical analysis and price action forecast suggests that the pair is consolidating inside a narrowing bullish pennant structure after a gradual bearish movement. Technical indicators such as the RSI and MACD support mild bullish momentum, while the narrowing Bollinger Bands indicate that volatility may expand soon. A confirmed breakout above the descending resistance line could strengthen the bullish scenario and support a continuation move in the EURUSD H4 forex outlook. Fundamentally, Eurozone PMI, retail sales, ECB monetary data, and US manufacturing or Fed-related developments may act as catalysts for the next major move. Traders should watch the pennant boundaries closely, as a breakout from either side may define the next short-term direction.

Disclaimer: The analysis provided for EUR/USD is for informational purposes only and does not constitute investment advice. Traders are encouraged to perform their own analysis and research before making any trading decisions on EURUSD. Market conditions can change quickly, so staying informed with the latest data is essential.

EURUSD-H4-Technical-and-Fundamental-Analysis-for-06.01.2026

Time Zone: GMT +3

Time Frame: 4 Hours (H4)

Fundamental Analysis:

The BTC/USD pair may face elevated volatility today as several USD-related events are scheduled, including speeches from multiple Federal Reserve officials and key US economic releases such as Goods Trade Balance, Wholesale Inventories, and Chicago PMI. For this Bitcoin vs US Dollar H4 technical and fundamental chart daily analysis, any hawkish Federal Reserve tone could support the US Dollar and pressure BTCUSD price action, while softer language may help Bitcoin stabilize. Traders should monitor FOMC commentary closely, as interest-rate expectations remain a major driver of crypto market sentiment and BTC/USD volatility.

Price Action:

BTCUSD on the H4 chart remains in a broader bearish structure despite the recovery rally from the February low, and price is now weakening near the lower boundary of the rising corrective channel. The BTC USD price action shows lower highs and bearish rejection from the mid-to-upper channel area, suggesting sellers are regaining control. Unless Bitcoin reclaims the 77.9k–78k zone, the H4 chart forecast favors continued downside pressure toward the next support areas.

Key Technical Indicators:

Parabolic SAR: The Parabolic SAR dots have flipped above price, confirming short-term bearish momentum on the BTCUSD H4 chart. This supports the view that sellers currently control the immediate trend. A reversal signal would require price to break back above the SAR structure.

RSI: The RSI(14) is near 28, showing strong bearish pressure and approaching oversold territory. This indicates weak buying momentum in the Bitcoin technical analysis outlook. However, oversold readings may also trigger a short-term corrective bounce if support holds.

Stochastic Oscillator: The Stochastic indicator is deep in the lower zone, reflecting exhausted downside momentum. The weak crossing behavior does not yet confirm a bullish reversal. BTCUSD traders should wait for a stronger upward crossover before assuming recovery momentum.

Support and Resistance:

Support: Immediate support is located around 73.1k, aligned with the 38.2% Fibonacci retracement and the lower channel zone. Stronger support is near 68.5k at the 23.6% Fibonacci level.

Resistance: Initial resistance is around 77.9k–78k, matching the 50.0% Fibonacci retracement. Major resistance stands near 82.6k, where the 61.8% Fibonacci level and previous rejection area converge.

Conclusion and Consideration:

The BTCUSD H4 technical analysis suggests bearish momentum is increasing as price pressures the lower side of the rising corrective channel. RSI and Stochastic show oversold conditions, so a short-term bounce is possible, but the overall Bitcoin price action remains vulnerable unless BTC/USD recovers above 77.9k–78k. Fundamental analysis for BTCUSD today should focus on Federal Reserve speeches and US data, as stronger USD sentiment may accelerate downside pressure toward 73.1k and 68.5k.

Disclaimer: The analysis provided for BTC/USD is for informational purposes only and does not constitute investment advice. Traders are encouraged to perform their own analysis and research before making any trading decisions on BTCUSD. Market conditions can change quickly, so staying informed with the latest data is essential.

BTCUSD-H4-Technical-and-Fundamental-Analysis-for-05.29.2026-

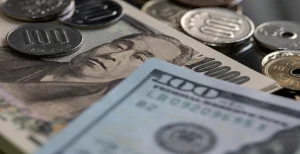
Time Zone: GMT +3

Time Frame: 4 Hours (H4)

Fundamental Analysis:

The USDJPY H4 technical and fundamental analysis reflects a market heavily influenced by central bank expectations and monetary policy outlooks. On the JPY side, traders are closely monitoring Bank of Japan Governor Kazuo Ueda’s upcoming speech at the BOJ Institute for Monetary and Economic Studies Conference in Tokyo. Any hawkish remarks regarding inflation, interest rates, or policy normalization could strengthen the Japanese Yen and increase volatility in the USDJPY H4 forex forecast. Meanwhile, the US Dollar may also experience volatility due to speeches from Federal Reserve officials including Dallas Fed President Lorie Logan and Fed Governor Lisa Cook, alongside the release of the Richmond Manufacturing Index and labor-related data from ADP. Overall, the current USDJPY daily analysis and H4 chart outlook suggest that monetary policy expectations and central bank rhetoric remain the primary drivers for short-term price action.

Price Action:

The USDJPY H4 price action analysis shows that the pair maintained a bullish structure for the majority of its recent history, steadily climbing along a rising support trendline. However, the bullish momentum faced significant resistance near the major levels of 159.899 and 159.449, preventing buyers from extending the rally further. Following a sharp bearish correction earlier in the month, the candles managed to recover and approach the resistance zone once again, but buying pressure now appears to be weakening as price stalls beneath resistance. This behavior suggests potential exhaustion among bulls, increasing the possibility of either another rejection from resistance or a period of sideways consolidation before the next directional move develops in the broader USDJPY H4 technical analysis.

Key Technical Indicators:

Parabolic SAR: The Parabolic SAR dots remain positioned below the candles, indicating that the broader bullish trend structure is still technically intact. However, the shortening distance between the dots and current price action may suggest slowing bullish momentum as the pair trades close to strong resistance levels.

RSI (14): The RSI currently stands at 65.19, reflecting relatively strong bullish momentum while approaching overbought territory. Although the indicator still supports bullish continuation in the short term, the inability to decisively break resistance may lead to bearish divergence or momentum exhaustion if buyers continue losing strength.

Stochastic (5,3,3): The Stochastic oscillator readings of 83.60 and 87.61 place the market deep within overbought territory. This condition often signals that bullish momentum is becoming overstretched, increasing the probability of a short-term pullback or corrective decline in the ongoing USDJPY H4 forex market analysis.

Support and Resistance:

Support: The nearest support level is located around 158.735, followed by the ascending trendline support near 156.275, which continues supporting the broader bullish structure.

Resistance: The primary resistance zone remains between 159.449 and 159.899, where repeated rejection candles have formed and bullish momentum has weakened significantly.

Conclusion and Consideration:

The current USDJPY H4 technical analysis and price action forecast continues showing an overall bullish structure supported by the ascending trendline and Parabolic SAR indicator. Nevertheless, repeated failures near the resistance zone at 159.449–159.899 indicate that buyers are struggling to maintain upward momentum. The overbought Stochastic readings and elevated RSI levels suggest that bullish exhaustion could trigger a corrective pullback unless a strong breakout above resistance occurs. Traders should also remain cautious of increased volatility caused by upcoming speeches from BOJ Governor Kazuo Ueda and multiple Federal Reserve officials, as central bank commentary could significantly influence the short-term direction of the USDJPY forex market.

Disclaimer: The analysis provided for USD/JPY is for informational purposes only and does not constitute investment advice. Traders are encouraged to perform their own analysis and research before making any trading decisions on USDJPY. Market conditions can change quickly, so staying informed with the latest data is essential.

USDJPY-H4-Technical-and-Fundamental-Analysis-for-05.27.2026

Time Zone: GMT +3

Time Frame: 4 Hours (H4)

Fundamental Analysis:

The EUR/USD currency pair reflects the exchange rate between the Euro and the US Dollar, and today’s EURUSD H4 daily technical and fundamental analysis is likely to be influenced mainly by USD-side economic data and geopolitical headlines. The US calendar includes the FHFA House Price Index, S&P/Case-Shiller House Price Index, and CB Consumer Confidence, all of which can affect the USD outlook because housing prices and consumer sentiment are key indicators of economic strength and future spending. A stronger-than-forecast reading may support the US Dollar and pressure EURUSD lower, while weaker data could help the Euro recover against the Dollar. In addition, Iran-related geopolitical updates and Hormuz headlines may affect broader market sentiment, risk appetite, energy prices, and safe-haven USD demand, making today’s EUR/USD H4 chart analysis sensitive to both macroeconomic news and headline-driven volatility.

Price Action:

The EURUSD pair analysis on the H4 timeframe shows price moving inside a tightening triangle pattern, formed between the descending red resistance trendline and the rising green support trendline. After the recent bearish drop from the May highs, EUR/USD found buyers near the green trendline and the 0.0 Fibonacci retracement area around 1.1580, creating a short-term rebound. However, the price is now hesitating near the 23.6% Fibonacci level and the 1.1630–1.1645 zone, where small-bodied candles and upper wicks indicate weak bullish conviction and possible rejection. The red horizontal resistance area around 1.1650–1.1680 remains a key supply zone, and the next major EURUSD H4 price action signal will likely come from a breakout above the red trendline or a rejection back toward the green support.

Key Technical Indicators:

Bollinger Bands: The EURUSD H4 Bollinger Bands are narrowing, signaling low volatility and a possible breakout ahead. Price is near the middle band, showing consolidation between the triangle support and resistance.

MACD (Moving Average Convergence Divergence): The MACD is recovering from bearish territory, with momentum gradually improving. However, it remains close to neutral, so a stronger bullish crossover is needed to confirm upside continuation.

RSI (Relative Strength Index): The RSI is near 50, indicating neutral momentum in the EUR/USD H4 price action analysis. A move above 55 would support buyers, while a drop below 45 could favor sellers.

Support and Resistance:

Support: Immediate support is located around 1.1600–1.1580, aligning with the rising green trendline, the lower Bollinger Band area, and the recent swing low.

Resistance: Key resistance is positioned around 1.1650–1.1680, where the red horizontal zone, descending red trendline, and Fibonacci retracement levels create a strong technical barrier.

Conclusion and Consideration:

The EUR-USD H4 technical and fundamental chart daily analysis suggests that the pair is consolidating inside a tightening triangle after a recent bearish move, with price trapped between rising support and descending resistance. The Bollinger Bands indicate low volatility before a potential breakout, the MACD is showing early recovery, and the RSI remains neutral near 50, confirming that the market is waiting for a stronger catalyst. A confirmed breakout above the red descending trendline and the 1.1650–1.1680 resistance zone could support a bullish EUR/USD H4 forecast toward the 38.2%, 50.0%, and 61.8% Fibonacci levels. On the other hand, rejection from resistance combined with stronger USD news could push EURUSD back toward 1.1600–1.1580, where the next bearish or bullish reaction should be closely monitored.

Disclaimer: The analysis provided for EUR/USD is for informational purposes only and does not constitute investment advice. Traders are encouraged to perform their own analysis and research before making any trading decisions on EURUSD. Market conditions can change quickly, so staying informed with the latest data is essential.

EURUSD-H4-Technical-and-Fundamental-Analysis-for-05.26.2026

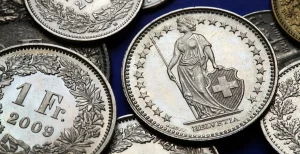
Time Zone: GMT +3

Time Frame: 4 Hours (H4)

Fundamental Analysis:

The USDCHF H4 technical and fundamental analysis is expected to experience irregular volatility today as both US and Swiss banks remain closed due to Memorial Day in the United States and Whit Monday in Switzerland. Reduced institutional participation and lower liquidity conditions may lead to unpredictable price swings and sharper short-term volatility in the forex market. Since banks facilitate a significant portion of foreign exchange transactions, reduced market depth could amplify speculative movements in the USDCHF H4 price action. Although no major economic releases are scheduled, traders should remain cautious as thin liquidity environments often create false breakouts and sudden reversals. Overall, the current USDCHF daily analysis and forex forecast suggests that technical levels may play a more dominant role than fundamentals during today’s trading session.

Price Action:

The USDCHF H4 price action analysis shows that the pair has been declining sharply during bearish waves while bullish corrections have developed at a much slower pace, creating a broader mild bearish structure. Recently, the candles completed another gradual corrective recovery before beginning to turn lower once again, signaling renewed bearish pressure in the market. Based on the Fibonacci Expansion structure visible on the chart, the candles may now attempt to revisit the 61.8 Fibonacci level near 0.77520, where previous reactions and temporary stabilization occurred. If the market reaches this support zone again, traders may expect another consolidation or corrective rebound phase to develop. The overall USDCHF H4 chart analysis therefore continues favoring bearish continuation unless stronger bullish momentum unexpectedly returns.

Key Technical Indicators:

Parabolic SAR: The Parabolic SAR dots are currently positioned above the candles, confirming that bearish momentum remains dominant in the short-term trend structure. This indicator continues supporting the possibility of additional downside movement toward lower support areas.

MACD (12,26,9): The MACD currently stands at -0.000463 and 0.000334, reflecting weakening bullish momentum and the gradual return of bearish pressure. The histogram also shows fading upward momentum, suggesting that sellers are slowly regaining control of the market.

Stochastic (5,3,3): The Stochastic oscillator readings at 11.38 and 11.78 indicate that the market is approaching oversold territory. While this could eventually support a short-term corrective bounce, the current momentum still favors bearish continuation in the ongoing USDCHF H4 technical analysis.

Support and Resistance:

Support: The nearest support level is located around 0.77520, corresponding with the Fibonacci Expansion 61.8 level where the market recently reacted.

Resistance: The immediate resistance zone appears near 0.78182, followed by a stronger resistance area around 0.79070, where previous bearish reversals intensified.

Conclusion and Consideration:

The current USDCHF H4 technical analysis and price action forecast reflects a market that continues maintaining a mild bearish structure despite intermittent bullish corrections. Technical indicators including the Parabolic SAR, MACD, and Stochastic oscillator continue supporting downside pressure, with the pair potentially targeting the Fibonacci 61.8 support level in the near term. However, since both US and Swiss banks are closed today, traders should remain cautious of irregular volatility and reduced liquidity conditions that may create unstable market behavior. As long as the pair remains below major resistance zones, bearish continuation scenarios may continue dominating the broader USDCHF forex market outlook.

Disclaimer: The analysis provided for USD/CHF is for informational purposes only and does not constitute investment advice. Traders are encouraged to perform their own analysis and research before making any trading decisions on USDCHF. Market conditions can change quickly, so staying informed with the latest data is essential.

USDCHF-H4-Technical-and-Fundamental-Analysis-for-05.25.2026

Time Zone: GMT +3

Time Frame: 4 Hours (H4)

Fundamental Analysis:

The EUR/GBP currency pair reflects the exchange rate between the Euro and the British Pound, and today’s EURGBP H4 technical and fundamental chart daily analysis remains sensitive to both Eurozone sentiment data and UK consumer-related releases. For the EUR, traders are watching German GDP, German consumer sentiment, German ifo business climate, ECOFIN/Eurogroup commentary, and Belgium business confidence, as these events can influence expectations around Eurozone growth and ECB policy direction. For the GBP, market attention is focused on UK consumer confidence, retail sales, and public sector borrowing, which can affect Bank of England rate expectations and broader Sterling sentiment. If Eurozone data comes in stronger than expected while UK data disappoints, EUR-GBP may find support; however, stronger UK retail sales or better fiscal/consumer figures could strengthen the Pound and add downside pressure to the EUR GBP H4 price action forecast.

Price Action:

The EUR-GBP pair analysis in the H4 timeframe shows price compressing inside a symmetrical triangle/wedge pattern, with descending resistance marked by the red trendline and ascending support marked by the green trendline. The EUR/GBP price is currently trading near 0.8648, close to the rising trendline support area and below the 23.6% Fibonacci zone, suggesting that sellers remain active after the recent rejection from the upper Fibonacci resistance region. The latest candles show bearish momentum following the failed move near the upper side of the structure, while the market is now testing a critical breakout-or-rebound zone. A clean break below the ascending support could confirm a bearish continuation setup, while a strong bullish rejection from this level could trigger a recovery toward the 0.8683–0.8695 resistance area.

Key Technical Indicators:

Moving Averages (9,21): The MA9 line has crossed below the MA21 line, confirming short-term bearish momentum. As long as price stays below both moving averages, the EUR/GBP H4 technical bias remains cautious and bearish.

MACD (12,26,9): The MACD remains below the signal line with negative histogram bars, supporting the current downside momentum. A bullish crossover would be needed to confirm weakening selling pressure and a possible rebound.

RSI (14): The RSI(14) is around 36, showing bearish momentum but not yet oversold conditions. A move below 30 would confirm stronger downside pressure, while a rebound from this zone may support a short-term correction.

Support and Resistance:

Support: Immediate support is located near 0.8648, where the current price is testing the ascending green trendline; deeper downside support sits around 0.8633, near the 0.0% Fibonacci level and the recent swing-low zone.

Resistance: Immediate resistance is seen around 0.8683 at the 50% Fibonacci level, followed by 0.8695 at the 61.8% level and the upper triangle resistance zone near 0.8710–0.8733.

Conclusion and Consideration:

The EURGBP H4 chart forecast shows a tightening symmetrical triangle formation, suggesting that a breakout may be approaching. The current technical setup favors a cautious bearish bias because price is pressing against the rising support trendline, the MA9 has crossed below the MA21, MACD remains negative, and RSI is below the neutral 50 level. For today’s EUR GBP technical and fundamental daily analysis, traders should watch whether the pair holds above 0.8648–0.8633 support or breaks lower with confirmation. Fundamental volatility may increase around Eurozone business sentiment, German GDP-related data, UK retail sales, UK consumer confidence, and UK borrowing figures, so confirmation from price action is essential before entering any EURGBP trade setup.

Disclaimer: The analysis provided for EUR/GBP is for informational purposes only and does not constitute investment advice. Traders are encouraged to perform their own analysis and research before making any trading decisions on EURGBP. Market conditions can change quickly, so staying informed with the latest data is essential.

FXGLORY_WATERMARK_EURGBP H4 Technical and Fundamental Analysis for 05.22.2026

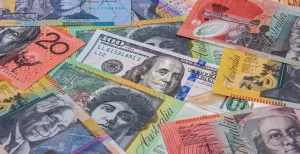
Time Zone: GMT +3

Time Frame: 4 Hours (H4)

Fundamental Analysis:

The AUDUSD H4 technical and fundamental analysis is expected to remain highly sensitive to upcoming PMI, employment, and inflation expectation releases from Australia, alongside key US economic indicators and Federal Reserve commentary. On the Australian side, traders are closely monitoring Manufacturing PMI, Services PMI, Consumer Inflation Expectations, Employment Change, and the Unemployment Rate, all of which are critical indicators for evaluating the strength of the Australian economy and future Reserve Bank of Australia monetary policy decisions. Stronger Australian economic data could provide temporary support for the AUD; however, slowing employment or weaker PMI readings may intensify bearish pressure on the pair. On the USD side, attention remains focused on the Philadelphia Fed Manufacturing Index, Jobless Claims, Building Permits, Housing Starts, PMI releases, and speeches from Federal Reserve officials. Overall, the current AUDUSD daily analysis and forex forecast suggests that stronger US economic sentiment combined with weakening Australian momentum could continue favoring the US Dollar in the medium term.

Price Action:

The AUDUSD H4 price action analysis shows that despite the pair maintaining a strong bullish structure for a prolonged period, the candles have recently entered a corrective bearish phase. After sharply declining toward the ascending support trendline, the market managed to bounce upward temporarily as buyers defended the support area. However, the recent recovery appears relatively weak, and the candles are once again beginning to gravitate lower toward the support line. In addition, the formation of a hidden bearish divergence on the chart suggests that bearish continuation pressure remains active beneath the surface. Based on the current AUDUSD H4 chart analysis, a stronger downside move and a possible breakdown below the support trendline may become increasingly probable if selling momentum accelerates further.

Key Technical Indicators:

Moving Average (10): The 10-period Moving Average is currently positioned below the candles and continues moving upward, reflecting that the broader bullish structure has not yet been fully invalidated. However, the narrowing distance between the candles and the moving average suggests weakening bullish momentum and increasing downside pressure.

MACD (12,26,9): The MACD currently reads -0.001451 and -0.002411, indicating that bearish momentum remains dominant despite the recent upward correction. Although the histogram shows signs of slight recovery, the MACD line remaining below the signal line continues supporting the bearish outlook in the current AUDUSD H4 technical analysis.

RSI (14): The RSI is currently at 51.86, positioning the market near neutral territory. This suggests that while the market still retains some bullish strength, momentum has weakened considerably compared to the previous uptrend, allowing room for additional bearish pressure if sellers regain control.

Support and Resistance:

Support: The nearest support level is located around 0.70870, aligning with the ascending bullish support trendline that has repeatedly supported price rebounds.

Resistance: The immediate resistance zone appears near 0.71557, followed by the stronger resistance area around 0.72040, where previous bearish reactions intensified.

Conclusion and Consideration:

The current AUDUSD H4 technical analysis and price action forecast reflects weakening bullish momentum after a prolonged upward trend, with the market increasingly vulnerable to a bearish continuation move. While the ascending support trendline continues holding for now, the hidden bearish divergence combined with weakening MACD momentum suggests that a breakdown below support could become more likely in upcoming sessions. Technical indicators such as the RSI and Moving Average continue reflecting a market in transition between bullish recovery and renewed bearish pressure. Fundamentally, upcoming Australian employment and PMI releases alongside major US economic data and Federal Reserve speeches may significantly increase volatility and determine the pair’s next directional move.

Disclaimer: The analysis provided for AUD/USD is for informational purposes only and does not constitute investment advice. Traders are encouraged to perform their own analysis and research before making any trading decisions on AUDUSD. Market conditions can change quickly, so staying informed with the latest data is essential.

AUDUSD-H4-Technical-and-Fundamental-Analysis-for-05.21.2026

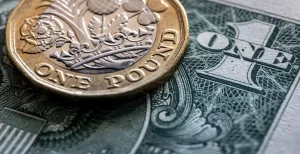
Time Zone: GMT +3

Time Frame: 4 Hours (H4)

Fundamental Analysis:

The GBPUSD H4 technical and fundamental analysis remains highly sensitive to upcoming inflation-related releases from the United Kingdom alongside speeches from Federal Reserve officials in the United States. Traders are closely monitoring UK CPI, Core CPI, PPI, RPI, and House Price Index data, as stronger inflation readings could reinforce expectations of tighter Bank of England monetary policy and support the British Pound. At the same time, upcoming remarks from Federal Reserve officials including Anna Paulson and Michael Barr may significantly influence USD volatility, especially if hawkish comments regarding future interest rates emerge. In addition, FOMC meeting minutes and US crude oil inventory data may further impact overall USD sentiment. Overall, the current GBPUSD H4 daily analysis and forex forecast suggests that both currencies may experience elevated volatility due to important macroeconomic releases and central bank commentary.

Price Action:

The GBPUSD H4 price action analysis shows that the pair has generally been moving upward along a long-term bullish trendline, forming a constructive higher-low structure over time. However, in the most recent sessions, the candles have been gravitating sharply downward toward the ascending support line, reflecting increasing bearish pressure in the short term. After touching the important support area near 1.33005, the pair managed to rebound temporarily, but sellers have once again pushed prices lower. Based on the previous behavior of the chart and the repeated attraction toward the bullish trendline, the market may continue drifting downward toward the support structure before a clearer directional breakout emerges. This keeps the current GBPUSD H4 chart analysis in a cautious corrective phase despite the broader bullish structure.

Key Technical Indicators:

Parabolic SAR: The Parabolic SAR dots are currently positioned below the candles, signaling that the broader bullish structure still remains technically valid. However, the narrowing distance between the dots and price action suggests weakening bullish momentum and the possibility of increased short-term consolidation.

Stochastic (5,3,3): The Stochastic oscillator currently reads 38.72 and 35.23, indicating that bearish momentum remains present but is not yet in oversold territory. The indicator suggests that sellers still have room to pressure the market lower before a stronger bullish recovery develops.

RSI (14): The RSI currently stands at 44.30, reflecting weakening bullish momentum and a market leaning slightly toward bearish conditions. Since the RSI remains below the neutral 50 level, sellers continue to maintain a short-term advantage in the current GBPUSD H4 technical analysis.

Support and Resistance:

Support: The nearest support level is located around 1.33005, which aligns with the recent rebound area and the ascending long-term support trendline.

Resistance: The closest resistance zone is seen near 1.34880, followed by the stronger resistance area around 1.35495, where previous bearish pressure intensified.

Conclusion and Consideration:

The current GBPUSD H4 technical analysis and price action forecast reflects a market that remains bullish in the broader trend but is facing increasing short-term corrective pressure. Technical indicators such as the RSI and Stochastic oscillator show weakening momentum, while the Parabolic SAR still supports the larger bullish structure. Price behavior suggests that the pair may continue gravitating toward the ascending support trendline before establishing a stronger directional move. Fundamentally, upcoming UK inflation releases and speeches from Federal Reserve officials may significantly increase market volatility and determine whether GBPUSD resumes its broader bullish trend or experiences a deeper correction.

Disclaimer:The analysis provided for GBP/USD is for informational purposes only and does not constitute investment advice. Traders are encouraged to perform their own analysis and research before making any trading decisions on GBPUSD. Market conditions can change quickly, so staying informed with the latest data is essential.

GBPUSD-H4-Technical-and-Fundamental-Analysis-for-05.20.2026

Time Zone: GMT +3

Time Frame: 4 Hours (H4)

Fundamental Analysis:

The GOLD/USD pair, also known as XAUUSD, remains highly sensitive to today’s USD fundamental news, especially Federal Reserve Governor Christopher Waller’s panel discussion, as traders will monitor any hawkish or dovish comments for clues about future US interest rate policy. A more hawkish Fed tone, stronger ADP private-sector employment data, or better Pending Home Sales figures could support the US Dollar and pressure spot gold prices, while weaker labor or housing data may improve demand for gold as a safe-haven and non-yielding asset. API inventory data may also influence broader inflation expectations and market sentiment, indirectly affecting gold price volatility. Overall, today’s XAUUSD H4 fundamental analysis suggests that gold traders should watch USD strength, Treasury yield expectations, and Fed monetary policy signals closely.

Price Action:

The GOLD H4 chart analysis shows that spot gold is trading in a bearish corrective structure after forming lower highs from the April peak. Price recently rejected the 50% Fibonacci retracement and mid-Bollinger Band area near 4729, then dropped toward the 23.6% Fibonacci support zone around 4510, with the current price near 4559 attempting to stabilize above that level. The latest XAUUSD price action shows sellers still controlling short-term momentum, but the reaction near 4510 indicates a possible temporary rebound zone. As long as gold remains below the 4620–4730 resistance area, the H4 gold price forecast stays cautiously bearish.

Key Technical Indicators:

Bollinger Bands: The Bollinger Bands on the GOLD H4 chart show price trading on the lower side of the band structure, confirming that sellers remain dominant in the short-term trend. The recent lower-band touch suggests that the bearish move may be stretched, which can create conditions for a corrective rebound. However, as long as price remains below the middle Bollinger Band near the 4620–4730 zone, the XAUUSD technical analysis remains bearish. A sustained recovery above the mid-band would be needed to weaken the current downside pressure.

MACD(12,26,9): The MACD remains below the zero line, confirming that bearish momentum is still present on the GOLD/USD H4 timeframe. The MACD line and signal line are still positioned negatively, which supports the current bearish corrective structure. However, the histogram appears slightly less aggressive, suggesting that downside momentum may be slowing. Traders should watch for either a fresh bearish expansion or a bullish MACD crossover as a signal for the next XAU-USD price action move.

RSI(14): The RSI is near 38.7, showing weak momentum but not yet deeply oversold. This means the market still has room to move lower if sellers break the 4510 support level with conviction. At the same time, the RSI’s position near the lower neutral zone suggests that a short-term technical rebound is possible if buyers defend the current support area. For this GOLD H4 daily chart analysis, RSI supports a bearish bias below 4620–4730.

Support and Resistance:

Support: Immediate support is located near 4510, aligned with the 23.6% Fibonacci retracement and the recent lower Bollinger Band reaction area. A break below this level could expose 4400 and then 4290 as deeper bearish targets.

Resistance: The nearest resistance zone is around 4620, followed by the stronger 4729 area, where the 50% Fibonacci retracement and mid-Bollinger Band previously rejected price. A confirmed move above 4730 would reduce the bearish pressure and improve the short-term gold recovery outlook.

Conclusion and Consideration:

The GOLD H4 technical and fundamental analysis shows that XAUUSD remains in a bearish corrective phase, with lower highs, weak RSI, negative MACD, and price action below the mid-Bollinger Band. The key level to watch is 4510; holding above it may trigger a corrective rebound toward 4620–4730, while a confirmed breakdown could extend the gold price forecast toward 4400 and 4290. Today’s USD news, especially Fed Governor Waller’s comments, ADP employment data, and Pending Home Sales, may increase volatility in the spot gold vs US Dollar market. Traders should combine gold price action analysis, support and resistance levels, and USD fundamental drivers before making any trading decision.

Disclaimer: The analysis provided for GOLD/USD is for informational purposes only and does not constitute investment advice. Traders are encouraged to perform their own analysis and research before making any trading decisions on GOLDUSD. Market conditions can change quickly, so staying informed with the latest data is essential.

GOLD-H4_Technical-and-Fundamental-Analysis-for-05.19.2026