Current weekly forecast: This outlook covers 11–17 October 2026 and remains valid until 17 October 2026, unless its stated invalidation condition is triggered earlier.
In brief
USD/PLN has a bullish weekly bias, supported by D1 trend and momentum, although mixed closes and softer H4 MACD argue for conditional continuation.
The weekly structure favors the upside because the D1 trend is bullish, momentum is positive, and both the EMA50 and SMA200 slopes are rising. The reference close at 3.90019 is above the primary support at 3.86545 and the primary resistance at 3.92157 remains the next structural test.
The setup is not one-directional: the D1 close sequence is mixed, while H4 remains tactically bullish but has a MACD histogram of -0.000142 and a last close of 3.92022 below its upper Bollinger value of 3.92559. This combination supports a conditional bullish view rather than a certain continuation.
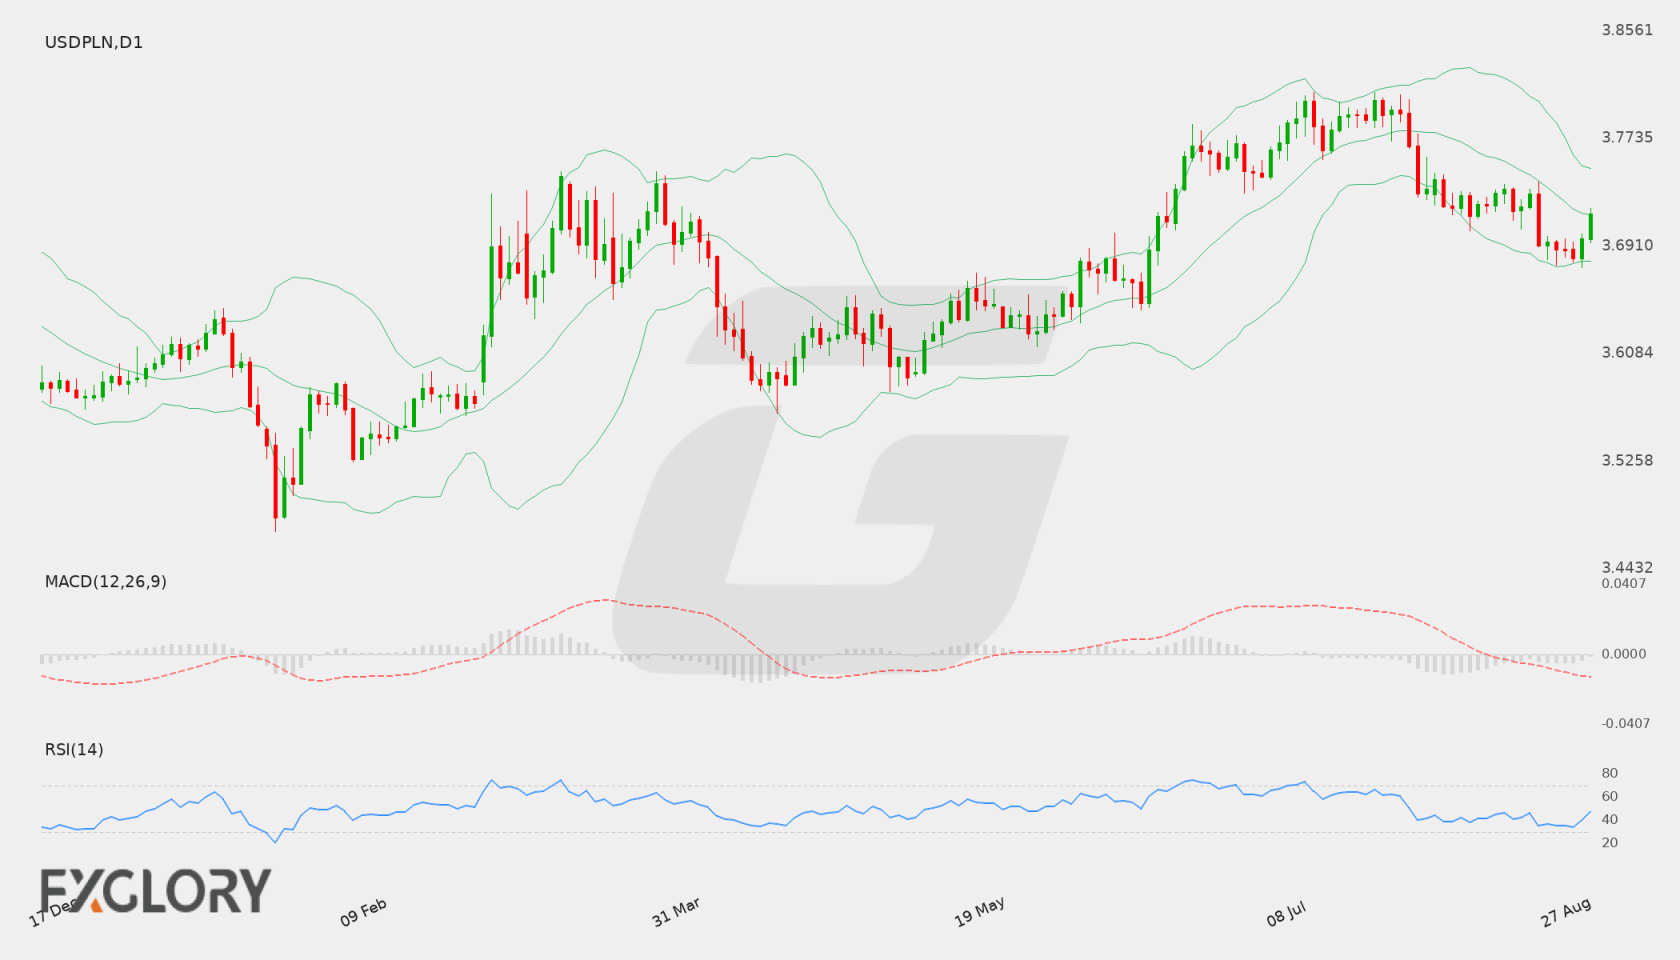
USD/PLN D1 technical-analysis context for the weekly forecast. Chart data captured 11 October 2026.
The USD/PLN currency pair is positioned to respond to upcoming United States macroeconomic data and Federal Reserve policy insights. Key releases including the ISM Services PMI, Unemployment Claims, consumer sentiment readings, and the FOMC Meeting Minutes will be assessed for indications regarding economic strength and interest rate trajectories, which may drive price adjustments in the US Dollar against the Polish Zloty.
Price Action:
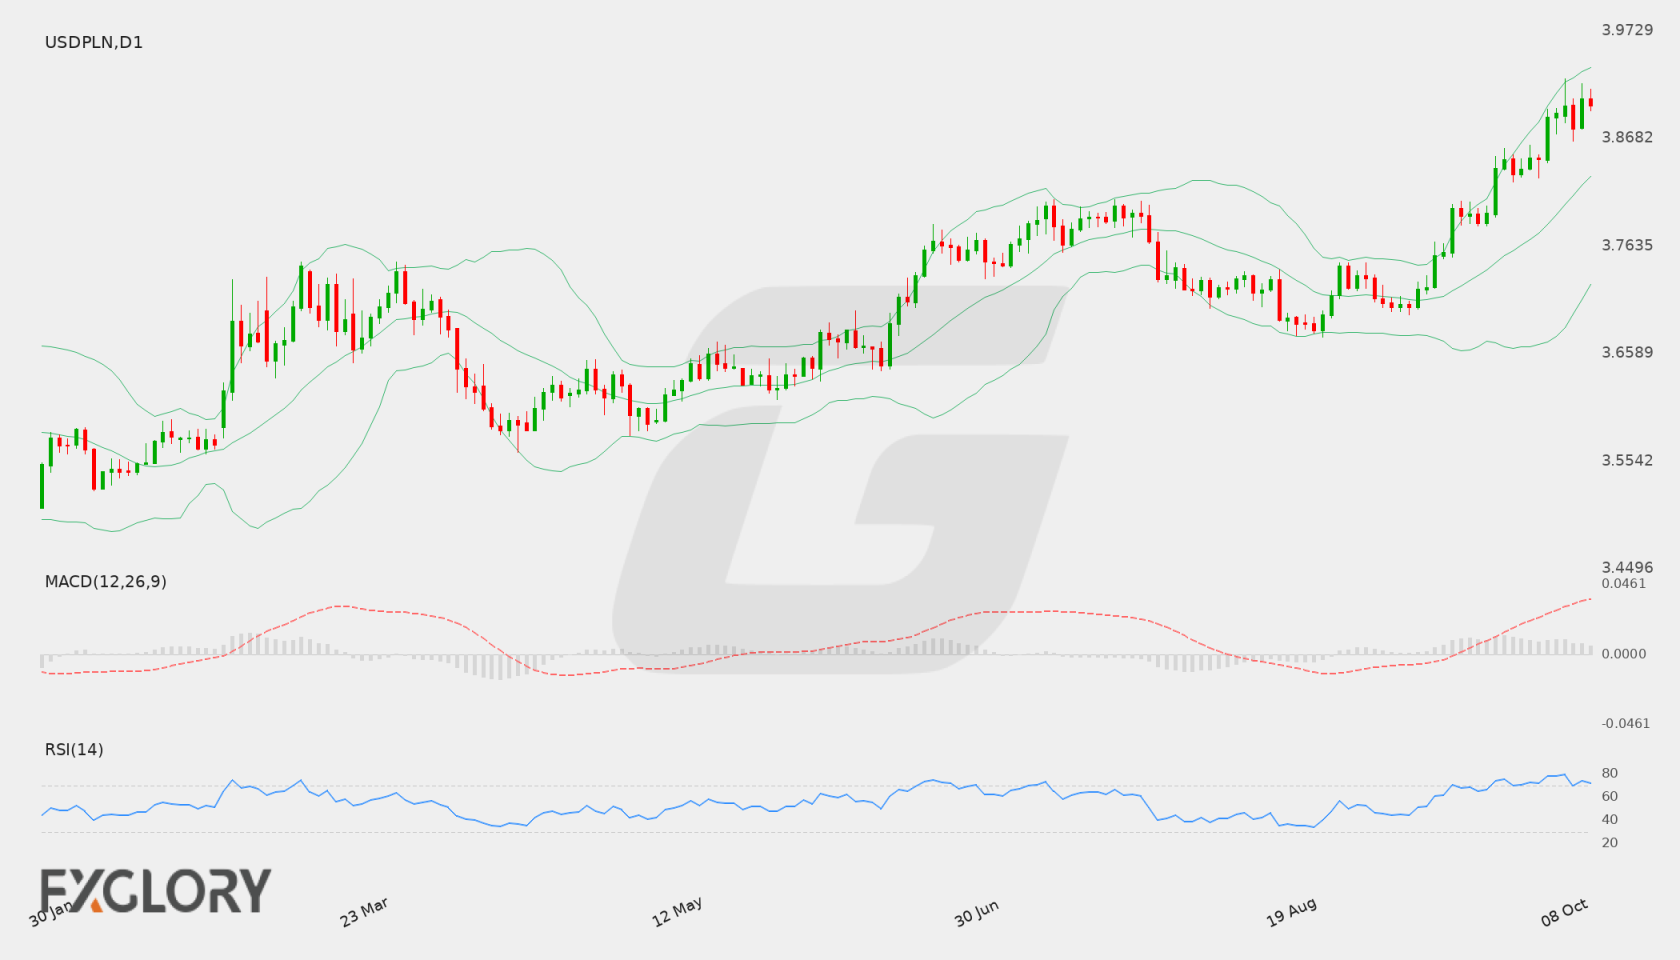
On the daily chart, USD/PLN experienced a strong upward move, advancing from recent closes near 3.79461 and 3.83913 to reach a latest close of 3.88869. The pair posted an intraday peak of 3.89693 in the most recent session, showing consistent bullish daily closes while approaching significant overhead chart levels.
Key Technical Indicators:
Bollinger Bands: USD/PLN trades well above the middle Bollinger Band at 3.78460 and is pressing against the upper Bollinger Band located at 3.89959. The lower band rests at 3.66961, illustrating expanding band width as volatility expands alongside the sharp price advance.
RSI: The 14-day Relative Strength Index (RSI) registers at 77.68. This places the oscillator firmly in overbought territory above the standard 70 threshold, signaling extended bullish momentum and the possibility of consolidation or pullbacks.
MACD: The daily MACD line stands in positive territory at 0.03577. This reading confirms established upside momentum following the series of higher closes, though traders continue to track whether this positive momentum remains sustainable as price approaches higher levels.
Support and Resistance:
Immediate resistance for USD/PLN is situated at 3.89693, closely aligned with the upper Bollinger Band near 3.89959. On the downside, key daily support is identified at 3.67452, with the middle Bollinger Band at 3.78460 acting as an intermediate reference level.
News to Watch for USDPLN This Week:
ISM Services PMI: Assesses activity within the services sector and may influence broader US Dollar performance.
FOMC Meeting Minutes: Provides insight into central bank discussions regarding interest rate policy and economic conditions.
Unemployment Claims: Measures initial jobless claims to evaluate the health and resilience of the US labor market.
Prelim UoM Inflation Expectations: Shows consumer views on prospective price pressures which can sway interest rate outlooks.
Prelim UoM Consumer Sentiment: Reflects overall consumer confidence and willingness to spend in the US economy.
Weekly Outlook and Consideration:
USD/PLN enters the upcoming trading sessions displaying strong bullish daily price action, having closed at 3.88869. However, with the RSI at 77.68 indicating overbought conditions and price testing the upper band near 3.89959 and resistance at 3.89693, market participants may monitor for either a breakout higher or a potential consolidation phase toward the middle band at 3.78460. High-impact US data releases will remain essential drivers for subsequent directional moves.
Disclaimer: The analysis provided for USD/PLN is for informational purposes only and does not constitute investment advice. Traders are encouraged to perform their own analysis and research before making any trading decisions. Market conditions can change quickly, so staying informed with the latest data is essential.
The USD/PLN exchange rate continues to be guided by broader global risk appetite and economic conditions in the United States. Key upcoming releases covering US employment, consumer sentiment, manufacturing activity, and inflation metrics will play a decisive role in driving USD strength. Market participants will closely analyze these indicators alongside central bank stances to gauge momentum for USDPLN.
Price Action:
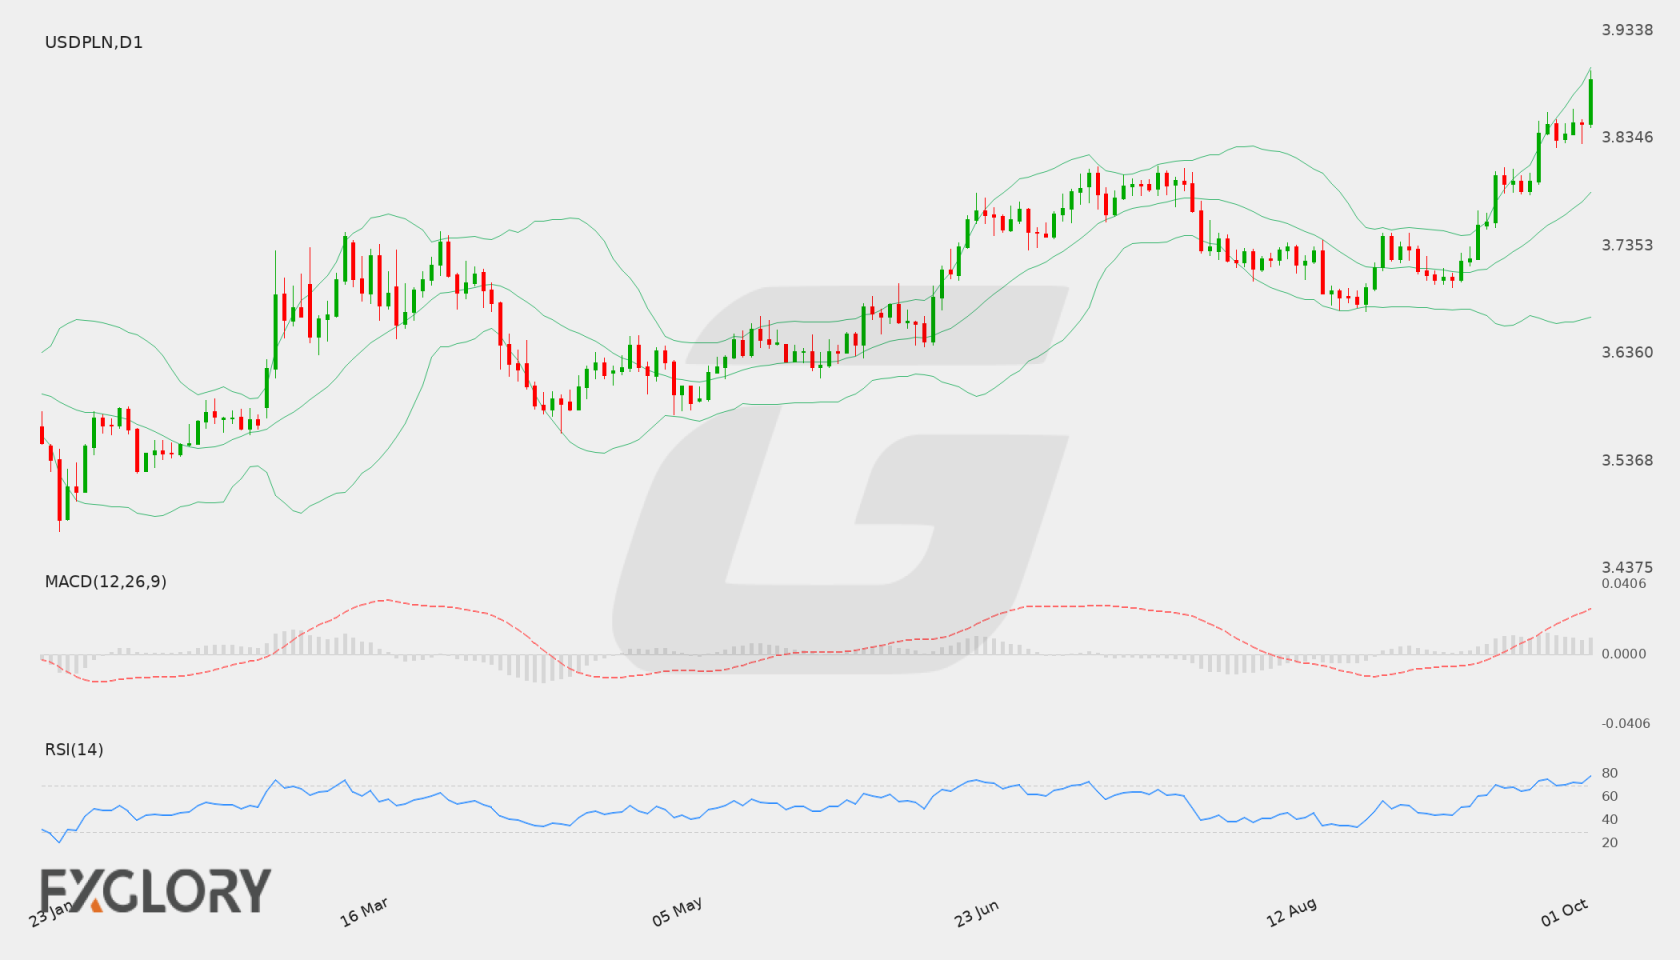
On the Daily (D1) chart, USD/PLN has demonstrated a distinct upward trend, rising from recent consolidated levels near 3.70 to close at 3.7928. The pair is now approaching an established resistance level at 3.80866, reflecting consistent buying pressure over recent trading sessions.
Key Technical Indicators:
Bollinger Bands: The Bollinger Bands on the D1 chart highlight expanding volatility for USD/PLN, with the middle band situated at 3.72436 and the lower band at 3.66145. The recent close at 3.7928 places price slightly above the upper Bollinger Band of 3.78727, signaling strong bullish momentum while suggesting the potential for near-term consolidation.
RSI: The 14-day Relative Strength Index (RSI) currently sits at 67.64 for USD/PLN. While remaining below the traditional overbought threshold of 70, the elevated reading demonstrates firm buying interest that could precede either a continuation or temporary exhaustion.
MACD: The MACD indicator for USDPLN displays a positive value of 0.01168 on the daily time frame. This positive posture indicates that bullish momentum remains intact, supporting the ongoing upward movement.
Support and Resistance:
Technical analysis on the daily chart identifies key price levels for USD/PLN. Immediate overhead resistance is located at 3.80866, while major technical support is established at 3.67452.
News to Watch for USDPLN This Week:
CB Consumer Confidence: Measures consumer optimism regarding economic conditions which can influence USD valuation.
JOLTS Job Openings: Indicates the overall health and hiring demand within the US labor market.
ADP Non-Farm Employment Change: Offers an early insight into private sector job growth ahead of official employment reports.
Core PCE Price Index m/m: Serves as a primary measure of underlying inflation trends affecting monetary policy.
Final GDP q/q: Provides a finalized evaluation of quarterly US economic growth.
ISM Manufacturing PMI: Reflects operational activity and growth trends within the manufacturing sector.
Average Hourly Earnings m/m: Tracks labor cost changes that directly contribute to inflationary pressure.
Non-Farm Employment Change: Highlights overall net employment additions across the economy.
Unemployment Rate: Evaluates the proportion of the active workforce currently seeking employment.
Weekly Outlook and Consideration:
USD/PLN maintains a bullish bias on the daily timeframe as price tests upper boundary regions following a move to 3.7928. With the MACD remaining positive at 0.01168 and the RSI holding at 67.64, buyers retain control. However, with the price trading near the upper Bollinger Band of 3.78727 and approaching resistance at 3.80866, traders should watch for potential rejection or consolidation. A breach above resistance could clear the way for further gains, whereas a pullback might see the pair head back toward support at 3.67452.
Disclaimer: The analysis provided for USD/PLN is for informational purposes only and does not constitute investment advice. Traders are encouraged to perform their own analysis and research before making any trading decisions. Market conditions can change quickly, so staying informed with the latest data is essential.
USD/PLN price dynamics are heavily influenced by shifting macroeconomic conditions in the United States and overall global risk sentiment affecting emerging market currencies such as the Polish Zloty. Imminent US economic releases may adjust interest rate expectations, swaying capital flows and setting the directional momentum for the pair over the coming sessions.
Price Action:
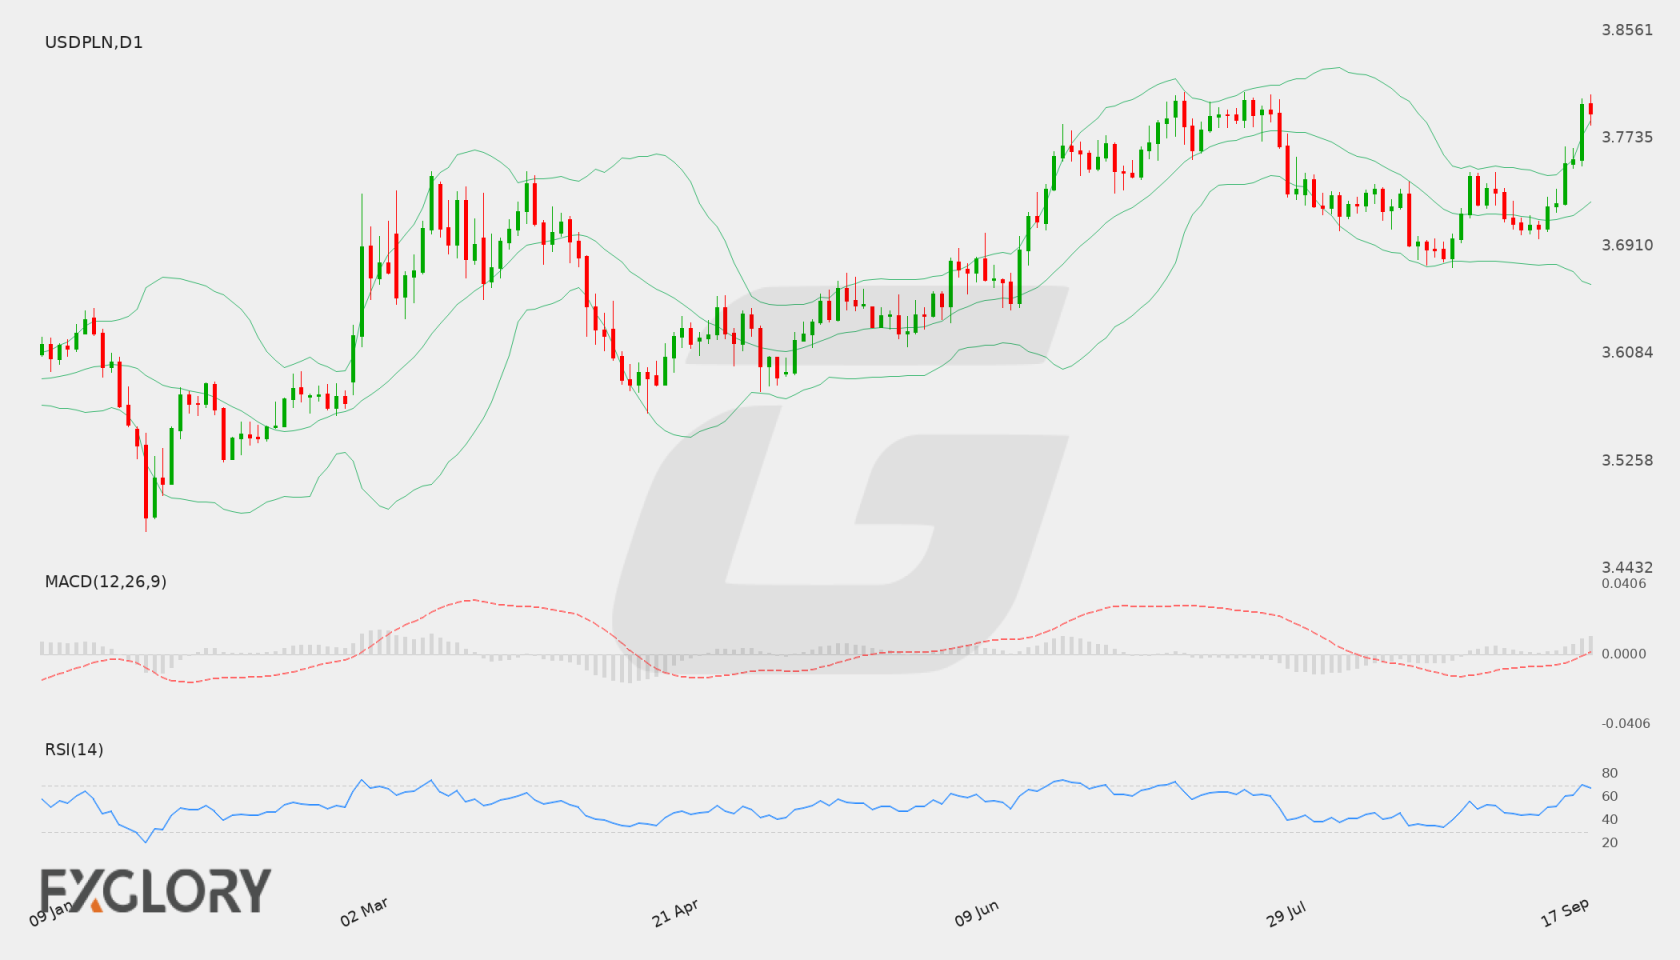
On the Daily (D1) chart, USD/PLN settled at a last close of 3.71239 after pulling back from recent highs above 3.743. Price action remains positioned in the middle of its recent range, reflecting a period of consolidation as market participants digest technical indicators and await fundamental catalysts.
Key Technical Indicators:
Bollinger Bands: The D1 Bollinger Bands show a middle band (20-day SMA) at 3.71481, flanked by an upper band at 3.75107 and a lower band at 3.67855. With the pair closing at 3.71239 near the middle line, price volatility appears stable without an immediate breakout signals in either direction.
RSI: The 14-day Relative Strength Index (RSI) is currently calculated at 46.51. Resting slightly below the 50 neutral mark, the index points to a mild bearish-to-neutral tone, indicating that the market is neither oversold nor overbought.
MACD: The D1 MACD indicator currently stands at -0.00498, remaining below zero. This reading reflects a subtle bearish momentum bias in the medium term, although the proximity to the signal line indicates a lack of aggressive downward momentum.
Support and Resistance:
Key technical levels on the daily chart frame the current consolidation zone, featuring major resistance at 3.80866 and key support at 3.64195. A sustained move beyond these boundaries could signal the start of a broader trend extension.
News to Watch for USDPLN This Week:
PPI m/m: Measures wholesale inflation shifts that influence US interest rate outlooks.
Core PPI m/m: Tracks baseline producer price changes excluding volatile items to assess underlying trends.
Unemployment Claims: Offers ongoing insight into US labor market stability and employment strength.
Core CPI m/m: Signals monthly underlying consumer price pressures affecting US Dollar valuation.
CPI y/y: Indicates yearly consumer price inflation trends that shape central bank policy.
USD/PLN enters the trading week with balanced technical readings on the Daily timeframe, consolidating around the middle Bollinger Band of 3.71481 and displaying a neutral RSI of 46.51. Should buying pressure elevate price action above the upper Bollinger Band near 3.75107, an attempt toward resistance at 3.80866 could develop. Conversely, extended downside movement beneath 3.67855 may lead to a test of primary support at 3.64195.
Disclaimer: The analysis provided for USD/PLN is for informational purposes only and does not constitute investment advice. Traders are encouraged to perform their own analysis and research before making any trading decisions. Market conditions can change quickly, so staying informed with the latest data is essential.
USD/PLN dynamics remain closely tied to broad US dollar trends and shifting expectations around US economic data. Upcoming labor market and activity indicators from the United States will be central in determining whether the pair can sustain its recent rebound against the Polish zloty.
Price Action:
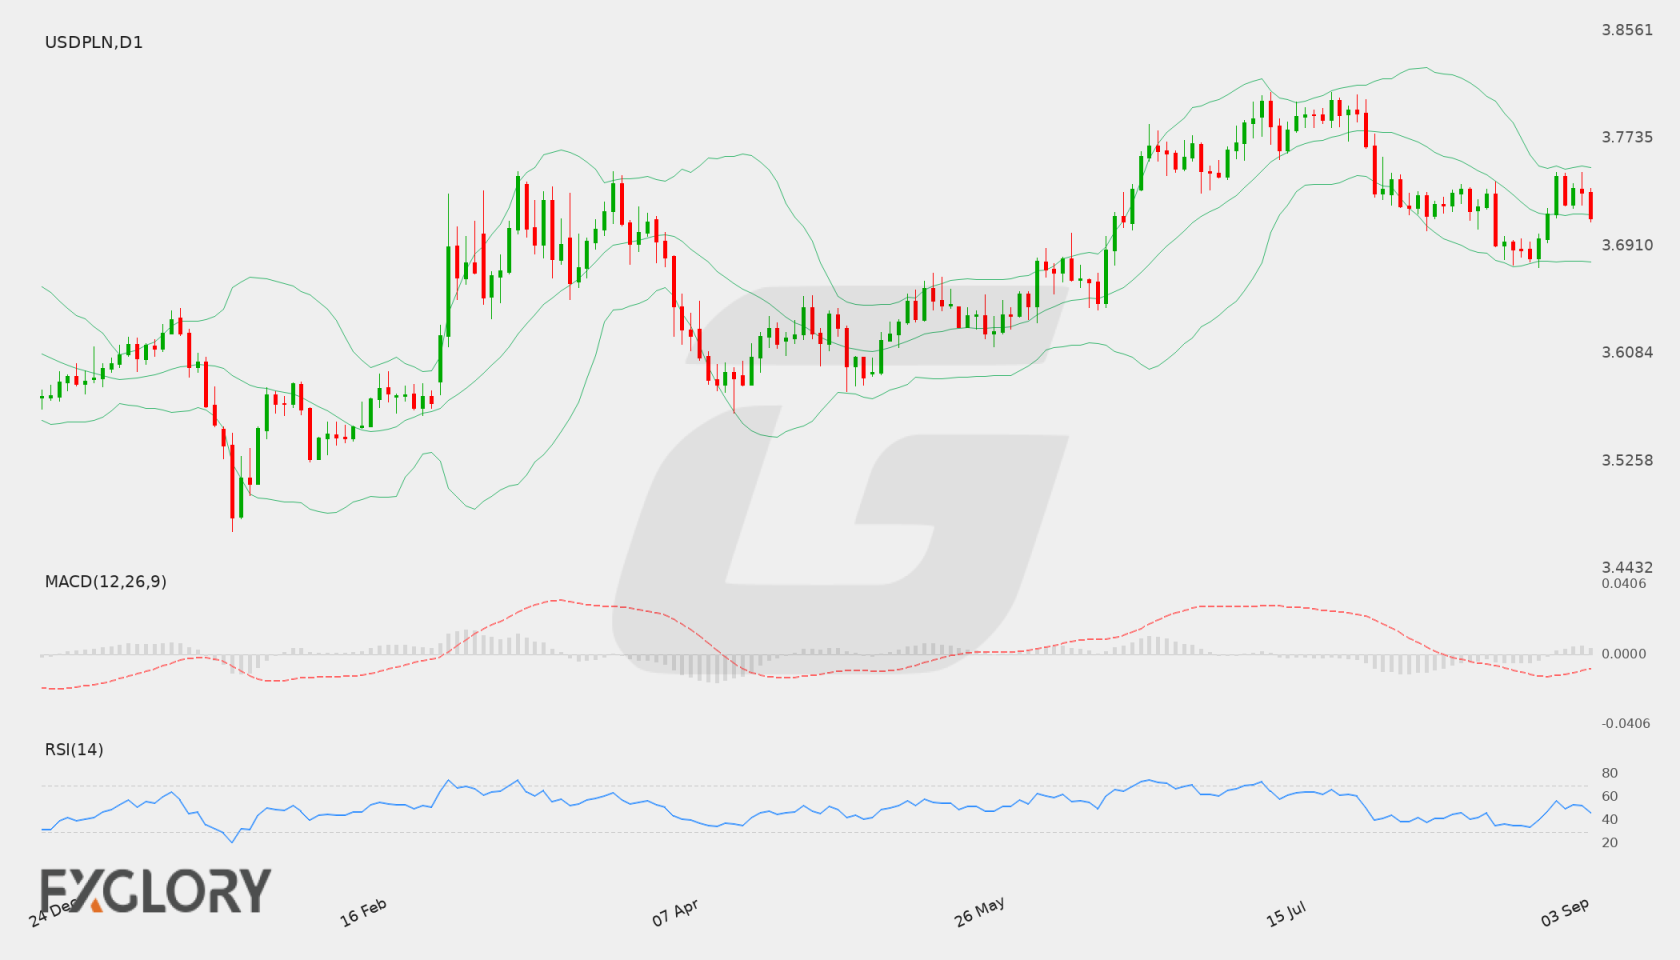
On the Daily (D1) chart, USD/PLN closed near 3.71535 after building support around the 3.68181 level in recent sessions. The pair demonstrated moderate upward momentum, bringing price action back toward the center of its recent daily range.
Key Technical Indicators:
Bollinger Bands: The Bollinger Bands on the daily timeframe display a middle line at 3.71491, with the upper band at 3.75064 and the lower band at 3.67919. USD/PLN is currently positioned near the middle band around 3.71535, signaling a neutral consolidation phase within the bands.
RSI: The 14-day Relative Strength Index (RSI) reads 47.76, hovering near the mid-range 50 level. This reading indicates a balanced market without clear overbought or oversold conditions on the daily timeframe.
MACD: The MACD indicator is currently situated at -0.01434, reflecting negative values below the baseline. While the negative reading indicates underlying downside pressure from previous moves, recent price stabilization hints at a potential pause in momentum.
Support and Resistance:
Key technical levels for USD/PLN feature resistance at 3.80866 and solid technical support located at 3.63174. Dynamic band levels are identified at 3.75064 for upper resistance and 3.67919 for lower support, with 3.71491 acting as the central pivot.
News to Watch for USDPLN This Week:
ISM Manufacturing PMI: Assesses manufacturing health and broad US macroeconomic momentum.
JOLTS Job Openings: Measures open job positions to provide clues on labor market strength.
ISM Manufacturing Prices: Tracks price trends within manufacturing to gauge inflationary dynamics.
ADP Non-Farm Employment Change: Offers an early signal on private sector hiring ahead of official employment reports.
ISM Services PMI: Evaluates activity in the service sector for broader economic perspective.
Non-Farm Employment Change: Serves as a major driver for US dollar strength and monetary policy expectations.
Unemployment Rate: Reflects overall labor force conditions that influence central bank decisions.
Average Hourly Earnings m/m: Indicates wage growth trends closely monitored for inflationary pressure.
Weekly Outlook and Consideration:
USD/PLN approaches the market week trading near 3.71535, directly aligned with its daily middle Bollinger Band at 3.71491. With the RSI at 47.76 and MACD at -0.01434, the market presents a neutral technical stance. Holding above 3.71491 could open the way for tests toward the upper Bollinger Band at 3.75064 and resistance at 3.80866. On the downside, weakness below the middle band may lead price toward the lower band at 3.67919, with further support at 3.63174. Volatility may increase as major US economic data releases unfold over the week.
Disclaimer: The analysis provided for USD/PLN is for informational purposes only and does not constitute investment advice. Traders are encouraged to perform their own analysis and research before making any trading decisions. Market conditions can change quickly, so staying informed with the latest data is essential.