Current weekly forecast: This outlook covers 11–17 October 2026 and remains valid until 17 October 2026, unless its stated invalidation condition is triggered earlier.
In brief
USDMXN has a bullish weekly bias, supported by positive D1 and H4 momentum, while the mixed D1 close sequence and elevated RSI require conditional interpretation.
The weekly structure favors the upside because the D1 trend is bullish, momentum is positive, and both the EMA50 and SMA200 slopes are rising. The reference close at 18.18091 is above the primary support at 17.90441 and the secondary support at 17.78922, leaving those levels as important structural reference points.
The setup is not one-sided: the D1 close sequence is mixed and RSI is 72.23, while H4 RSI is 75.6. H4 remains bullish and its positive MACD configuration supports tactical continuation, but the mixed closing sequence and elevated momentum readings mean that movement toward the resistance at 18.42473 remains conditional rather than assumed.
USD/MXN D1 technical-analysis context for the weekly forecast. Chart data captured 11 October 2026.
The USD/MXN currency pair heads into the upcoming week guided by a slate of critical United States macroeconomic data points and overarching market risk sentiment. Shifts in economic momentum and monetary policy expectations are set to steer the US dollar, with traders evaluating the health of the services sector, consumer sentiment trends, and labor market resilience. Meanwhile, emerging market currencies such as the Mexican peso remain sensitive to broader risk appetite and interest rate differential dynamics.
Price Action:
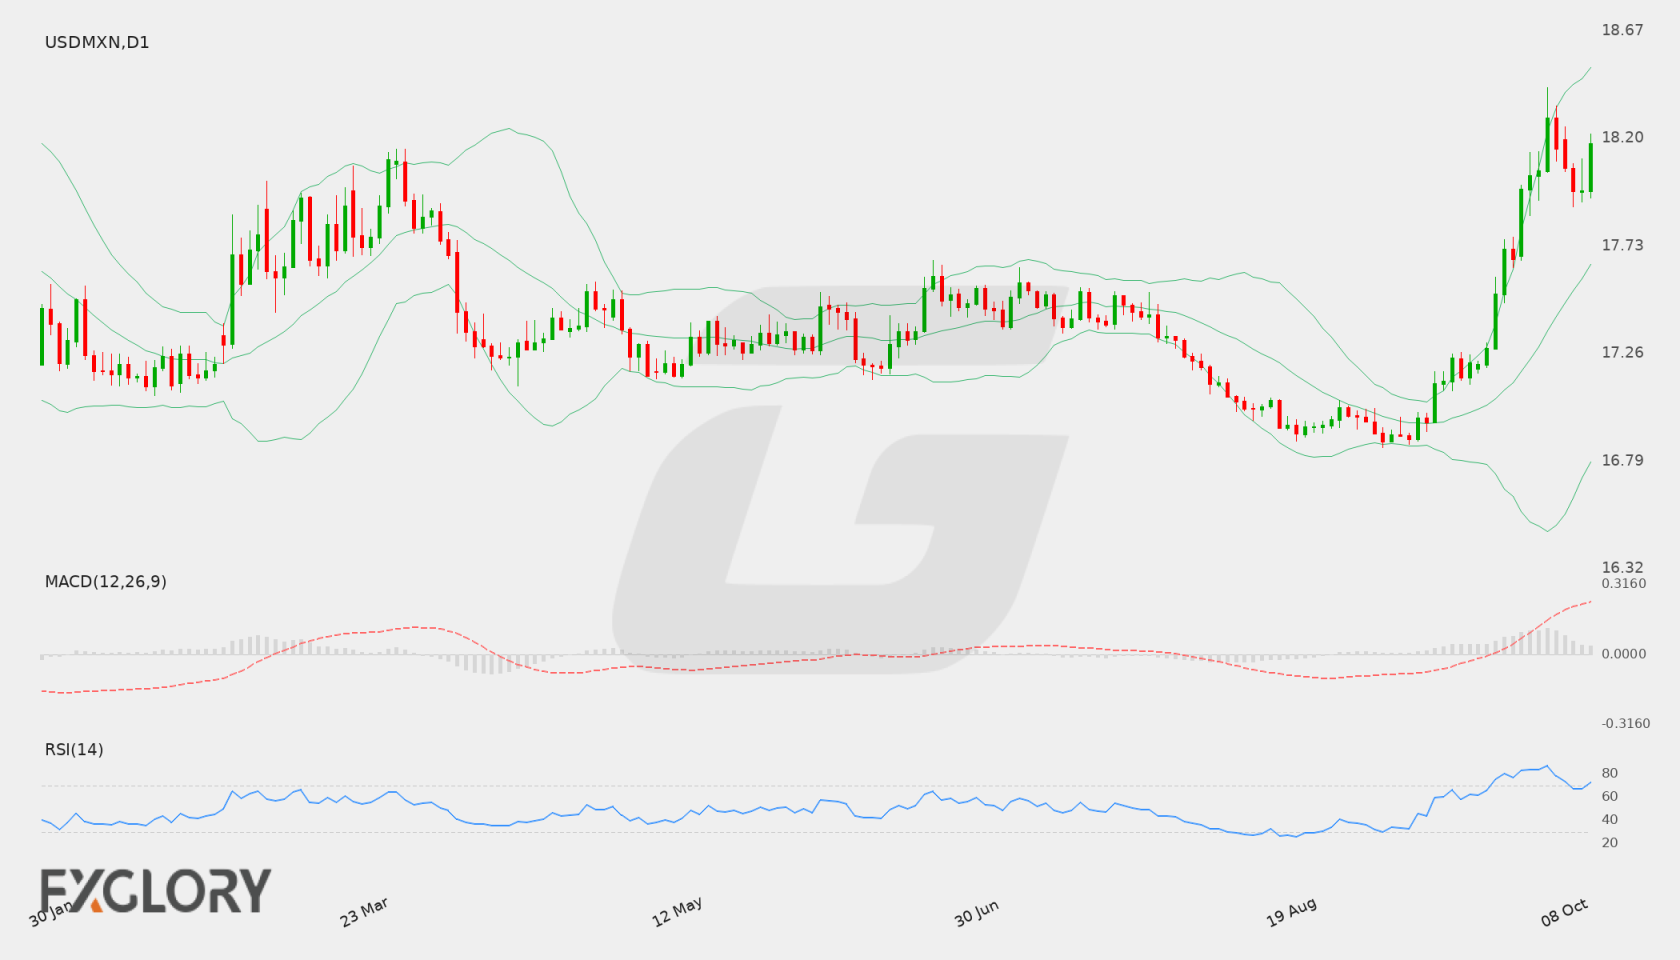
On the daily chart, USD/MXN has demonstrated pronounced upward momentum, driving higher from the 16.90 region and closing the latest session at 18.29208. The recent sequence of daily candles reveals consistent buying pressure, capped by an intraday test of 18.42473 before settling slightly lower. This persistent series of higher closes underscores strong demand, though the steep climb has pushed price action into extended territory.
Key Technical Indicators:
Bollinger Bands: The Bollinger Bands indicator highlights expanding volatility for USD/MXN. The middle band sits at 17.36120, flanked by an upper band at 18.23650 and a lower band at 16.48590. With the latest close at 18.29208 pushing above the upper band, the pair reflects an aggressive expansion phase that often signals stretched market conditions.
RSI: The 14-day Relative Strength Index (RSI) for USD/MXN is registered at 86.77. This places the indicator deep within overbought territory, signaling that the recent bullish run has become technically overstretched, which may increase the likelihood of temporary price consolidation or a corrective pause.
MACD: The daily MACD reading for USD/MXN stands at 0.26957, holding in positive territory. This positive value reflects solid upward momentum driving the pair higher, confirming that the prevailing daily trend remains tilted toward the buyers.
Support and Resistance:
Technical levels on the daily timeframe outline immediate resistance at 18.42473, which represents the recent high point of the current advance. On the downside, primary technical support is established at 16.85067, marking the base from which the broader uptrend originated.
News to Watch for USDMXN This Week:
ISM Services PMI: This release provides insight into the expansion or contraction of the US services sector and can influence demand for the US dollar.
FOMC Meeting Minutes: Detailed commentary from the monetary policy meeting may offer clues regarding future interest rate decisions.
Unemployment Claims: Weekly labor market data can impact sentiment surrounding the strength of the US employment backdrop.
Prelim UoM Inflation Expectations: Consumer perspectives on price pressures help shape market expectations for future inflation trends.
Prelim UoM Consumer Sentiment: Gauging consumer confidence levels provides context on household spending appetite and overall economic health.
Weekly Outlook and Consideration:
USD/MXN enters the week exhibiting robust bullish technicals on the daily timeframe, evidenced by a close of 18.29208, a positive MACD of 0.26957, and price trading above the upper Bollinger Band of 18.23650. However, with the daily RSI extended at 86.77, the pair faces overbought conditions as it confronts key resistance at 18.42473. Traders will be monitoring whether upside momentum can sustain a breach of current highs or if overextended indicators will invite a retracement toward support levels, notably with the 16.85067 floor defining the broader structural base.
Disclaimer: The analysis provided for USD/MXN is for informational purposes only and does not constitute investment advice. Traders are encouraged to perform their own analysis and research before making any trading decisions. Market conditions can change quickly, so staying informed with the latest data is essential.
Market participants analyzing USD/MXN are focusing on upcoming economic releases that could influence interest rate expectations and risk appetite. Fundamental sentiment for USDMXN remains sensitive to macroeconomic reports, where stronger economic signals may bolster the currency while weaker indicators could restrain upward movement.
Price Action:
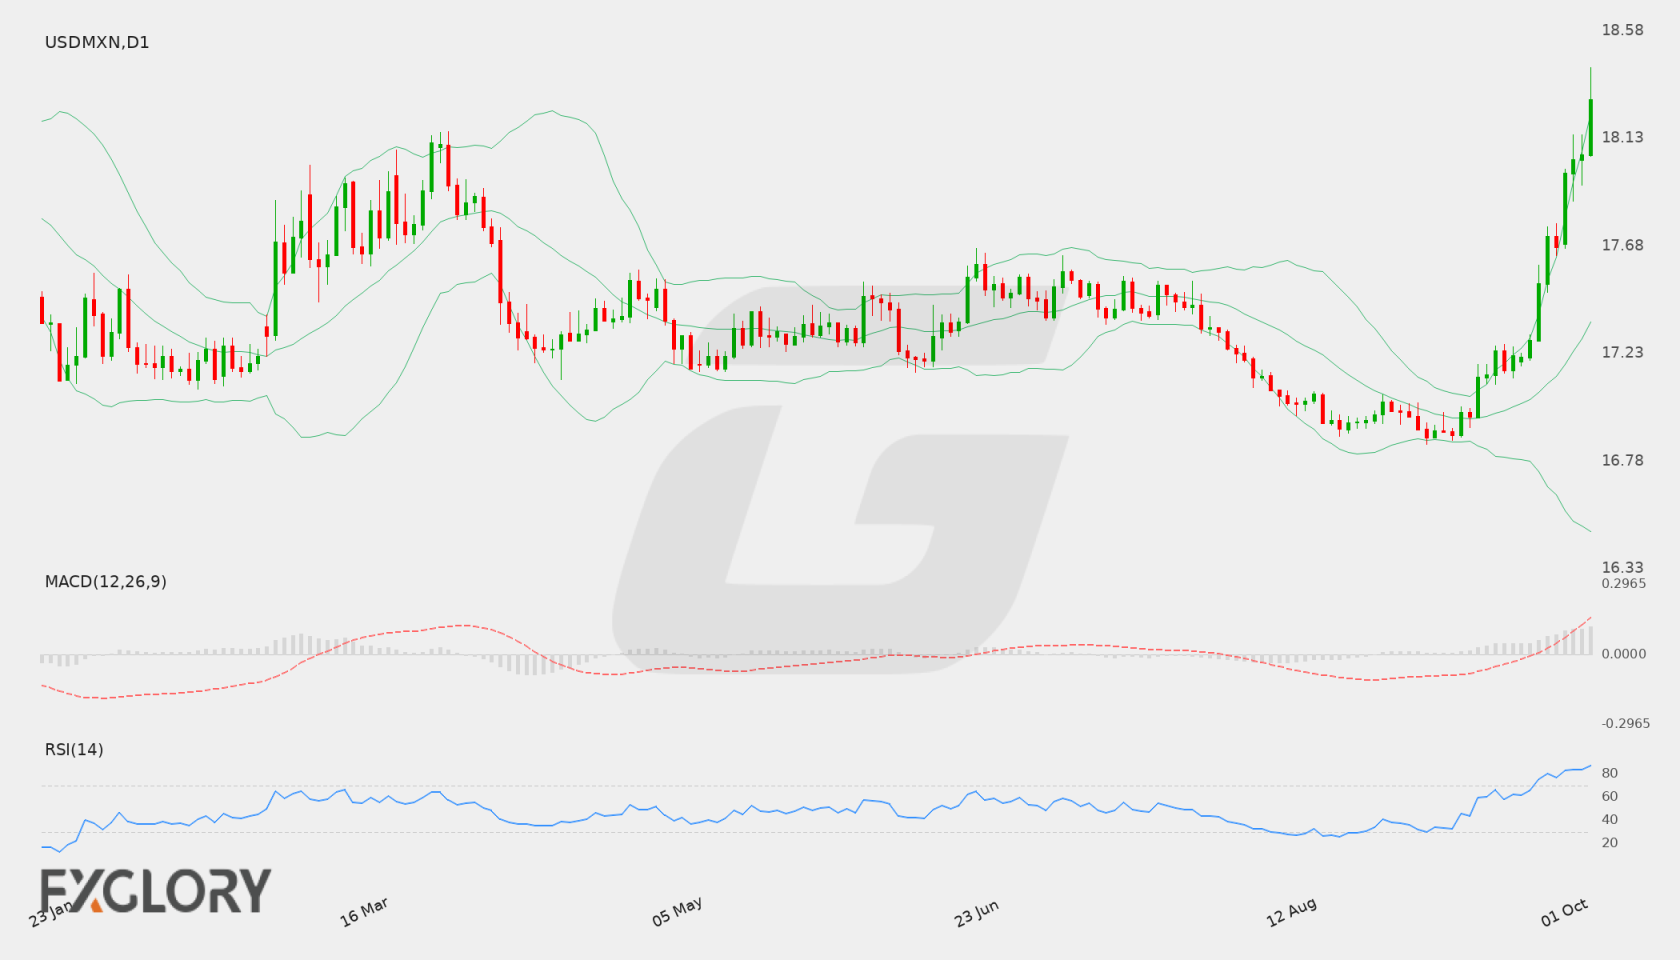
On the Daily (D1) chart, USD/MXN recently closed at 17.16087 following a rebound from lower levels near 16.88027. Recent price action indicates recovery off recent lows toward the upper boundary of the recent trading range.
Key Technical Indicators:
Bollinger Bands: The Daily Bollinger Bands reflect a middle line at 16.99082, an upper band at 17.18711, and a lower band at 16.79454. With the latest close at 17.16087, price action is hovering near the upper band, indicating tested resistance near higher band boundaries.
RSI: The 14-period Relative Strength Index (RSI) is currently positioned at 58.22, placing USD/MXN in neutral-to-bullish territory above the 50 mark without reaching overbought conditions.
MACD: The MACD line stands at a positive 0.001574, operating above the zero threshold. This reading suggests mild upward momentum on the daily timeframe for USD/MXN.
Support and Resistance:
Key daily technical levels for USD/MXN showcase primary support at 16.85067 and resistance at 17.63792.
News to Watch for USDMXN This Week:
CB Consumer Confidence: This indicator reflects overall consumer sentiment and economic expectations.
JOLTS Job Openings: This metric provides insight into labor market demand and hiring activity.
Core PCE Price Index m/m: This inflation measure tracks underlying price changes in consumer spending.
Final GDP q/q: This statistic evaluates overall national economic output and growth performance.
ISM Manufacturing PMI: This index gauges operational conditions and activity in the manufacturing sector.
Average Hourly Earnings m/m: This wage reading indicates labor cost developments and potential inflationary pressures.
Non-Farm Employment Change: This key employment dataset reveals net monthly job creation.
Unemployment Rate: This figure shows the percentage of the workforce actively seeking employment.
Weekly Outlook and Consideration:
The weekly outlook for USD/MXN presents a balanced technical setup as the pair trades near 17.16087. With the RSI at 58.22 and the MACD at 0.001574, indicators lean mildly positive, keeping price near the upper Bollinger Band of 17.18711. A sustained move higher could test key resistance at 17.63792, while a move lower could see the exchange rate return toward the middle band at 16.99082 or key support at 16.85067.
Disclaimer: The analysis provided for USD/MXN is for informational purposes only and does not constitute investment advice. Traders are encouraged to perform their own analysis and research before making any trading decisions. Market conditions can change quickly, so staying informed with the latest data is essential.
USD/MXN (USDMXN) dynamics remain influenced by economic data expectations and monetary policy outlooks. Market participants evaluate risk sentiment and yield differentials, which play a central role in driving movements for emerging market currency pairs like the Mexican Peso against the U.S. Dollar.
Price Action:
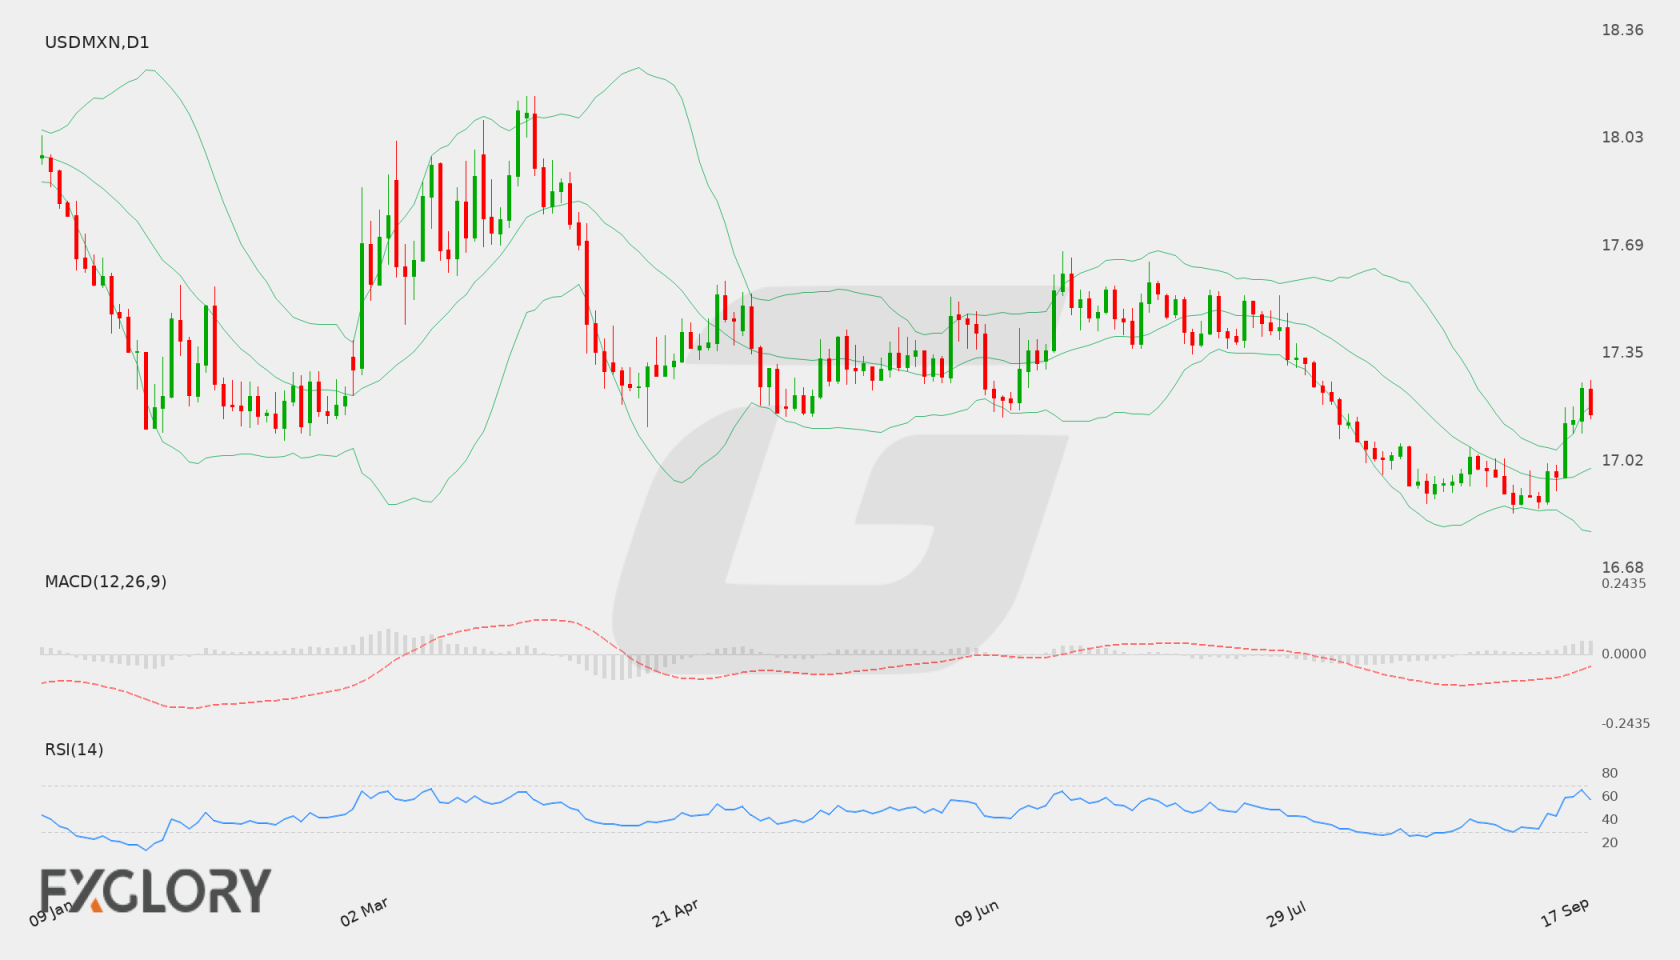
On the Daily (D1) chart, USD/MXN closed at 16.98227 after rebounding from a daily low near 16.85067. Price action shows a slight recovery back toward the middle of its recent trading range, exiting recent lower extremes.
Key Technical Indicators:
Bollinger Bands: The Bollinger Bands for USD/MXN show a middle line at 16.95878, an upper band at 17.05711, and a lower band at 16.86045. The current price of 16.98227 resides slightly above the middle band, reflecting temporary stabilization within the band range.
RSI: The 14-period RSI is recorded at 45.19, staying in neutral territory below the 50 line and indicating an absence of strong directional momentum or oversold conditions.
MACD: The MACD indicator is currently reading -0.07267, remaining in negative territory to highlight persistent underlying bearish pressure from previous downward swings.
Support and Resistance:
Key technical levels for USD/MXN feature established support at 16.85067 and resistance at 17.66976.
News to Watch for USDMXN This Week:
Core Retail Sales m/m: Shifts in consumer demand can influence economic expectations and currency strength.
Retail Sales m/m: Retail performance figures provide insights into economic health and consumer behavior.
FOMC Economic Projections: Central bank outlooks offer clarity on future monetary policy direction.
FOMC Statement: Official monetary policy announcements guide market sentiment and rate expectations.
Federal Funds Rate: Interest rate decisions heavily affect currency yield appeal and valuation.
FOMC Press Conference: Executive comments may generate volatility across exchange rate pairs.
Unemployment Claims: Weekly employment data serves as a measure of labor market conditions.
Weekly Outlook and Consideration:
USD/MXN enters the new week trading at 16.98227, framed between technical support at 16.85067 and resistance at 17.66976. Technical indicators highlight neutral momentum, with RSI at 45.19, MACD at -0.07267, and price holding near the Bollinger middle band of 16.95878. Price action will depend on whether buyers can push toward upper resistance or if sellers force a return toward support.
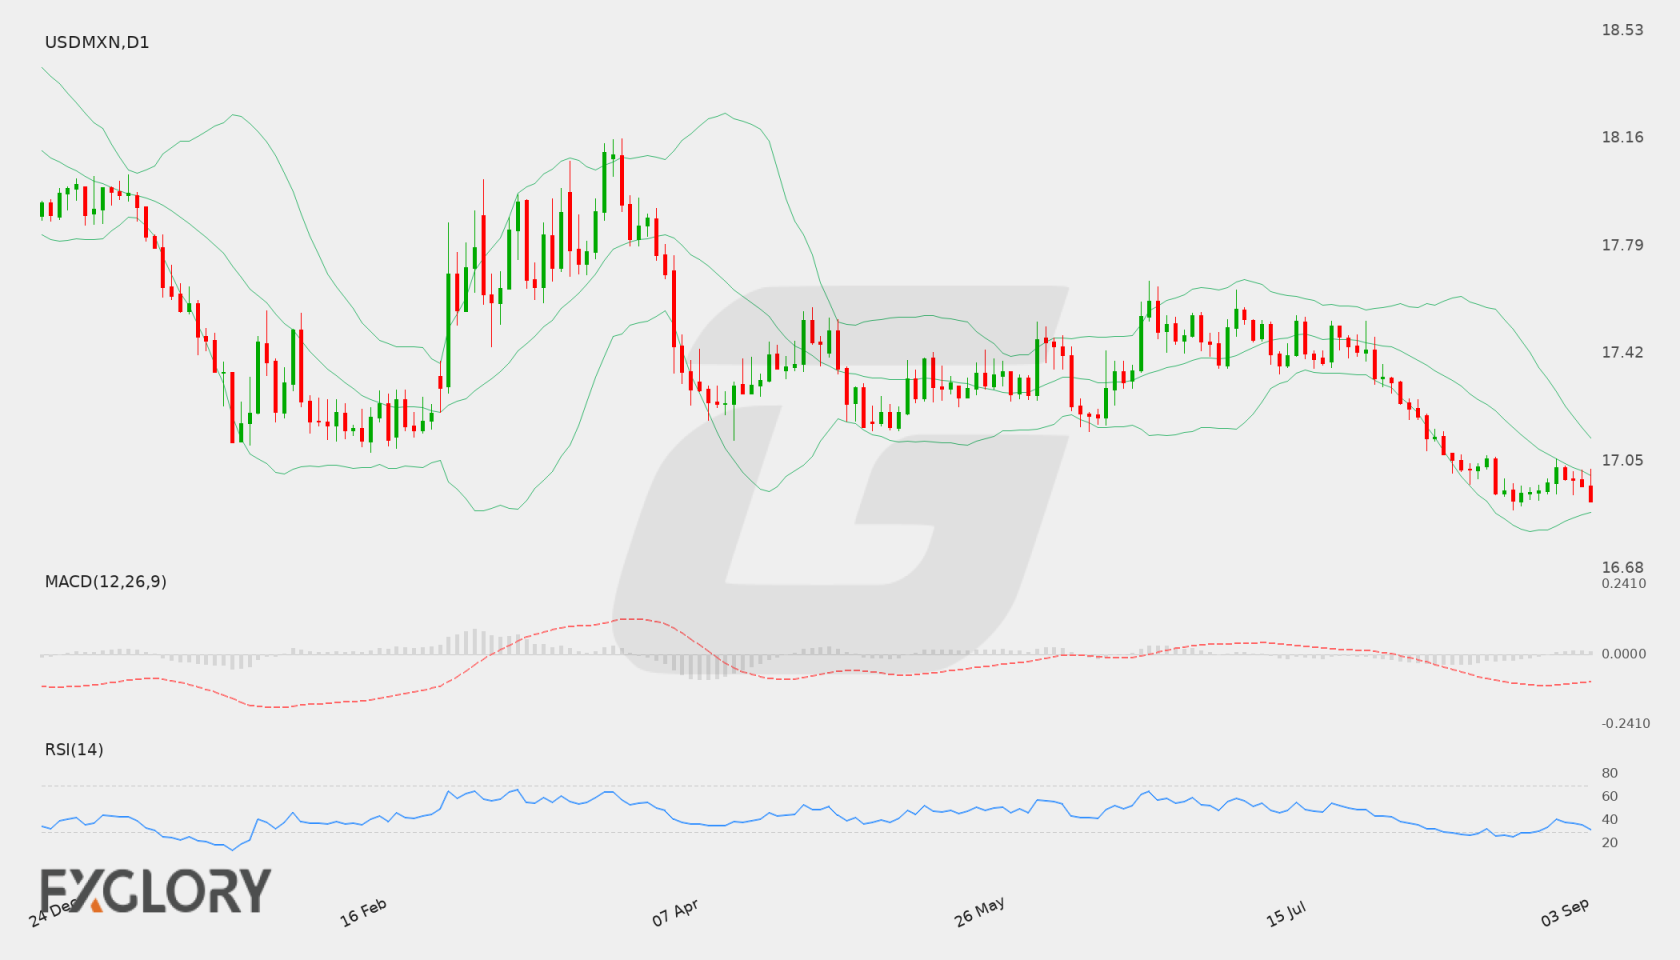
Disclaimer: The analysis provided for USD/MXN is for informational purposes only and does not constitute investment advice. Traders are encouraged to perform their own analysis and research before making any trading decisions. Market conditions can change quickly, so staying informed with the latest data is essential.
USD/MXN traders will closely monitor upcoming economic data releases from the United States, including key inflation measures and consumer sentiment indicators. These macroeconomic drivers could influence Federal Reserve policy expectations and alter yield differentials against the Mexican Peso.
Price Action:
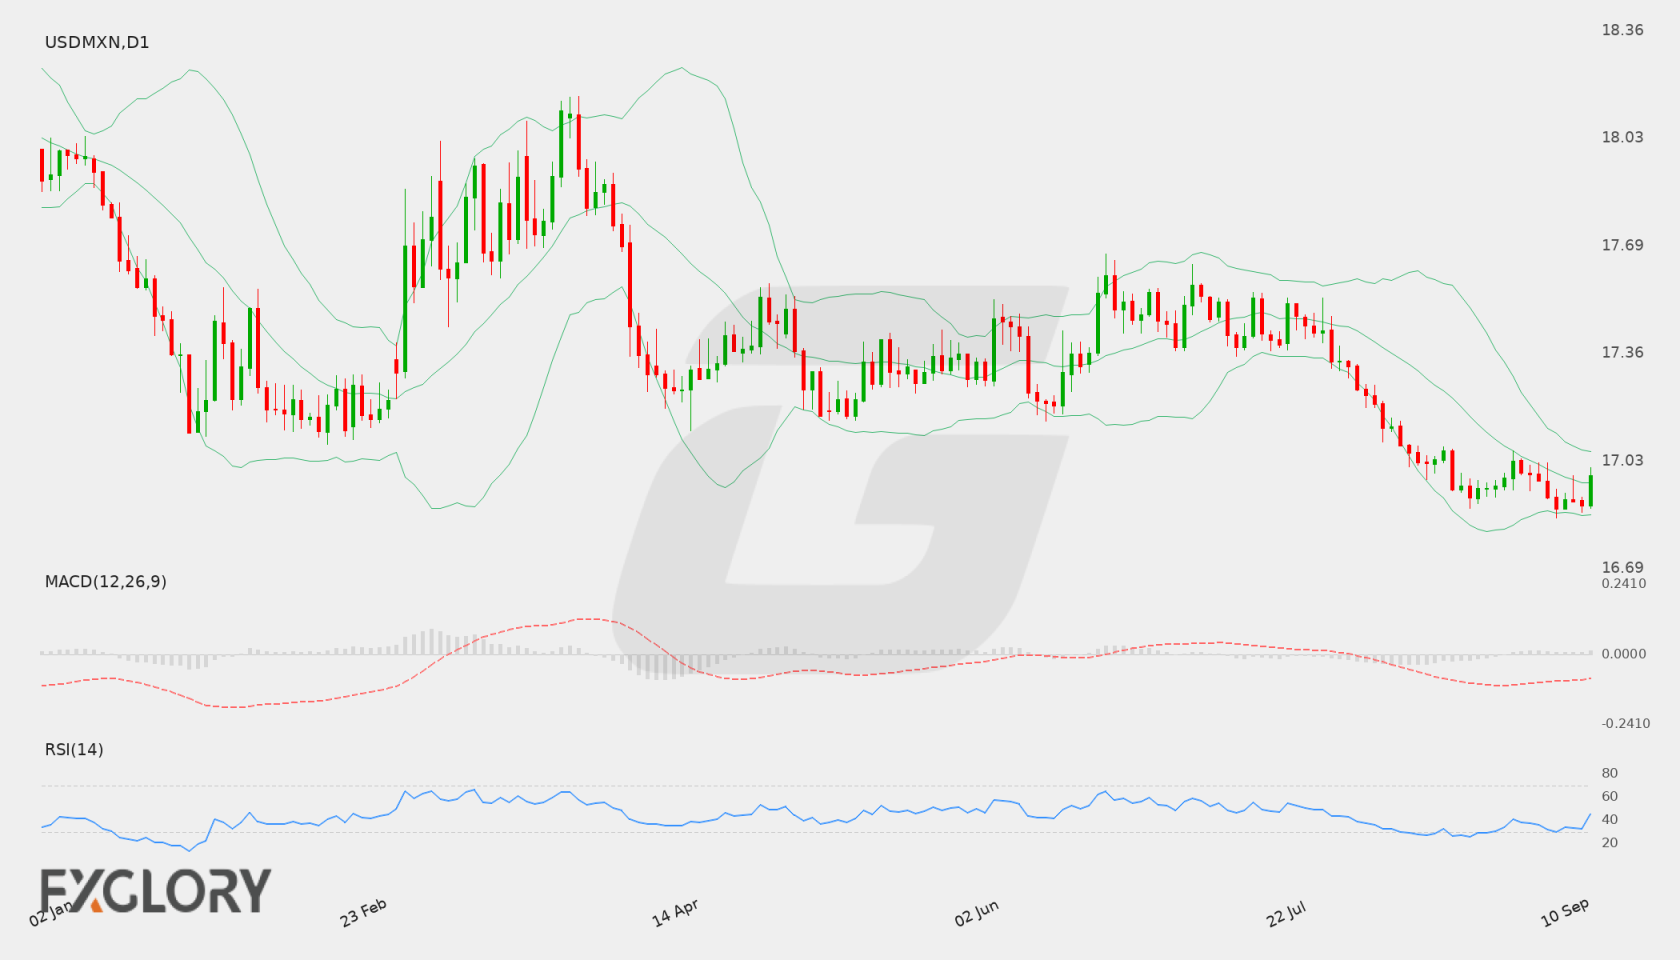
On the daily chart, USD/MXN has drifted lower over recent sessions, moving down from the 17.02791 high to close at 16.91427. The sustained downward trajectory reflects persistent bearish pressure as price approaches critical support levels.
Key Technical Indicators:
Bollinger Bands: The daily Bollinger Bands place the middle band at 17.00164, the upper band at 17.12969, and the lower band at 16.87358. With USD/MXN closing at 16.91427, price trades near the lower band, reflecting a downward trajectory and potential volatility expansion if lower boundaries are tested.
RSI: The 14-day Relative Strength Index (RSI) stands at 31.89. Positioned just above the oversold threshold of 30, it underscores firm bearish momentum while leaving room for potential market stabilization or downside continuation.
MACD: The MACD indicator prints a negative value of -0.08485, remaining below the zero line. This signal reflects ongoing momentum in favor of the bears for USD/MXN on the daily timeframe.
Support and Resistance:
Technical levels on the daily chart indicate immediate support near 16.88135, aligning close to the lower Bollinger band. On the upside, resistance is identified at 17.66976, marking a key barrier against potential bullish recovery attempts.
News to Watch for USDMXN This Week:
PPI m/m: Measures producer price inflation changes which can affect broader U.S. dollar valuation.
Core PPI m/m: Excludes volatile food and energy costs to gauge underlying producer price pressure.
Unemployment Claims: Offers weekly insight into U.S. labor market conditions that influence economic sentiment.
Core CPI m/m: Provides a key measure of underlying consumer inflation that impacts U.S. monetary policy expectations.
CPI y/y: Tracks headline annual consumer inflation trends, providing direction for global risk appetite and dollar strength.
Prelim UoM Consumer Sentiment: Reflects household confidence and overall U.S. economic strength.
Weekly Outlook and Consideration:
USD/MXN approaches the pivotal 16.88135 support region as bearish indicators like a negative MACD of -0.08485 and an RSI of 31.89 persist. A decisive break below support could push price toward lower territory near the 16.87358 lower Bollinger band, whereas a hold above support might encourage a rebound toward the 17.00164 middle band or key resistance at 17.66976.
Disclaimer: The analysis provided for USD/MXN is for informational purposes only and does not constitute investment advice. Traders are encouraged to perform their own analysis and research before making any trading decisions. Market conditions can change quickly, so staying informed with the latest data is essential.