Time Zone: GMT +3

Time Frame: 4 Hours (H4)

Fundamental Analysis:

The USDCAD H4 technical and fundamental analysis is expected to remain highly influenced by both US economic sentiment data and reduced Canadian market liquidity conditions. On the USD side, traders are monitoring the upcoming NAHB Housing Market Index and Treasury International Capital (TIC) data, both of which provide insight into economic confidence and foreign investment demand for US assets. Stronger-than-expected US economic releases could further support the US Dollar and strengthen the bullish momentum in the USDCAD price action. Meanwhile, Canadian banks are closed in observance of Victoria Day, which may reduce CAD liquidity and create irregular volatility conditions in the forex market. Overall, the current USDCAD daily analysis suggests that stronger USD fundamentals combined with weaker CAD liquidity conditions may continue supporting bullish pressure on the pair.

Price Action:

The USDCAD H4 price action analysis shows that from the recent lowest levels of the chart, the candles have been respecting a gradually rising support trendline, bouncing upward each time they approach it. More recently, bullish momentum has accelerated significantly, with stronger consecutive bullish candles pushing the pair higher at a faster pace. This shift in momentum suggests that buyers are increasingly dominating the market structure. Additionally, the current bullish recovery appears to be targeting the Fibonacci Expansion resistance zone, where the 61.8 Fibonacci level near 1.38365 becomes a major upside objective. As long as the ascending support trendline remains intact, the broader bullish outlook in this USDCAD H4 forecast may continue.

Key Technical Indicators:

Parabolic SAR: The Parabolic SAR dots remain positioned below the candles, confirming that bullish momentum is still active in the current trend. This indicator continues supporting the possibility of further upside continuation in the USDCAD H4 chart analysis.

RSI (14): The RSI currently stands at 67.61, indicating strong bullish momentum while remaining slightly below overbought territory. This suggests that buyers still have room to push the pair higher before stronger exhaustion signals emerge.

Stochastic (5,3,3): The Stochastic indicator readings at 47.34 and 57.13 reflect recovering bullish momentum after recent consolidation. The upward crossover supports the current positive movement and indicates strengthening buying pressure.

Support and Resistance:

Support: The nearest support level is located around 1.35795, aligning with the ascending support trendline that has repeatedly supported bullish rebounds.

Resistance: The immediate resistance zone appears near 1.38365, corresponding with the Fibonacci Expansion 61.8 level and previous market rejection area.

Conclusion and Consideration:

The overall USDCAD H4 technical analysis and price action forecast remains bullish as the pair continues respecting its ascending support trendline while gaining stronger upward momentum. Technical indicators including the Parabolic SAR, RSI, and Stochastic oscillator continue favoring buyers and support the possibility of additional upside movement toward the Fibonacci 61.8 expansion level. Fundamentally, stronger US economic expectations alongside reduced Canadian liquidity conditions due to Victoria Day may further increase volatility and strengthen bullish continuation scenarios. However, traders should still monitor price behavior near the major Fibonacci resistance zone, as temporary pullbacks or consolidation may occur before any sustained breakout develops.

Disclaimer:The analysis provided for USD/CAD is for informational purposes only and does not constitute investment advice. Traders are encouraged to perform their own analysis and research before making any trading decisions on USDCAD. Market conditions can change quickly, so staying informed with the latest data is essential.

USDCAD-H4-Technical-and-Fundamental-Analysis-for-05.18.2026

Time Zone: GMT +3

Time Frame: 4 Hours (H4)

Fundamental Analysis:

The EUR/USD currency pair is likely to remain sensitive to both USD and EUR fundamental drivers in today’s forex market analysis. For the US Dollar, traders will monitor Federal Reserve Governor Michael Barr’s speech, as any hawkish comments regarding inflation, interest rates, or monetary policy could support the USD and pressure EURUSD lower. In addition, the New York Manufacturing Index, Capacity Utilization Rate, and Industrial Production data may influence short-term USD volatility; stronger-than-expected figures would generally be positive for the US Dollar. On the Euro side, the ECB Economic Bulletin will be watched for insight into the European Central Bank’s economic outlook, inflation expectations, and future policy direction, making today’s EUR-USD H4 technical and fundamental analysis important for intraday and swing traders.

Price Action:

The EUR/USD price action on the H4 chart remains under short-term bearish pressure after the pair rejected the resistance zone near 1.1800 and moved back toward the key support area around 1.1665. The recent candles show weakening bullish momentum, with sellers regaining control after repeated failures to break above the upper horizontal resistance. Price is currently trading close to the lower side of the consolidation range, suggesting that a breakdown below support could extend the bearish EUR-USD H4 forecast. However, because the pair is approaching an oversold area, a temporary corrective bounce may appear if buyers defend the current support zone.

Key Technical Indicators:

Bollinger Bands (20,2.000): The Bollinger Bands on the EURUSD H4 chart show price trading near the lower band, confirming that bearish pressure has increased in the short term. The bands are slightly expanding, which indicates rising volatility after the recent rejection from the resistance zone. As long as price remains below the middle Bollinger Band, the EUR/USD technical analysis outlook favors sellers, although a short-term rebound from the lower band remains possible.

MACD (12,26,9): The MACD indicator remains below the signal line, showing that bearish momentum is still active on the EURUSD H4 timeframe. The histogram reflects weakening upside pressure and supports the current downside move toward support. Unless the MACD line begins to flatten and cross back above the signal line, the EUR/USD price action outlook remains vulnerable to further selling.

RSI (14): The RSI is near 29, placing EUR-USD close to oversold territory on the H4 chart. This confirms strong short-term selling pressure but also warns traders that the pair may be vulnerable to a corrective bounce if support holds. A recovery above the 30–35 area would suggest improving momentum, while continued weakness below 30 could confirm bearish continuation in the EUR/USD daily technical analysis.

Support and Resistance:

Support: Immediate support is located around 1.1665, which aligns with the lower horizontal range boundary and the current price reaction area. A confirmed H4 candle close below this zone could open the way for deeper bearish continuation.

Resistance: Key resistance is positioned near 1.1800, where the pair has repeatedly failed to break higher. A strong move above this level would weaken the bearish scenario and support a potential bullish recovery.

Conclusion and Consideration:

The EURUSD H4 technical and fundamental chart daily analysis suggests that the pair remains in a short-term bearish structure, with price trading near key support after rejecting the 1.1800 resistance zone. Bollinger Bands, MACD, and RSI all support the current bearish EUR/USD forecast, although oversold RSI conditions may trigger a temporary rebound if buyers defend the 1.1665 support area. Traders should closely monitor today’s USD news, especially Fed Governor Michael Barr’s remarks and US manufacturing-related data, as hawkish commentary or stronger US figures could strengthen the Dollar and increase downside pressure on EUR/USD. On the other hand, any dovish Fed tone or supportive ECB signals could help EURUSD stabilize and attempt a recovery within the H4 trading range.

Disclaimer: The analysis provided for EUR/USD is for informational purposes only and does not constitute investment advice. Traders are encouraged to perform their own analysis and research before making any trading decisions on EURUSD. Market conditions can change quickly, so staying informed with the latest data is essential.

EURUSD H4_Technical and Fundamental Analysis for 05.15.2026

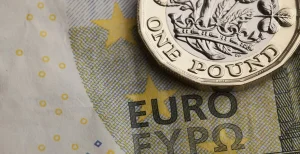
Time Zone: GMT +3

Time Frame: 4 Hours (H4)

Fundamental Analysis:

The EURGBP H4 technical and fundamental analysis is expected to remain sensitive to both Eurozone liquidity conditions and upcoming UK economic releases. For the Euro, French and German bank holidays related to Ascension Day may reduce market liquidity, potentially leading to irregular volatility and sharper price swings in the EURGBP price action. On the British Pound side, traders are closely monitoring RICS Housing data, GDP releases, Manufacturing Production, Industrial Production, Trade Balance, and speeches from BOE Chief Economist Huw Pill. Stronger UK economic data or hawkish BOE commentary could support GBP strength and increase bearish pressure on the pair. Overall, today’s EURGBP daily analysis suggests that lower Eurozone liquidity combined with UK macroeconomic expectations may create volatile trading conditions in the H4 timeframe.

Price Action:

The EURGBP H4 price action analysis shows that over the broader history of the chart, the candles have repeatedly found strong support near the 0.86196 level. However, despite these rebounds, each bullish recovery has formed lower highs, confirming the presence of sustained bearish pressure through the descending trendline. Price is now approaching a critical technical area where the bearish trendline converges with the horizontal support zone. This structure suggests increasing pressure on buyers, especially as the market continues failing to create stronger bullish breakouts. In this EURGBP H4 forecast, a confirmed breakdown below 0.86196 could trigger a stronger bearish continuation in line with the broader downtrend.

Key Technical Indicators:

Bollinger Bands (80): The candles are trading in the upper half of the Bollinger Bands while gradually moving toward the middle band. This suggests weakening bullish momentum and increasing probability of renewed bearish pressure.

MACD (12,26,9): The MACD values at 0.000481 and 0.000653 indicate that bearish momentum currently dominates the market. The signal line remaining above the MACD line reflects fading bullish attempts within the broader bearish structure.

Williams %R (14): The Williams %R reading at -50.67 reflects neutral market conditions. This indicates that the pair is neither overbought nor oversold, supporting the current consolidation near key support.

Support and Resistance:

Support: The key support level is located at 0.86196, where the candles have repeatedly found buying pressure throughout the recent market structure.

Resistance: The main resistance is positioned near 0.86705, aligning with the descending trendline that continues to cap bullish recoveries.

Conclusion and Consideration:

The overall EURGBP H4 chart daily analysis continues to favor a bearish outlook as the pair remains trapped beneath a descending resistance trendline while repeatedly testing the major support at 0.86196. Current EURGBP price action reflects weakening bullish momentum, with the formation of lower highs reinforcing the broader bearish structure. Technical indicators such as MACD and Bollinger Bands support the possibility of renewed downside pressure if support eventually fails. At the same time, low liquidity conditions due to Eurozone bank holidays may temporarily increase volatility and produce irregular price movements. Fundamentally, upcoming UK economic data and BOE commentary could become the main catalysts that determine whether the pair breaks lower or temporarily rebounds from support.

Disclaimer: The analysis provided for EUR/GBP is for informational purposes only and does not constitute investment advice. Traders are encouraged to perform their own analysis and research before making any trading decisions on EURGBP. Market conditions can change quickly, so staying informed with the latest data is essential.

EURGBP-H4-Technical-and-Fundamental-Analysis-for-05.14.2026

Time Zone: GMT +3

Time Frame: 4 Hours (H4)

Fundamental Analysis:

The USDJPY H4 technical and fundamental analysis is influenced by both US inflation-related data and Japanese economic indicators. For the USD, traders are watching Core PPI, PPI, crude oil inventories, Fed speeches from Susan Collins and Neel Kashkari, the 30-year bond auction, and developments around the Fed Chair nomination. Stronger-than-expected US inflation data or hawkish Fed commentary could support the US Dollar and push USDJPY price action higher. For the JPY, Bank Lending, Current Account, and Eco Watchers data may affect sentiment if they show stronger domestic activity. Overall, today’s USDJPY daily analysis suggests that volatility may rise as traders assess inflation pressure, bond yields, and central bank policy expectations.

Price Action:

The USDJPY H4 price action analysis shows that the pair has generally maintained a bullish trajectory from lower levels, moving upward along a rising support line. However, the upper price structure has remained turbulent, with the candles forming both higher and lower highs during different phases of the move. After several sharp drops, the candles are now attempting to recover, but price is struggling between the resistance zone of 157.877 and 157.462. A confirmed breakout above this area could strengthen the bullish continuation along the ascending support line. However, failure to break higher may signal renewed downside pressure and a possible move back toward the rising support trendline.

Key Technical Indicators:

Parabolic SAR: The Parabolic SAR dots are currently below the candles, supporting short-term bullish pressure. This suggests buyers are attempting to maintain control after the recent recovery.

RSI (14): The RSI at 61.10 shows bullish momentum above the neutral 50 level. However, it is not yet overbought, meaning the pair may still have room for further upside if resistance breaks.

Williams %R (14): The Williams %R at -12.77 indicates that price is near overbought territory. This confirms strong recent buying pressure but also warns of possible hesitation near resistance.

Support and Resistance:

Support: The main support is located near 156.300, aligning with the rising trendline that has guided the broader bullish structure on the USDJPY H4 chart.

Resistance: The key resistance zone is located between 157.462 and 157.877, where the candles are currently struggling to confirm a bullish breakout.

Conclusion and Consideration:

The overall USDJPY H4 chart daily analysis remains cautiously bullish as long as price continues to respect the ascending support line. Current USDJPY price action shows recovery attempts after sharp downside moves, but resistance between 157.462 and 157.877 remains the key decision area. Technical indicators support bullish momentum, with Parabolic SAR below price and RSI above 50, while Williams %R warns that the pair may be close to short-term overbought conditions. Fundamentally, US PPI data, Fed speeches, bond auction results, and Japanese economic releases may drive volatility during today’s session. A confirmed breakout above resistance could support bullish continuation, while rejection may increase the chance of a pullback toward trendline support.

Disclaimer: The analysis provided for USD/JPY is for informational purposes only and does not constitute investment advice. Traders are encouraged to perform their own analysis and research before making any trading decisions on USDJPY. Market conditions can change quickly, so staying informed with the latest data is essential.

USDJPY H4 Technical and Fundamental Analysis for 05.13.2026

Time Zone: GMT +3

Time Frame: 4 Hours (H4)

Fundamental Analysis:

The USDCHF currency pair reflects the relationship between the US Dollar and the Swiss Franc. Today’s USD/CHF daily analysis is strongly influenced by US inflation-related events, including CPI, Core CPI, ADP employment data, Fed speakers Williams and Goolsbee, the 10-year bond auction, and Treasury budget data. Hawkish Fed comments or stronger-than-expected US inflation and labor data could support the USD, while softer data may increase bearish pressure on USD CHF. For the CHF, the Producer Price Index remains important because it is a leading inflation indicator, but today’s USD-side events appear more likely to drive short-term volatility in the USD-CHF H4 chart forecast.

Price Action:

The USD-CHF price action on the H4 timeframe shows a clear bearish trend, with price moving inside a descending channel. Recent candles are small and indecisive near the lower channel area, showing that sellers remain active, but momentum is not aggressive. As long as USDCHF stays below the 0.7805–0.7820 resistance zone, the bearish technical outlook remains valid. A break above 0.7820 could trigger a corrective move toward 0.7860, while failure to recover may keep pressure toward 0.7760 and 0.7745.

Key Technical Indicators:

Bollinger Bands: Price is trading near the lower Bollinger Band, confirming bearish pressure in the USDCHF H4 technical analysis. The bands are slightly narrowing, which suggests weaker momentum and possible short-term consolidation. A small pullback toward the middle band around 0.7815–0.7820 remains possible before the next directional move.

MACD: The MACD is weak bearish and nearly flat, showing limited downside momentum. The histogram does not show strong selling acceleration, which supports the possibility of a short-term pause. However, the indicator still favors sellers unless a bullish crossover appears.

RSI: The RSI is around 41, which reflects slightly bearish market sentiment. It is not oversold, meaning USD-CHF still has room to move lower if bearish pressure continues. A recovery above the midline would be needed to improve bullish momentum.

Support and Resistance:

Support: Immediate support is located at 0.7770, with the next downside level near 0.7750.

Resistance: Immediate resistance is seen at 0.7820, followed by 0.7850.

Conclusion and Consideration:

The USD/CHF H4 chart analysis remains bearish while price trades inside the descending channel and below the 0.7820 resistance area. Bollinger Bands, MACD, RSI, Fibonacci levels, and current price action all suggest that sellers still have control, although bearish momentum is weak. Traders should closely monitor today’s USD news, especially CPI, Core CPI, ADP data, Fed speeches, and bond auction results, as these events may increase volatility in the USDCHF technical and fundamental analysis outlook.

Disclaimer: The analysis provided for USD/CHF is for informational purposes only and does not constitute investment advice. Traders are encouraged to perform their own analysis and research before making any trading decisions on USDCHF. Market conditions can change quickly, so staying informed with the latest data is essential.

USDCHF - FXGlory-Daily-Analysis-Image-Watermark-Final05.12.2026

Time Zone: GMT +3

Time Frame: 4 Hours (H4)

Fundamental Analysis:

The Silver H4 technical and fundamental analysis remains heavily influenced by US economic expectations and overall market sentiment toward safe-haven assets. Traders are currently monitoring the Federal Reserve Bank of Cleveland’s inflation expectations data and US Existing Home Sales figures, both of which can impact the US Dollar and precious metals volatility. Higher inflation expectations may increase demand for precious metals such as Silver as investors seek inflation hedges, while stronger US housing data could support the USD and pressure metals prices. Since Silver is highly sensitive to interest rate expectations and Dollar strength, any hawkish tone surrounding the Federal Reserve outlook may create additional volatility in the Silver H4 chart daily analysis. Overall, today’s market environment suggests that macroeconomic sentiment and US economic data may continue driving short-term XAGUSD price action.

Price Action:

The Silver H4 price action analysis shows that despite the broader bearish trend dominating the chart over the recent period, the pair has also been forming a gradually rising support line. Previously, the candles attempted to break below this ascending support structure, but sellers failed to maintain downside momentum, leading to a strong bullish rebound from the support area. The recent bullish move has pushed the candles back toward the major descending resistance line, where price is currently testing an important breakout zone. This structure suggests the possibility of a larger symmetrical triangle formation developing on the chart. If buyers successfully break above the current resistance and maintain bullish continuation, the Silver H4 forecast could target the Fibonacci Expansion 61.8 level in the medium term.

Key Technical Indicators:

Parabolic SAR: Despite the SAR dots remaining below the candles for an extended period, a new dot has recently appeared above the latest candles. This may indicate early signs of weakening bullish momentum or the beginning of a temporary correction phase.

MACD (12,26,9): The MACD values at 1.5166 and 1.5237 show that bullish momentum remains active, although the MACD line is slightly below the signal line. This suggests that upward momentum may be slowing despite the recent bullish recovery.

RSI (14): The RSI at 62.11 supports a bullish market structure, remaining comfortably above the neutral 50 level. However, the indicator is approaching overbought territory, which may lead to temporary consolidation near resistance.

Support and Resistance:

Support: The nearest support is aligned with the rising ascending trendline, which has repeatedly triggered bullish rebounds after previous pullbacks.

Resistance: The key resistance is located near the major descending trendline, where the latest bullish candles are currently facing rejection pressure.

Conclusion and Consideration:

The overall Silver H4 technical analysis suggests that although the broader market trend has been bearish, buyers are gradually regaining strength through the formation of a rising support structure. The recent sharp rebound from support indicates that bullish sentiment remains active, especially as price approaches the major descending resistance area. Technical indicators such as RSI and MACD continue supporting bullish momentum, although the new Parabolic SAR signal warns that short-term hesitation or consolidation may occur. From a broader perspective, a confirmed breakout above the resistance trendline could significantly strengthen the bullish outlook and support a move toward the Fibonacci Expansion 61.8 target. Fundamentally, US inflation expectations and housing-related data may become important catalysts for the next move in the XAGUSD H4 technical and fundamental analysis.

Disclaimer: The analysis provided for XAG/USD is for informational purposes only and does not constitute investment advice. Traders are encouraged to perform their own analysis and research before making any trading decisions on XAGUSD. Market conditions can change quickly, so staying informed with the latest data is essential.

Silver-H4-Technical-and-Fundamental-Analysis-for-05.11.2026

Time Zone: GMT +3

Time Frame: 4 Hours (H4)

Fundamental Analysis:

The BTC/USD pair reflects Bitcoin’s price action against the US Dollar, making today’s BTC-USD H4 technical and fundamental analysis highly sensitive to US macroeconomic news, Federal Reserve commentary, and geopolitical risk sentiment. The USD side may face volatility from Federal Reserve Governor Lisa Cook’s speech, labor-market indicators such as Average Hourly Earnings, Non-Farm Payrolls, and the Unemployment Rate, plus University of Michigan consumer sentiment and inflation expectations. Stronger-than-expected jobs or inflation-related data could support the US Dollar and pressure Bitcoin price action, while weaker data may improve risk appetite and help BTC/USD recover. In addition, the reported Iran and Strait of Hormuz developments, oil-market investigations, and military headlines may increase market uncertainty, potentially creating sharp volatility across crypto, commodities, and USD pairs during today’s Bitcoin H4 chart analysis.

Price Action:

The BTCUSD H4 price action remains inside a broader ascending channel, which keeps the medium-term Bitcoin technical outlook structurally constructive. However, the latest move shows a clear rejection from the upper channel area and upper Bollinger Band resistance, followed by several bearish candles that indicate active short-term selling pressure. Price is now trading near the middle Bollinger Band around the 79,700 zone, suggesting that bullish momentum is fading after the previous rally. As long as Bitcoin stays above the channel support, the larger BTC-USD H4 trend remains upward, but the immediate price action favors a corrective phase or consolidation.

Key Technical Indicators:

Bollinger Bands: The BTC/USD H4 Bollinger Bands show a rejection from the upper band and a pullback toward the middle band, signaling weakening bullish momentum. A break below the middle band could support a deeper short-term Bitcoin correction.

MACD Moving Average Convergence Divergence: The MACD is losing strength after the recent bullish move, with momentum turning weaker. This suggests short-term bearish pressure may continue if sellers stay active.

RSI(14): The RSI is around 46, showing neutral-to-slightly-bearish BTC-USD H4 momentum. A move back above 50 would indicate buyers are trying to regain control.

Support and Resistance:

Support: Immediate support is located around 77,200, aligning with the recent pullback zone and the lower side of the short-term Bollinger Band structure.

Resistance: The nearest resistance is around 82,400, matching the recent rejection area near the upper Bollinger Band and the upper region of the ascending channel.

Conclusion and Consideration:

The BTC-USD H4 chart analysis shows a short-term bearish correction inside a larger ascending channel, with Bitcoin price action still respecting the broader upward structure. Bollinger Bands, MACD, and RSI all point to weakening bullish momentum, making the 77,200 support level important for maintaining the current BTC/USD technical outlook. A confirmed break below support could increase selling pressure toward the lower channel area, while a recovery above 82,400 would revive the bullish Bitcoin H4 forecast and may open the way toward the upper channel resistance. Traders should monitor today’s USD news, Fed commentary, labor-market data, UoM sentiment, inflation expectations, and geopolitical headlines, as these catalysts may strongly influence BTC-USD volatility, crypto market sentiment, and intraday price action.

Disclaimer: The analysis provided for BTC/USD is for informational purposes only and does not constitute investment advice. Traders are encouraged to perform their own analysis and research before making any trading decisions on BTCUSD. Market conditions can change quickly, so staying informed with the latest data is essential.

BTCUSDH4 Technical and Fundamental Analysis for 05.08.2026 .webp

Time Zone: GMT +3

Time Frame: 4 Hours (H4)

Fundamental Analysis:

The GBPUSD H4 technical and fundamental analysis is expected to experience elevated volatility due to several important Bank of England and US economic events scheduled for today. For the British Pound, traders are focusing on speeches from BOE MPC members Clare Lombardelli and Alan Taylor, as any hawkish comments regarding inflation or future interest rates could strengthen GBP sentiment. In addition, the UK Construction PMI remains an important leading indicator for economic activity and business confidence. On the US side, market participants are monitoring Challenger Job Cuts, Unemployment Claims, labor cost and productivity data, as well as speeches from several Federal Reserve officials including Kashkari, Hammack, and John Williams. Since Fed commentary can significantly influence interest rate expectations, today’s GBPUSD daily analysis may see strong USD-driven volatility depending on whether officials maintain a hawkish or cautious tone.

Price Action:

The GBPUSD H4 price action analysis shows that the pair has been moving in a broader ascending trend, consistently forming higher highs and higher lows over recent weeks. However, the candles are now facing strong resistance around the 1.36295 level, where several bullish attempts have failed to establish a confirmed breakout. At the same time, price continues to react positively from the 1.34587 support area, which has repeatedly acted as a strong buying zone. Between these support and resistance levels, the candles appear to be forming a bullish triangle pattern, suggesting that buying pressure is gradually increasing despite the current consolidation. If the pattern remains valid and buyers manage to break above resistance, the GBPUSD H4 forecast may favor continuation of the bullish trend.

Key Technical Indicators:

Bollinger Bands (30): After a previous expansion phase, the Bollinger Bands are now narrowing, indicating decreasing volatility and a possible breakout setup. The current consolidation near the upper half of the bands supports the ongoing bullish structure.

Stochastic (5,3,3): The Stochastic readings at 36.68 and 52.20 reflect recovering bullish momentum from lower levels. The indicator suggests that buyers are attempting to regain control after the recent pullback.

RSI (14): The RSI at 56.51 remains above the neutral 50 level, supporting a moderate bullish outlook. This indicates that bullish momentum still exists without entering overbought territory.

Support and Resistance:

Support: The major support level is located at 1.34587, which has repeatedly triggered bullish rebounds and maintained the upward structure.

Resistance: The key resistance stands at 1.36295, where recent candles have struggled to confirm a decisive bullish breakout.

Conclusion and Consideration:

The overall GBPUSD H4 chart daily analysis continues to favor a bullish outlook, although the pair is currently consolidating below an important resistance zone. The repeated defense of support at 1.34587 and the formation of a bullish triangle pattern suggest that buyers still maintain underlying market strength. Technical indicators such as RSI and Stochastic support the possibility of renewed bullish momentum, while the narrowing Bollinger Bands hint at a potential volatility expansion ahead. Fundamentally, speeches from BOE and Federal Reserve officials may become the key catalysts that determine the next directional move in the GBPUSD technical and fundamental analysis. A confirmed breakout above 1.36295 could open the door for further bullish continuation in the H4 timeframe.

Disclaimer: The analysis provided for GBP/USD is for informational purposes only and does not constitute investment advice. Traders are encouraged to perform their own analysis and research before making any trading decisions on GBPUSD. Market conditions can change quickly, so staying informed with the latest data is essential.

GBPUSD-H4-Technical-and-Fundamental-Analysis-for-05.07.2026

Time Zone: GMT +3

Time Frame: 4 Hours (H4)

Fundamental Analysis:

The NZDUSD H4 technical and fundamental analysis is expected to be influenced by upcoming US labor market data and speeches from Federal Reserve officials, alongside important commentary from the Reserve Bank of New Zealand. For the USD, traders are closely monitoring the ADP Non-Farm Employment Change, as stronger employment growth could reinforce expectations of continued economic resilience and support the US Dollar. Additionally, speeches from Federal Reserve officials Musalem and Goolsbee may increase volatility if hawkish monetary policy signals are delivered. On the New Zealand side, market participants are focusing on statements and testimony from RBNZ Governor Anna Breman, as traders will look for clues regarding future interest rate policy and financial stability concerns. Overall, today’s NZDUSD daily analysis suggests that central bank communication and US employment-related data may become the primary drivers of short-term market sentiment and volatility.

Price Action:

The NZDUSD H4 price action analysis shows that the long-term structure of the chart remains bearish, despite the pair entering a range-bound phase in recent sessions. The candles are currently moving sideways, reflecting a temporary state of indecision between buyers and sellers after the earlier bearish trend. Price recently faced strong resistance around the descending trendline, where bullish attempts failed to establish a breakout above the broader bearish structure. Given the repeated rejection near resistance and the overall bearish momentum dominating the chart, the probability of a bearish breakout from the current range remains elevated. In this NZDUSD H4 forecast, sellers may attempt to regain control if the pair falls below the lower boundary of the consolidation zone.

Key Technical Indicators:

Bollinger Bands (20): The Bollinger Bands have narrowed significantly, reflecting declining volatility and consolidation in the NZDUSD H4 chart. Since the candles are currently trading near the middle band, the market appears balanced, although expanding bands later could signal a stronger directional move.

MACD (12,26,9): The MACD values at 0.000005 and 0.000113 indicate very weak bullish momentum. The narrow difference between the MACD and signal lines suggests fading buying pressure and supports the possibility of renewed bearish momentum.

Stochastic (5,3,3): The Stochastic readings at 68.17 and 58.48 show moderate bullish momentum without reaching overbought territory. However, the indicator also reflects hesitation, which aligns with the current range-bound NZDUSD price action.

Support and Resistance:

Support: The nearest support is located near the lower boundary of the current consolidation range, which may become the next bearish target if sellers regain momentum.

Resistance: The key resistance is aligned with the descending trendline that has repeatedly rejected bullish attempts and maintained the broader bearish structure.

Conclusion and Consideration:

The overall NZDUSD H4 chart daily analysis continues to favor a cautious bearish outlook, even though the pair is currently moving sideways within a consolidation range. The repeated rejection from the descending trendline reinforces the long-term bearish structure and suggests that sellers still maintain broader market control. Technical indicators such as the narrowing Bollinger Bands and weak MACD momentum highlight the possibility of an upcoming breakout after the current low-volatility phase. Meanwhile, the Stochastic indicator reflects temporary bullish attempts but not enough strength to confirm a bullish reversal. Fundamentally, RBNZ commentary and US employment-related data may become the catalysts that determine the next major move in the NZDUSD H4 technical and fundamental analysis.

Disclaimer: The analysis provided for NZD/USD is for informational purposes only and does not constitute investment advice. Traders are encouraged to perform their own analysis and research before making any trading decisions on NZDUSD. Market conditions can change quickly, so staying informed with the latest data is essential.

NZDUSD H4 Technical and Fundamental Analysis for 05.06.2026

Time Zone: GMT +3

Time Frame: 4 Hours (H4)


Fundamental Analysis:

The AUDUSD currency pair is likely to remain sensitive to both Australian Dollar and US Dollar fundamental analysis today, with traders focusing on RBA-related guidance, Australian household spending data, US PMI releases, JOLTS job openings, trade balance, New Home Sales, Fed speakers, and broader geopolitical risk headlines. Stronger-than-expected US ISM Services PMI, S&P Global Services PMI, labor-market data, or hawkish comments from Fed officials could support the USD and pressure the AUD/USD H4 chart outlook. On the AUD side, a hawkish RBA tone, resilient household spending, or stronger inflation-related commentary could help the Australian Dollar recover against the US Dollar. However, ongoing Middle East and Strait of Hormuz tension may increase safe-haven demand for the USD, making today’s AUD-USD daily technical and fundamental analysis especially dependent on risk sentiment, price action confirmation, and intraday volatility.

Price Action:

AUDUSD H4 is showing a loss of upside pressure after price failed near the first resistance zone around 0.7200, where several candles printed rejection wicks around the upper Bollinger Band. The latest candles suggest a mild bearish shift, with a rejection candle followed by a small two-candle selling sequence and a lower-high formation, pointing to short-term profit taking rather than a confirmed trend reversal. Price is currently hovering near the upper Fibonacci retracement area and close to the 23.6% level, meaning the AUDUSD price action analysis remains in a sideways-to-bullish consolidation phase unless sellers break the nearby support zone. A sustained move below 0.7150 may expose the mid-Fibonacci support area, while holding above this level could keep the pair supported for another bullish retest.

Key Technical Indicators:

Bollinger Bands(14): The AUD-USD H4 Bollinger Bands show price rejecting from the upper band near resistance, signaling a loss of bullish pressure. Price remains in the upper half of the bands, but a move below the middle band would support a deeper bearish correction.

MACD(12,26,9): The MACD is still above the zero line, suggesting the broader momentum has not fully turned bearish. However, the fading histogram and flattening lines indicate weakening upside momentum and possible short-term consolidation.

RSI(14): The RSI is around 46, showing that AUD/USD momentum has cooled into neutral-to-slightly-bearish territory. Since the RSI is not oversold, sellers still have room to push price lower if support breaks.

Support and Resistance:

Support: Immediate support is located around 0.7150, near the 23.6% Fibonacci zone and the recent consolidation area on the AUDUSD H4 chart. A deeper support area is seen around 0.7100, aligning with the 38.2% and 50.0% Fibonacci retracement levels if bearish momentum increases.

Resistance: Immediate resistance is located around 0.7200, where the price recently rejected near the upper Bollinger Band and the 0.0% Fibonacci area. A confirmed breakout above 0.7225 could reopen bullish continuation potential toward fresh higher highs on the AUDUSD H4 technical chart.

Conclusion and Consideration:

The AUDUSD H4 technical and fundamental analysis shows that the pair remains in a broader recovery structure, but short-term upside pressure is weakening after rejection near the 0.7200 resistance area. Bollinger Bands, MACD, RSI, and Fibonacci retracement levels all suggest that AUDUSD may enter a consolidation or mild bearish correction phase unless buyers defend the 0.7150 support zone. Fundamental catalysts from US PMI, JOLTS, trade balance, housing data, Fed speeches, RBA communication, and geopolitical risk headlines could create sharp volatility in the AUDUSD daily chart analysis. Traders should monitor whether price holds above support for a renewed bullish attempt or breaks lower toward the 38.2% and 50.0% Fibonacci retracement zones.

Disclaimer: The analysis provided for AUD/USD is for informational purposes only and does not constitute investment advice. Traders are encouraged to perform their own analysis and research before making any trading decisions on AUDUSD. Market conditions can change quickly, so staying informed with the latest data is essential.

FXGlory-Daily-Analysis-AUDUSD-H4-Technical-and-Fundamental-Analysis-for-05.05.2026