Current weekly forecast: This outlook covers 11–17 October 2026 and remains valid until 17 October 2026, unless its stated invalidation condition is triggered earlier.
In brief
The weekly bias is Bullish, supported by D1 trend and momentum, but neutral H4 conditions and mixed closes leave room for consolidation before further directional development.
GBP/NZD enters the week with a D1 close of 2.35922, above the primary support at 2.34571 and below the primary resistance at 2.36586. The broader D1 trend is bullish, momentum is positive, and both the EMA50 and SMA200 slopes are rising, giving the weekly structure a constructive foundation.
The tactical picture is less decisive. H4 is neutral, with its close at 2.35803 near the supplied H4 resistance at 2.35904 and below its EMA20 at 2.35867, while H4 MACD remains below its signal. Mixed D1 closes and contracting volatility therefore make consolidation or delayed follow-through plausible within the established level framework.
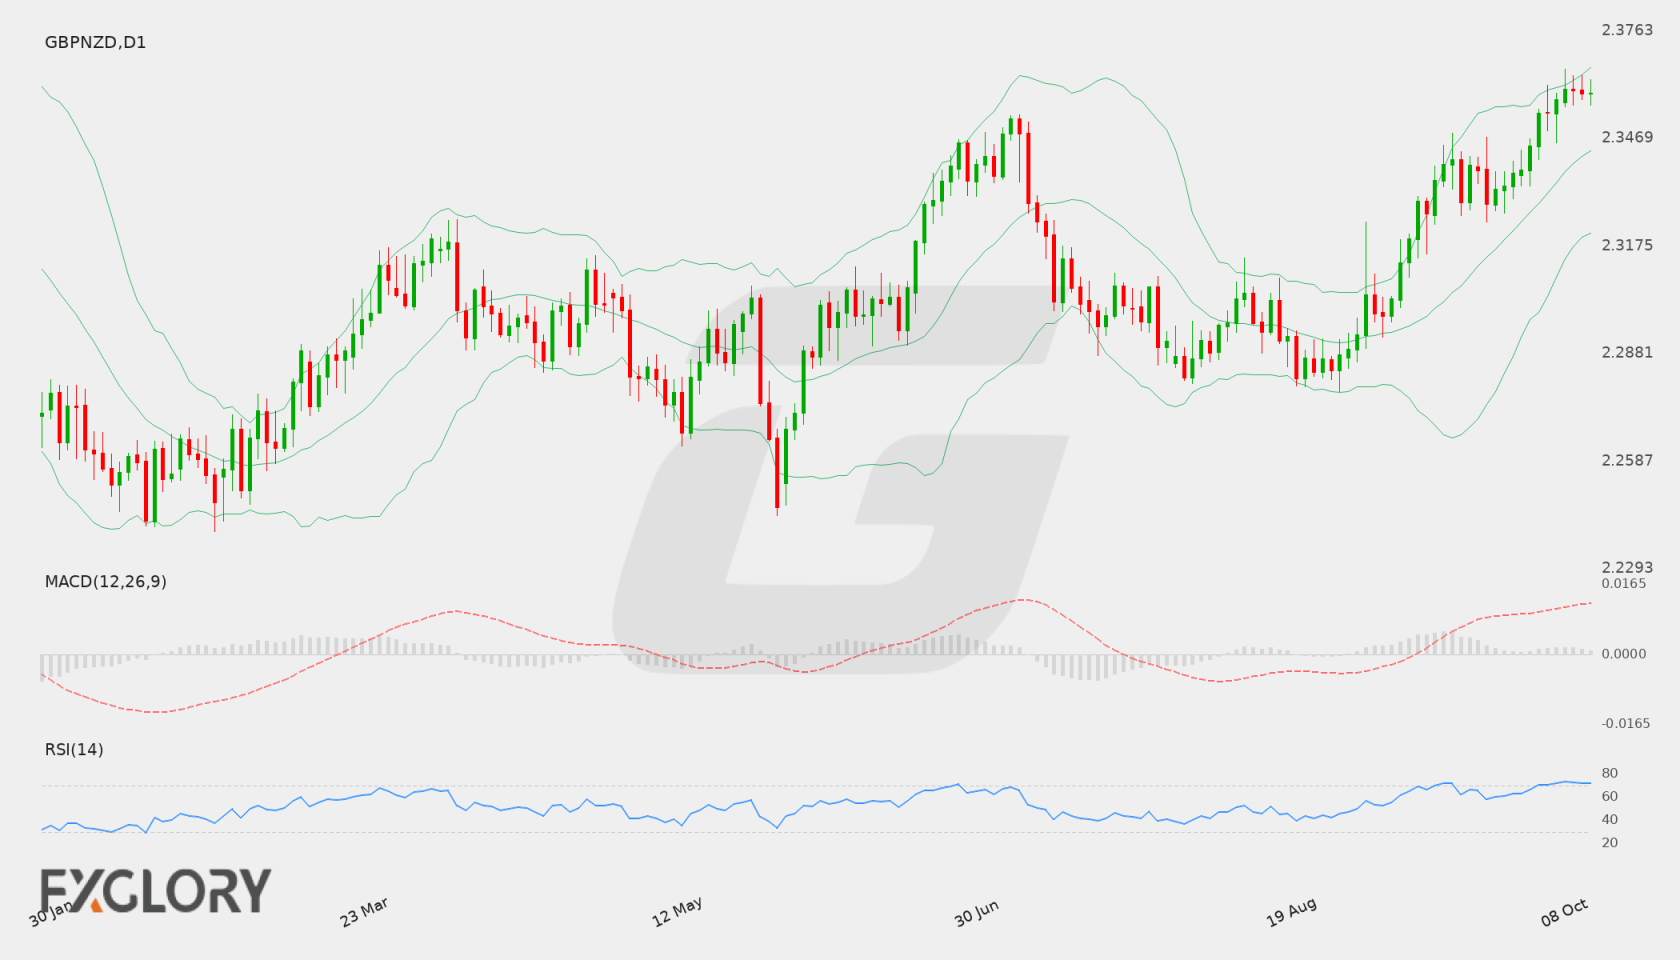
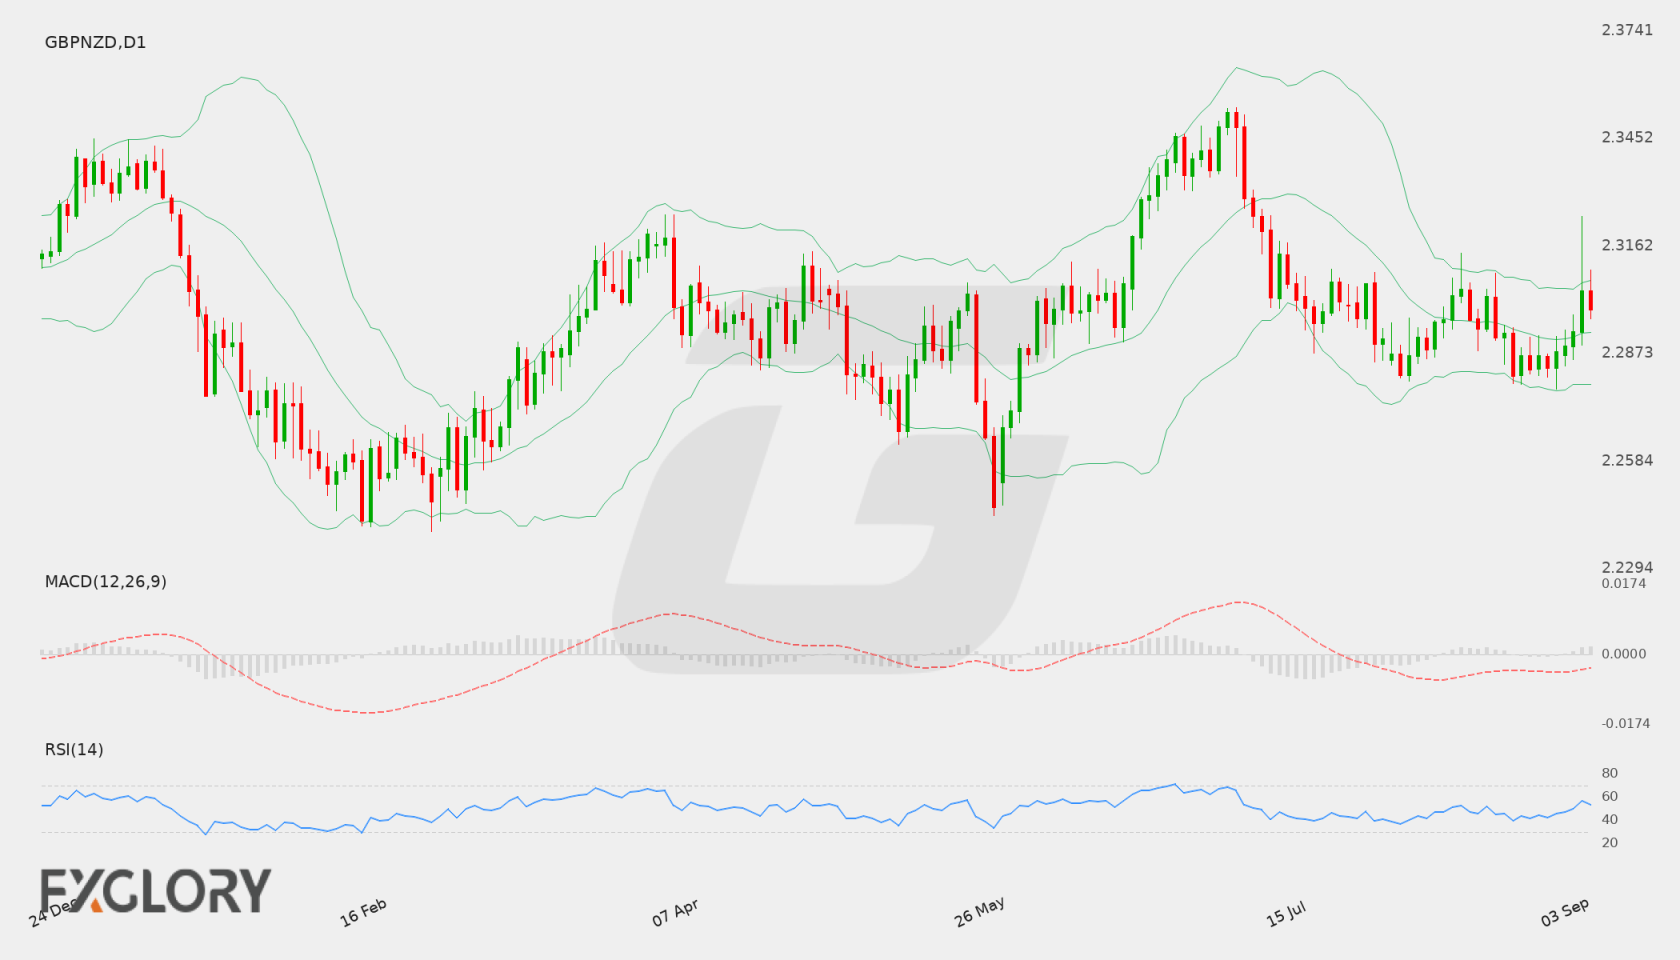
GBP/NZD D1 technical-analysis context for the weekly forecast. Chart data captured 11 October 2026.
The British pound faces key scheduled macroeconomic events that could provide direction against the New Zealand dollar. Traders are tracking UK labor and growth figures, including the Claimant Count Change, GDP m/m, and the Average Earnings Index 3m/y, which will offer insight into UK economic activity and wage inflation. In the absence of high-impact domestic releases from New Zealand, the pair remains responsive to relative economic performance and broader market risk dynamics.
Price Action:
GBP/NZD has maintained a steady upward trajectory on the daily chart, advancing from recent levels near 2.32894 toward the last close of 2.35391. The pair recently tested a session high at resistance of 2.36130 after establishing a series of higher daily closes from 2.33827 and 2.34482, demonstrating sustained short-term buying interest across recent trading days.
Key Technical Indicators:
Bollinger Bands: On the daily timeframe, Bollinger Bands reflect a middle band at 2.33185, bounded by an upper band at 2.36012 and a lower band at 2.30358. With the latest close at 2.35391, price action is hovering near the upper boundary of the bands, indicating heightened volatility and price positioning well above the middle band.
RSI: The 14-day Relative Strength Index (RSI) stands at 70.25. By crossing slightly above the standard 70 threshold, the indicator reflects overbought conditions following consecutive daily price increases, suggesting that upside momentum is extended.
MACD: The daily MACD indicator registers at 0.01163, holding in positive territory. This reading aligns with the recent advance toward the 2.35391 level, confirming positive momentum without providing directional guarantees.
Support and Resistance:
Key technical reference levels on the daily chart show immediate resistance at 2.36130, marking the recent high. On the downside, primary technical support is established at 2.27772, while the 20-period middle Bollinger Band at 2.33185 acts as an intermediate reference level below the current close of 2.35391.
News to Watch for GBPNZD This Week:
Claimant Count Change: This report measures changes in UK unemployment filings and can influence sentiment around the British pound.
GDP m/m: This monthly release provides an update on overall UK economic output and broader growth conditions.
Average Earnings Index 3m/y: This labor metric reflects wage growth trends that may impact expectations for domestic inflation.
Weekly Outlook and Consideration:
The weekly outlook for GBP/NZD (GBPNZD) reflects strong upward momentum, as the pair holds near 2.35391 and challenges resistance at 2.36130. Technical readings, including a positive MACD of 0.01163 and an RSI of 70.25, underscore firm bullish sentiment alongside overbought conditions near the upper Bollinger Band at 2.36012. Market participants will be observing whether the exchange rate can hold above intermediate support at the 2.33185 middle band or test deeper support at 2.27772 as upcoming UK data releases unfold.
Disclaimer: The analysis provided for GBP/NZD is for informational purposes only and does not constitute investment advice. Traders are encouraged to perform their own analysis and research before making any trading decisions. Market conditions can change quickly, so staying informed with the latest data is essential.
Fundamental drivers for GBP/NZD are shaped by broader market sentiment, monetary policy expectations, and macroeconomic performance. Without scheduled local calendar data, market participants will observe overall risk appetite and general economic developments impacting both currencies.
Price Action:
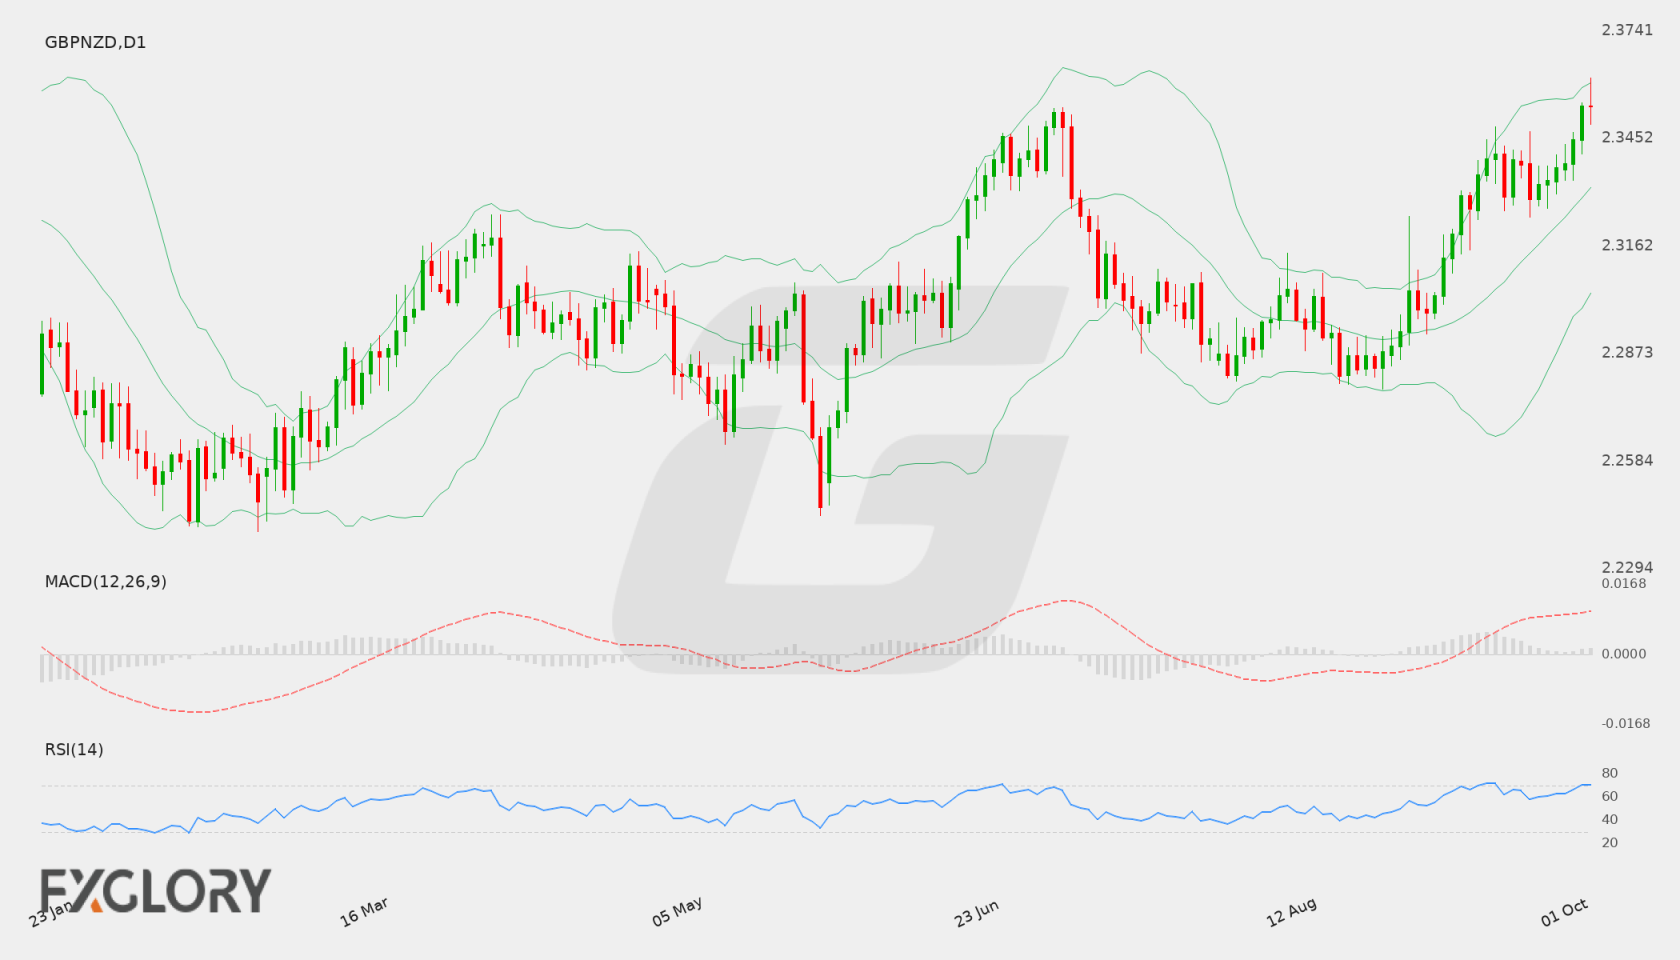
The Daily (D1) chart shows GBP/NZD recently advancing from lows near 2.28310 to test levels above 2.34100 before settling at a last close of 2.32956. The price continues to operate above the recent swing structure, reflecting positive momentum on the daily timeframe.
Key Technical Indicators:
Bollinger Bands: Bollinger Bands on the daily chart display a middle line at 2.30651, with the upper band at 2.34717 and the lower band at 2.26586. The last close of 2.32956 remains within the upper half of the bands, signaling sustained bullish sentiment.
RSI: The 14-day Relative Strength Index (RSI) stands at 61.95, indicating constructive bullish momentum while staying below overbought territory.
MACD: The D1 MACD indicator is currently reading 0.01050, holding above the zero line and reflecting positive underlying momentum for GBP/NZD.
Support and Resistance:
Key technical levels for GBP/NZD on the daily timeframe include primary support at 2.27772 and upper resistance at 2.35338.
News to Watch for GBPNZD This Week:
No specific events are available: Traders should monitor generic high-impact releases, central bank comments, and broader risk sentiment for potential volatility.
Weekly Outlook and Consideration:
The weekly outlook for GBP/NZD remains leaning positive on the daily chart. Holding above the Bollinger middle band of 2.30651 and supported by an RSI of 61.95 alongside a positive MACD value of 0.01050 suggests potential for further tests toward resistance at 2.35338. Conversely, a reversal lower could target support at 2.27772.
Disclaimer: The analysis provided for GBP/NZD is for informational purposes only and does not constitute investment advice. Traders are encouraged to perform their own analysis and research before making any trading decisions. Market conditions can change quickly, so staying informed with the latest data is essential.
The GBP/NZD exchange rate faces an event-heavy week featuring UK labor metrics, inflation figures, retail sales data, and the latest central bank interest rate decision alongside New Zealand quarterly growth indicators. These economic releases are expected to drive sentiment and influence price momentum across both currencies.
Price Action:
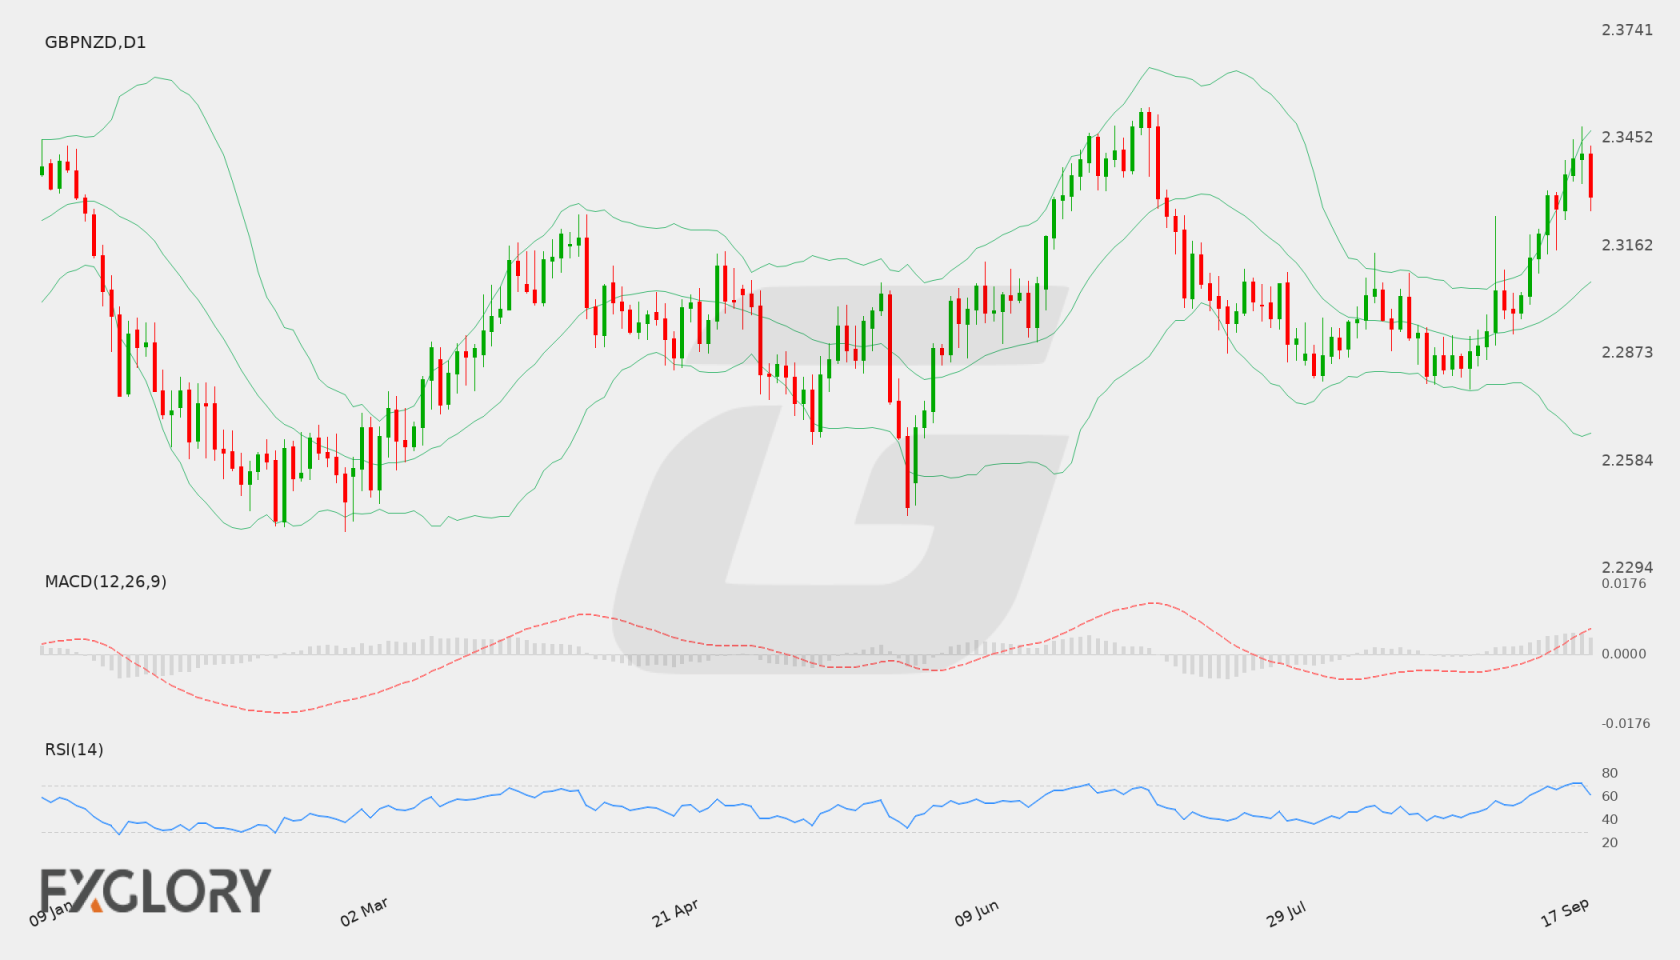
On the daily chart, GBP/NZD has demonstrated strong bullish price action, advancing steadily over recent sessions from lower levels near 2.28775 to a latest close of 2.32975. The sequential higher daily highs and lows confirm sustained short-term buying pressure.
Key Technical Indicators:
Bollinger Bands: The pair is trading above the upper Bollinger Band of 2.32126, with the last close reaching 2.32975. The middle band sits at 2.29678 while the lower band is located at 2.27230, indicating an expansion in volatility and strong upward price movement.
RSI: The 14-period RSI is currently positioned at 69.06, approaching the overbought threshold and reflecting strong bullish sentiment.
MACD: The MACD indicator remains in positive territory with a value of 0.00485, confirming that upside momentum is currently favoring buyers.
Support and Resistance:
Key daily technical levels for GBPNZD highlight immediate technical resistance at 2.35338 and key support at 2.27772.
News to Watch for GBPNZD This Week:
Claimant Count Change: Provides updated labor market data that can influence central bank rate expectations.
Average Earnings Index 3m/y: Highlights wage growth trends that impact broader inflation prospects.
CPI y/y: Offers a key measure of consumer price inflation affecting monetary policy decisions.
GDP q/q: Delivers important insight into overall economic expansion and output growth.
Official Bank Rate: Determines key policy interest rate settings for borrowing costs.
MPC Official Bank Rate Votes: Discloses the internal vote distribution among central bank policymakers.
GBP/NZD exhibits notable strength heading into the week, closing at 2.32975 above the upper Bollinger Band with an RSI near 69.06. While MACD points to ongoing momentum, upcoming economic news events and nearby resistance at 2.35338 could introduce two-way volatility, with major support resting lower at 2.27772.
Disclaimer: The analysis provided for GBP/NZD is for informational purposes only and does not constitute investment advice. Traders are encouraged to perform their own analysis and research before making any trading decisions. Market conditions can change quickly, so staying informed with the latest data is essential.
GBP/NZD continues to respond to shifting global risk sentiment and domestic economic signals. Investors are evaluating sovereign growth momentum and trade conditions, which influence demand for the currency pair. The pair’s trajectory remains sensitive to macro data performance and broader appetite across international capital markets.
Price Action:
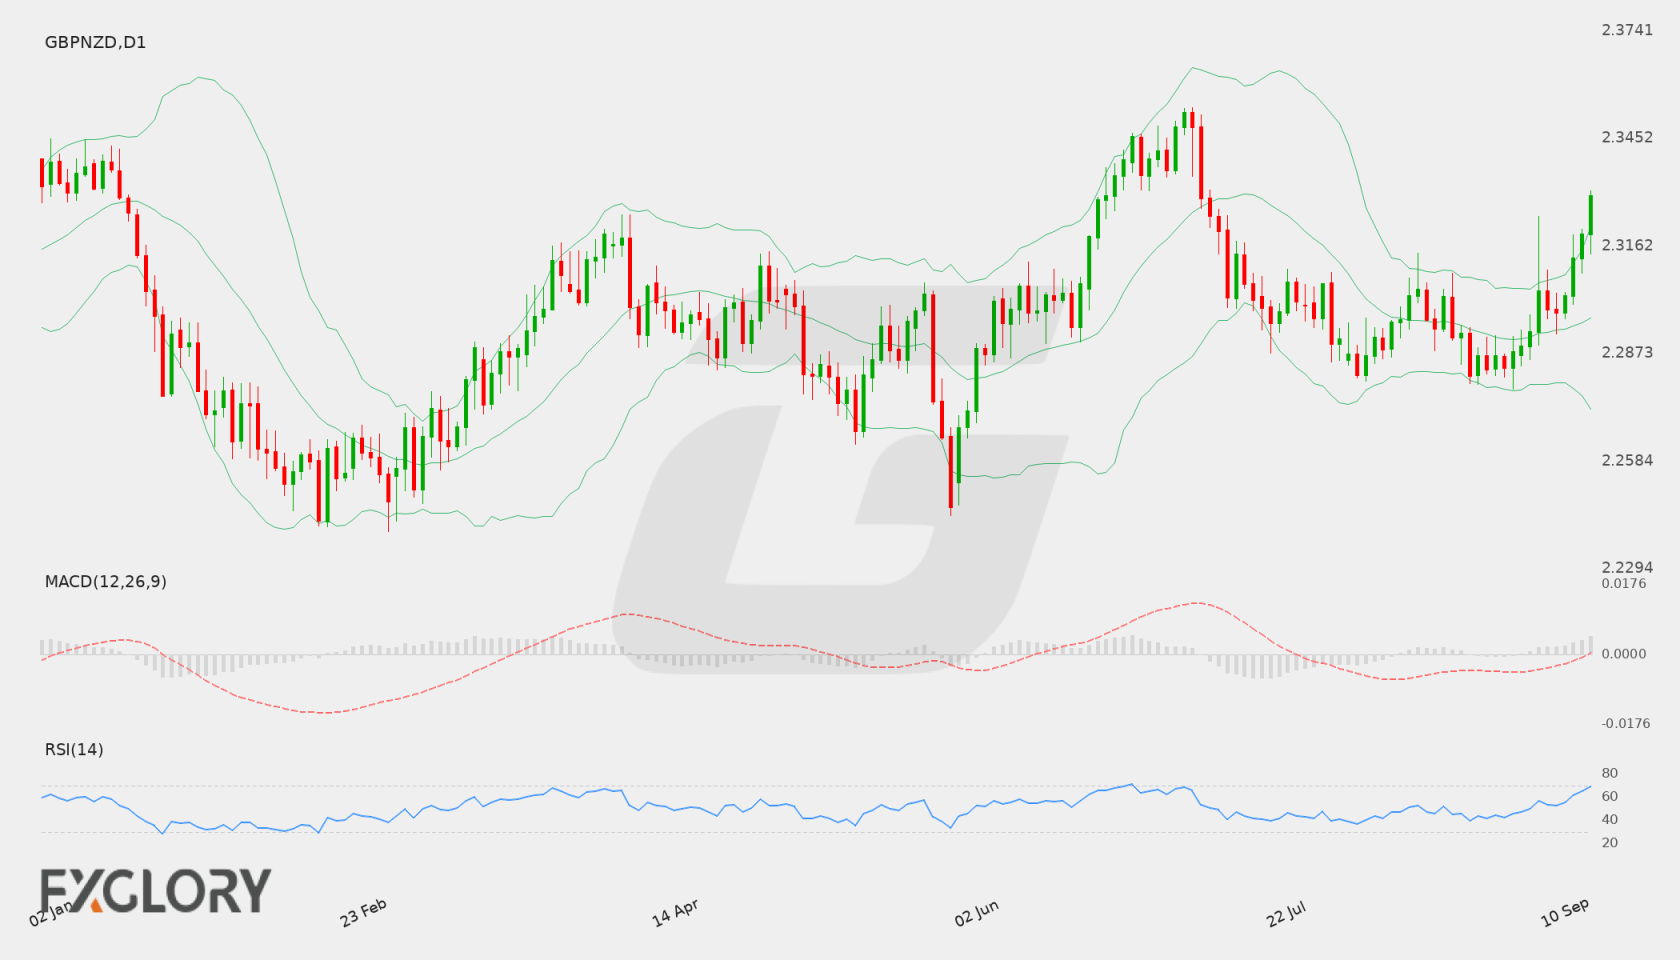
On the daily D1 chart, GBP/NZD closed at 2.29911 after a recent rebound from lower support areas. The recent price action indicates consolidation, as candles trade near the center of the recent range while testing intermediate moving averages and volatility bands.
Key Technical Indicators:
Bollinger Bands: The D1 Bollinger Bands indicate a middle band at 2.29301, with the upper band at 2.30702 and the lower band at 2.27900. Trading at 2.29911 positions GBP/NZD slightly above the middle band, reflecting a mild upward bias within the current volatility envelope.
RSI: The 14-day Relative Strength Index (RSI) is currently at 52.995. This places the pair in neutral territory, indicating balanced market sentiment without immediate overbought or oversold pressure.
MACD: The MACD indicator on the daily chart stands at -0.00160. This reading below the zero line shows weak bearish sentiment, though the narrowing gap suggests potential stabilization if buying interest persists.
Support and Resistance:
Key technical support for GBP/NZD is located around 2.27772, with additional lower boundary support near 2.27900. Overhead resistance is established at 2.35338, while the upper Bollinger Band near 2.30702 serves as a nearer-term upside target.
News to Watch for GBPNZD This Week:
GDP m/m: Monthly economic growth data provides insight into national output trends and potential monetary policy shifts.
Weekly Outlook and Consideration:
The GBP/NZD pair approaches the upcoming week hovering near 2.29911, positioned just above its daily middle Bollinger Band of 2.29301. With a neutral RSI of 52.995 and a slightly negative MACD of -0.00160, price action could continue consolidating within established boundaries. A sustained move higher may test resistance at 2.35338, whereas a reversal lower could bring support at 2.27772 back into focus.
Disclaimer: The analysis provided for GBP/NZD is for informational purposes only and does not constitute investment advice. Traders are encouraged to perform their own analysis and research before making any trading decisions. Market conditions can change quickly, so staying informed with the latest data is essential.