Current weekly forecast: This outlook covers 11–17 October 2026 and remains valid until 17 October 2026, unless its stated invalidation condition is triggered earlier.
In brief
The weekly bias is bullish on the D1 trend and positive momentum, but mixed closes and neutral H4 conditions leave confirmation incomplete.
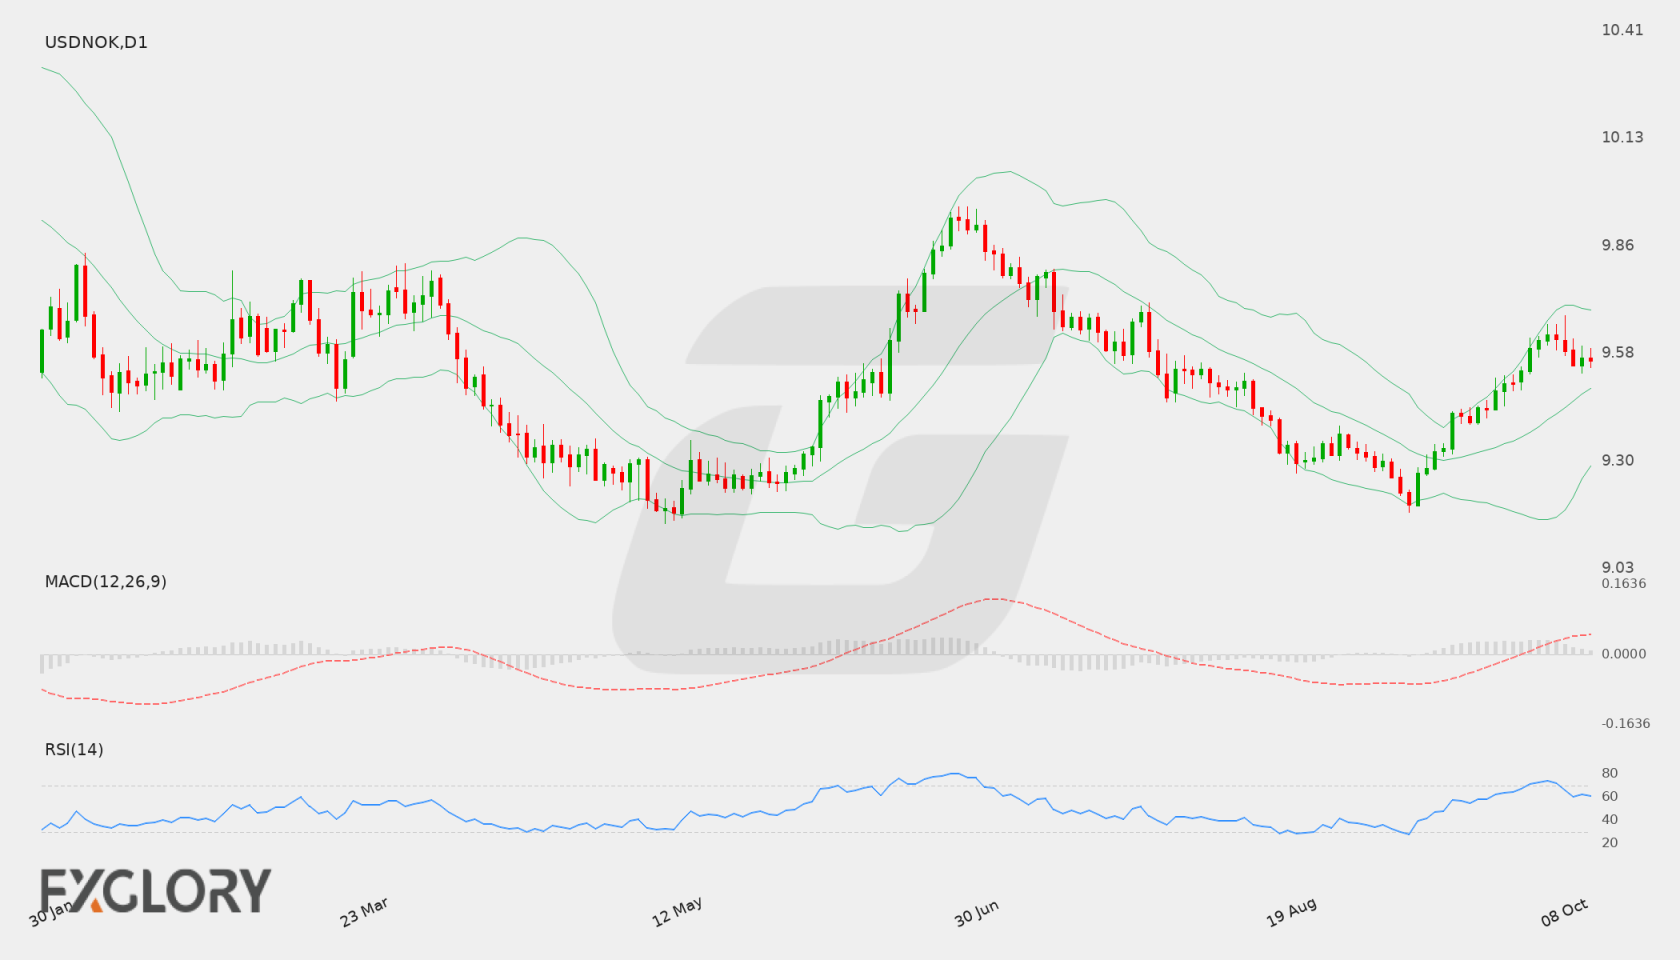
USD/NOK closed at 9.5612, above the selected primary support at 9.52918 and below primary resistance at 9.65481. The D1 trend is bullish and momentum is positive, with price above the EMA20, EMA50 and SMA200. However, the mixed close sequence and falling SMA200 slope temper the structural picture rather than establishing uninterrupted follow-through.
H4 is neutral: its RSI is below 50, MACD remains negative despite a slightly positive histogram, and the close is near its middle Bollinger band and below its EMA20. This is tactical hesitation, not a reversal of the D1 thesis. Stable volatility describes the current trading environment without resolving direction; the scheduled Treasury Currency Report may add event risk, but no outcome is supplied.
USD/NOK D1 technical-analysis context for the weekly forecast. Chart data captured 11 October 2026.
USD/NOK reflects broader economic sentiment and policy divergence as market participants assess incoming US macroeconomic indicators and shifting risk dynamics. While macroeconomic developments and central bank communications continue to shape currency trends, the pair remains sensitive to high-impact data and global growth sentiment.
Price Action:
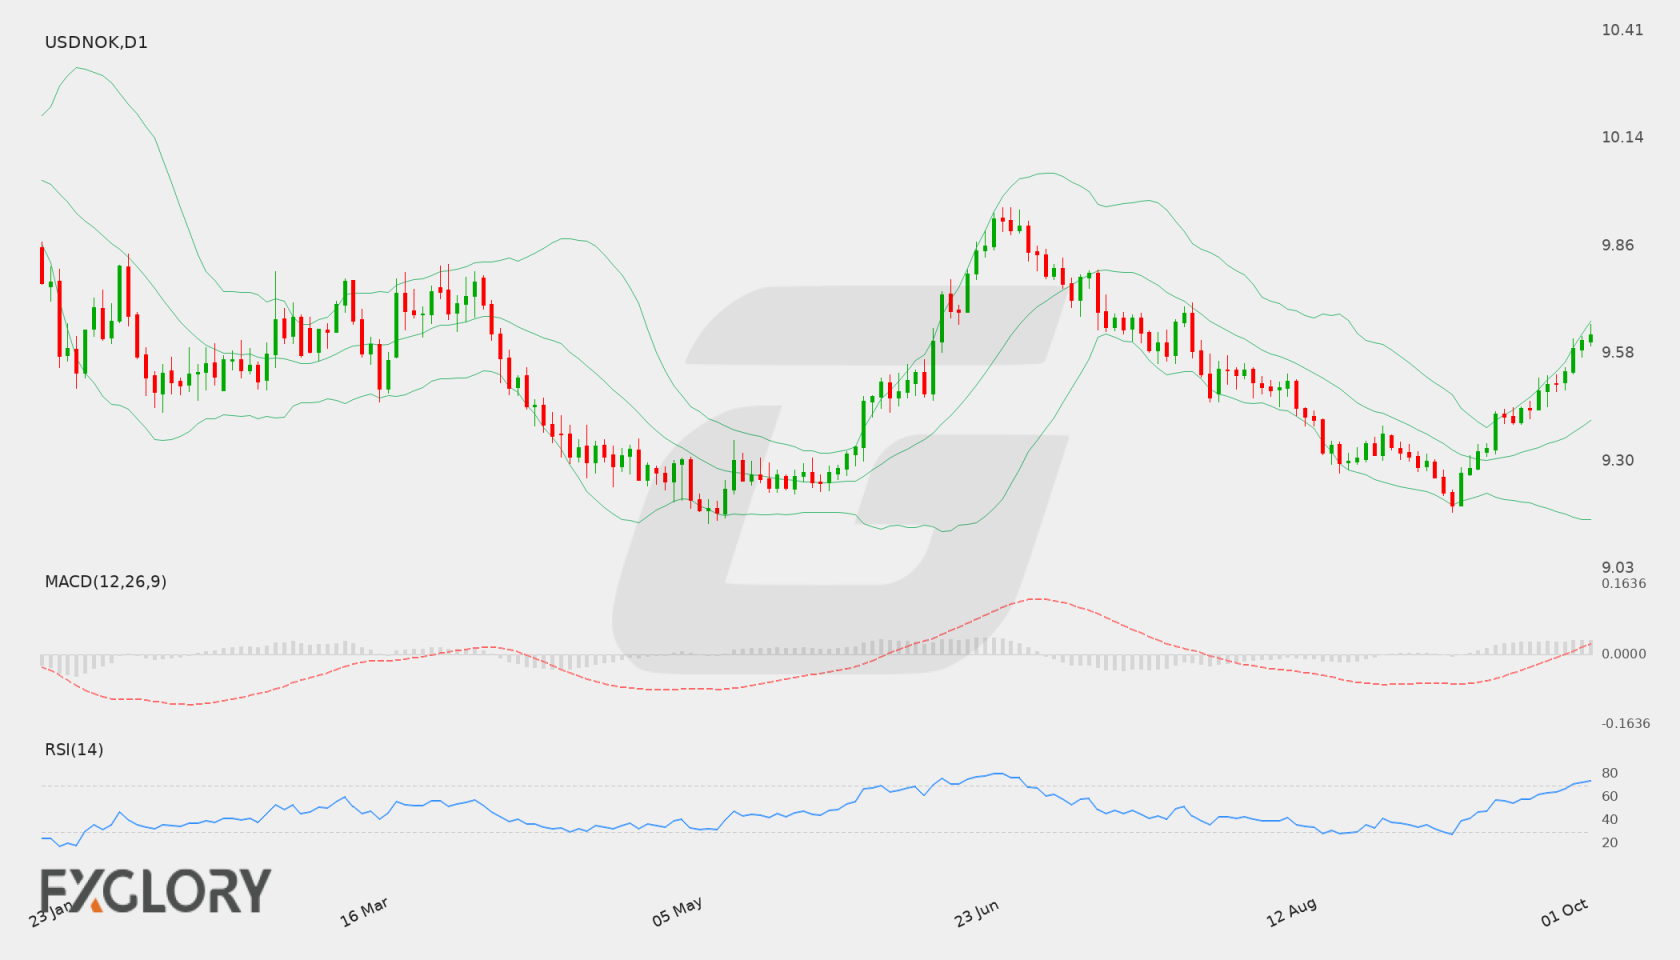
On the daily timeframe, USD/NOK has demonstrated steady bullish momentum after lifting off recent lows, advancing through a series of higher closes to settle at 9.62813. The sequence of consecutive green sessions highlights persistent upward pressure, though price action is now testing elevated regions where upside momentum could encounter friction.
Key Technical Indicators:
Bollinger Bands: The daily Bollinger Bands are configured with the middle band at 9.40867, the lower band at 9.15262, and the upper band at 9.66472. With USD/NOK closing at 9.62813, the market is trading well above the baseline and pressing near the upper boundary, indicating an expansion of upside volatility.
RSI: The 14-day Relative Strength Index (RSI) stands at 73.55, positioning the oscillator inside overbought territory above the 70 benchmark. While this confirms strong buying pressure, it also warns of an elevated risk of near-term consolidation or corrective pullbacks.
MACD: The daily MACD prints at 0.05628, holding in positive territory above the zero line. This positive value reflects underlying bullish momentum, aligning with the recent upward trajectory observed in daily price action.
Support and Resistance:
Supplied daily chart levels place key technical resistance at 9.79643, which serves as the next hurdle for upside continuation. On the downside, primary technical support is established at 9.17133.
News to Watch for USDNOK This Week:
ISM Services PMI: Reflects operational health in the services industry and can significantly alter US dollar sentiment.
FOMC Meeting Minutes: Provides detailed perspective on monetary policy deliberations and expectations for interest rates.
Unemployment Claims: Delivers weekly data on labor market resilience that can impact currency strength.
Prelim UoM Inflation Expectations: Gauges consumer projections for future price growth and influences monetary policy expectations.
Prelim UoM Consumer Sentiment: Offers insight into consumer confidence and broader domestic economic activity.
Weekly Outlook and Consideration:
USD/NOK approaches the week with a strong bullish technical tone, evidenced by the daily close at 9.62813 and a positive MACD of 0.05628. However, with the RSI at 73.55 signaling overbought conditions and price hovering near the upper Bollinger Band at 9.66472, market participants may monitor for signs of exhaustion or consolidation below the 9.79643 resistance mark. A retracement could see price testing intermediate moving averages toward the middle band at 9.40867, with major technical support remaining at 9.17133. Upcoming high-impact US economic events will serve as crucial drivers for directional follow-through.
Disclaimer: The analysis provided for USD/NOK is for informational purposes only and does not constitute investment advice. Traders are encouraged to perform their own analysis and research before making any trading decisions. Market conditions can change quickly, so staying informed with the latest data is essential.
The USD/NOK currency pair is navigating a crucial economic backdrop shaped by upcoming high-impact economic releases. Currently trading near the 9.41857 level, the instrument’s trajectory remains sensitive to monetary policy expectations, US growth data, and inflation indicators. Market participants will closely evaluate economic signals to gauge momentum across USD/NOK trading sessions.
Price Action:
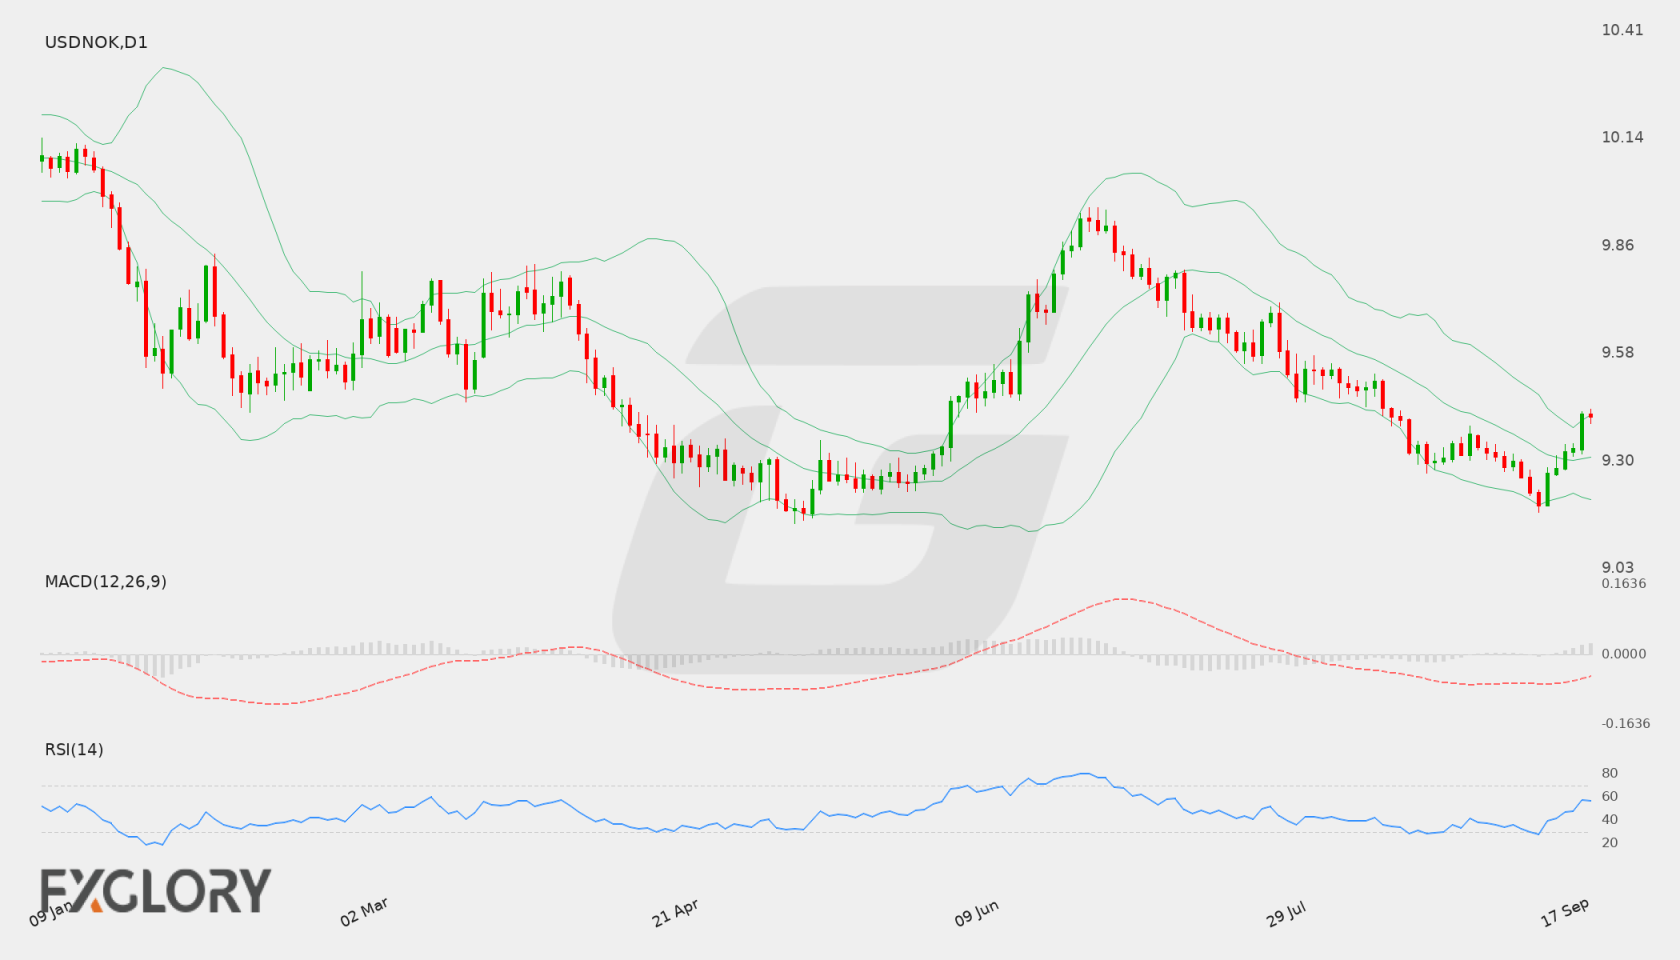
On the daily (D1) chart, USD/NOK recently closed at 9.41857 following a notable upward move from recent session lows near 9.18994. The recent candlestick patterns demonstrate strong short-term bullish momentum, bringing the exchange rate close to the top of its recent range.
Key Technical Indicators:
Bollinger Bands: The Bollinger Bands on the D1 chart show the middle band at 9.31266, the lower band at 9.20303, and the upper band at 9.42229. USD/NOK is currently trading near the upper Bollinger Band level of 9.42229, reflecting strong upward volatility in recent daily trading sessions.
RSI: The 14-day Relative Strength Index (RSI) for USD/NOK is positioned at 56.32. This reading places the indicator in neutral territory above the 50 midpoint, indicating moderate bullish strength without reaching overbought territory.
MACD: The MACD indicator for USD/NOK stands at -0.02562. While the MACD histogram remains in negative territory, the recent bounce in price action indicates potential convergence towards the zero line as downward momentum declines.
Support and Resistance:
Technical chart analysis highlights main daily support for USD/NOK at 9.17133 and major resistance at 9.95824. In the short term, the middle Bollinger Band at 9.31266 acts as dynamic support, while the upper Bollinger Band at 9.42229 serves as immediate dynamic resistance.
News to Watch for USDNOK This Week:
CB Consumer Confidence: Measures consumer optimism regarding economic activity which can influence market sentiment.
JOLTS Job Openings: Indicates overall labor market demand and tightness.
ADP Non-Farm Employment Change: Serves as an early estimate of private-sector employment growth.
Core PCE Price Index m/m: Key inflation metric that guides monetary policy outlooks.
Final GDP q/q: Reflects annualized economic growth and health.
ISM Manufacturing PMI: Measures manufacturing sector activity and expansion signals.
Average Hourly Earnings m/m: Tracks wage gains which impact inflationary pressures.
Non-Farm Employment Change: Major employment report that often creates substantial market volatility.
Unemployment Rate: Highlights the overall health of the labor market.
Weekly Outlook and Consideration:
The weekly technical outlook for USD/NOK suggests a strong short-term recovery as price tests the upper Bollinger Band near 9.42229. With an RSI of 56.32 reflecting mild bullish momentum, holding above the middle Bollinger Band at 9.31266 could keep price action inclined toward higher resistance levels, including 9.95824. Conversely, rejection near upper resistance could see the pair move back toward key support at 9.17133.
Disclaimer: The analysis provided for USD/NOK is for informational purposes only and does not constitute investment advice. Traders are encouraged to perform their own analysis and research before making any trading decisions. Market conditions can change quickly, so staying informed with the latest data is essential.
The USD/NOK pair reflects broader risk sentiment and expectations surrounding US monetary policy alongside domestic economic conditions. Market participants are focusing on upcoming economic indicators from the United States, including interest rate decisions and consumer spending data, which may influence demand for the greenback against the Norwegian krone.
Price Action:
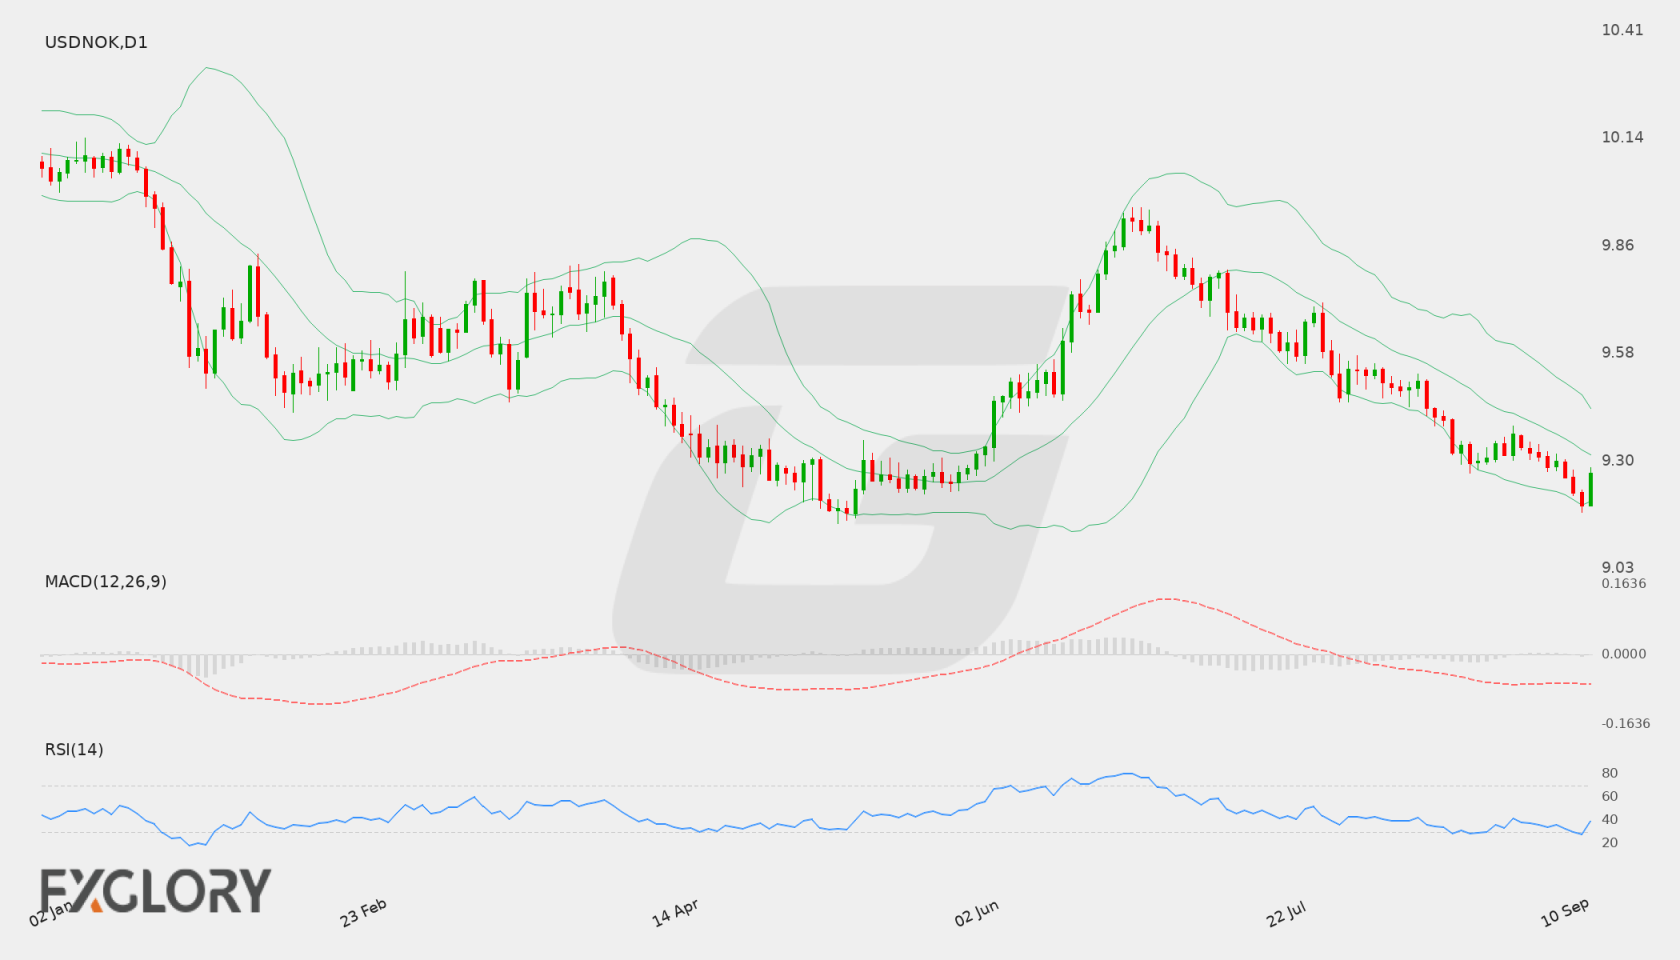
On the daily chart, USD/NOK has experienced sustained downside movement, sliding toward recent lower boundaries before recovering slightly to close at 9.27063. The recent price action shows a bounce off support near 9.17133, suggesting potential short-term consolidation within a broader bearish trend.
Key Technical Indicators:
Bollinger Bands: The daily Bollinger Bands feature a middle band at 9.32004, an upper band at 9.43979, and a lower band at 9.20029. Closing at 9.27063, USD/NOK trades below the middle band and near the lower envelope, highlighting prevailing downward momentum across recent sessions.
RSI: The 14-day Relative Strength Index (RSI) is currently at 39.63. This places the indicator in bearish territory below the 50 mark, while remaining above oversold thresholds to allow room for two-sided price movements.
MACD: The MACD indicator stands at -0.07048, holding below the zero line. This negative value reflects ongoing bearish momentum on the daily timeframe, though traders will monitor momentum for signs of potential stabilization.
Support and Resistance:
Key technical support for USD/NOK is established around 9.17133, which aligns with recent low boundaries. On the upside, main resistance sits at 9.95824, with intermediate resistance near the daily middle Bollinger Band at 9.32004.
News to Watch for USDNOK This Week:
Core Retail Sales m/m: This release offers insight into consumer spending momentum that can influence US dollar strength.
Retail Sales m/m: Consumer spending updates reflect broader economic vitality and potential shifts in monetary policy expectations.
FOMC Economic Projections: Updated forecasts provide official insights regarding future interest rates and economic trajectory.
FOMC Statement: The statement details the central bank's monetary stance and economic assessment.
Federal Funds Rate: The interest rate decision directly impacts benchmark borrowing costs and foreign exchange valuations.
FOMC Press Conference: Official commentary during the conference offers key context regarding future monetary policy direction.
Unemployment Claims: Weekly jobless claims data provides fresh indicators regarding labor market health and economic resilience.
Weekly Outlook and Consideration:
The weekly outlook for USD/NOK indicates potential for ongoing volatility driven by high-impact macroeconomic events and daily technical conditions. Bearish indicators, such as the MACD reading of -0.07048 and RSI at 39.63, maintain downside pressure, yet the close near the lower Bollinger Band suggests possible consolidation around current levels. A move above the 9.32004 middle band could open the door toward higher resistance levels, while a break below 9.17133 support could signal continuation of the downward trend.
Disclaimer: The analysis provided for USD/NOK is for informational purposes only and does not constitute investment advice. Traders are encouraged to perform their own analysis and research before making any trading decisions. Market conditions can change quickly, so staying informed with the latest data is essential.
The USD/NOK currency pair continues to reflect shifts in international rate expectations and broader market risk sentiment. Upcoming economic releases from the US regarding consumer and producer prices are poised to drive volatility across dollar-denominated pairs, influencing interest rate outlooks. Meanwhile, the Norwegian Krone remains sensitive to global trade dynamics and energy market sentiment, keeping trader focus on key macroeconomic releases.
Price Action:
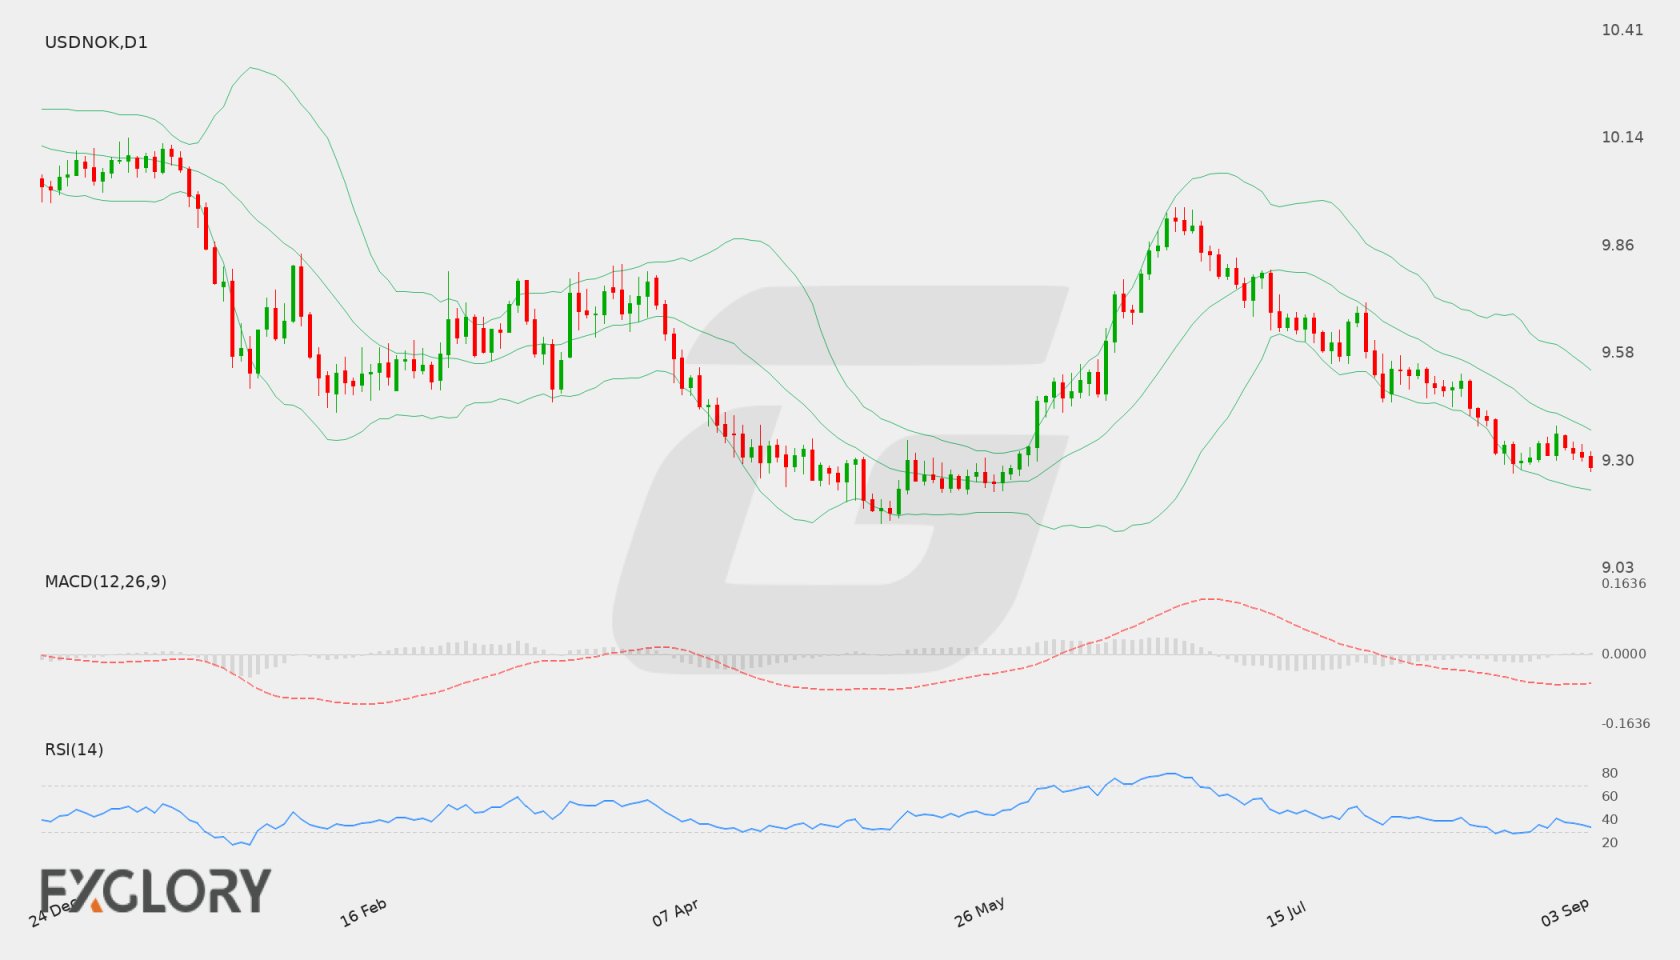
On the Daily (D1) chart, USD/NOK has experienced sustained downside pressure, dragging the pair down to a recent close of 9.28747. Price action shows a clear sequence of lower highs and lower lows over recent sessions, approaching key structural floors as sellers remain in control.
Key Technical Indicators:
Bollinger Bands: The Bollinger Bands indicator on the daily chart reflects active downward momentum. The middle band sits at 9.38225, with the upper band at 9.53713 and the lower band at 9.22737. Price action trading near 9.28747 remains positioned in the lower half of the band structure, signaling persistent bearish influence.
RSI: The 14-period Relative Strength Index (RSI) stands at 33.72, placing the indicator close to oversold conditions. While this underscores current selling pressure, it also hints that downside momentum could face deceleration near critical support levels.
MACD: The MACD indicator displays a negative reading of -0.06700 on the daily timeframe. The indicator remains beneath its zero threshold, confirming ongoing downside momentum and a lack of immediate bullish divergence.
Support and Resistance:
Key technical levels for USD/NOK on the daily chart show primary support at 9.27156. On the upside, major resistance is identified at 9.95824, serving as a key barrier should recovery attempts emerge.
News to Watch for USDNOK This Week:
PPI m/m: Measures changes in producer prices to gauge underlying pipeline inflation pressures.
Core PPI m/m: Evaluates producer inflation excluding volatile components for clearer policy signals.
Unemployment Claims: Provides weekly insights into labor market conditions and economic stability.
Core CPI m/m: Tracks monthly changes in core consumer prices to assess underlying inflation.
USD/NOK enters the week with a bearish daily posture, closing near 9.28747. Technical indicators show MACD at -0.06700 and RSI at 33.72, reflecting strong downside pressure near the lower Bollinger Band at 9.22737. Traders will be monitoring whether support at 9.27156 holds, or if key US inflation releases trigger a push toward upper resistance at 9.95824.
Disclaimer: The analysis provided for USD/NOK is for informational purposes only and does not constitute investment advice. Traders are encouraged to perform their own analysis and research before making any trading decisions. Market conditions can change quickly, so staying informed with the latest data is essential.