USD/SEK Forecast — 3 October 2026
Time Zone: GMT +3
Time Frame: Daily (D1) / Weekly Outlook
Weekly Fundamental Overview:
USD/SEK (USDSEK) heads into the trading week influenced by upcoming macroeconomic releases and overall risk sentiment. Crucial US economic data points, including services sector activity, the FOMC Meeting Minutes, and consumer sentiment surveys, will serve as primary catalysts for currency movement. With broader market volatility and monetary policy expectations guiding the pair, investors will monitor whether high-impact data can sustain the recent momentum against the Swedish Krona.
Price Action:
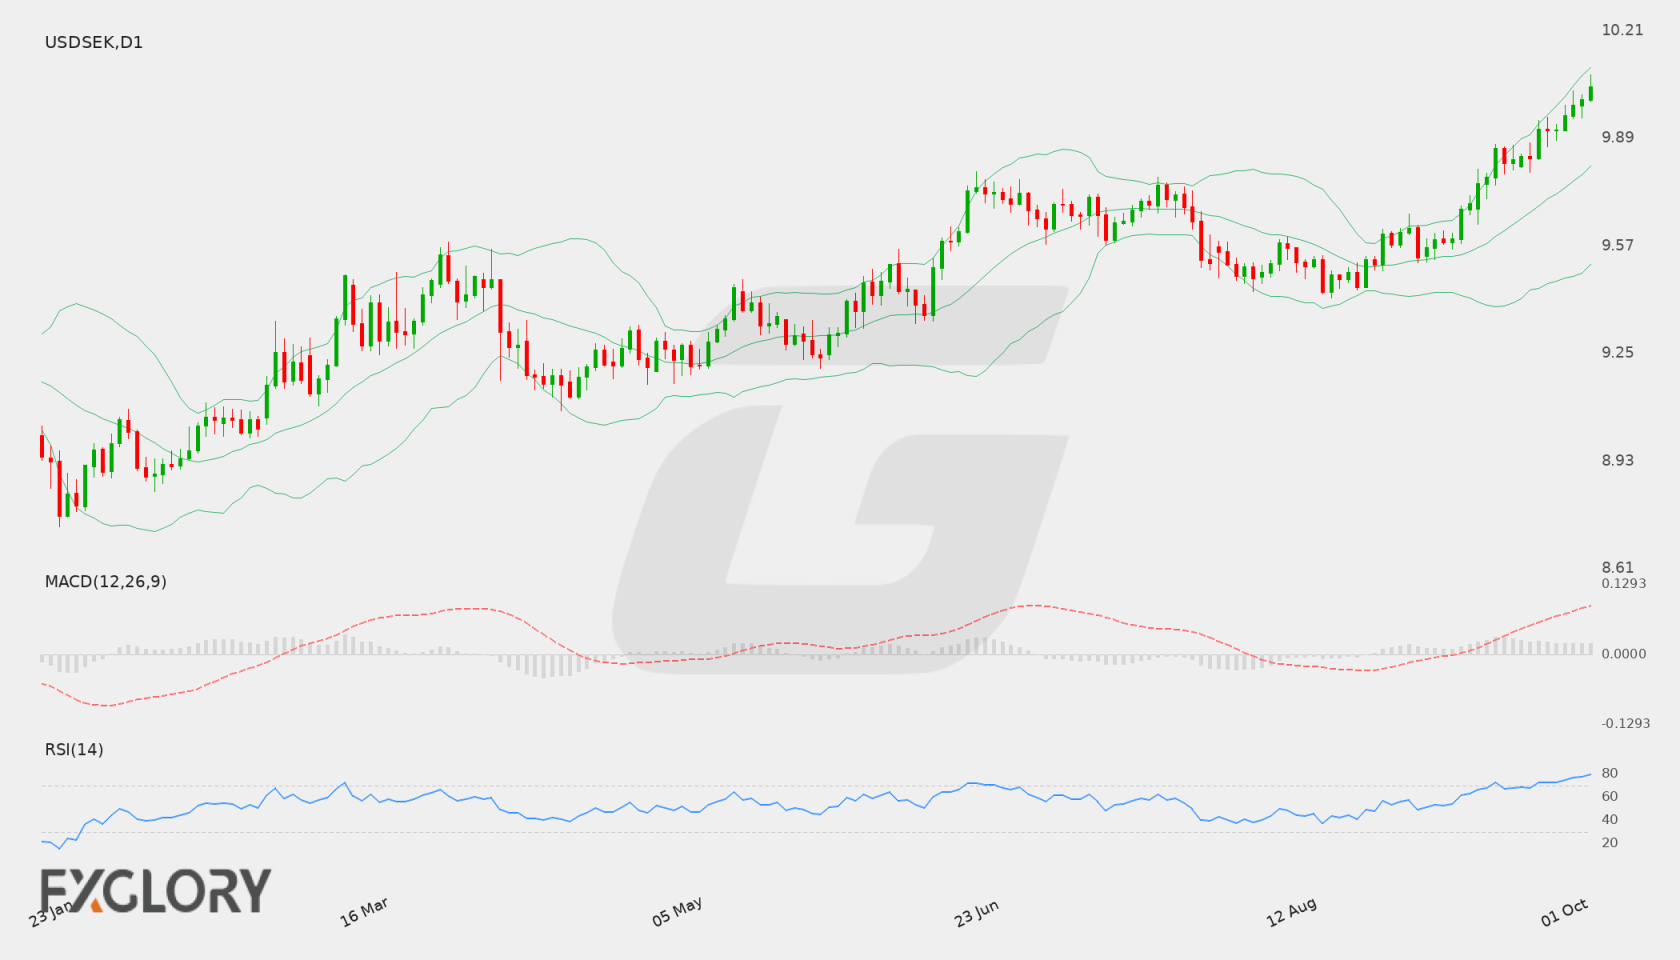
On the daily timeframe, USD/SEK has maintained a pronounced upward trajectory, advancing steadily from the 9.4700 zone toward recent peaks. The pair posted a latest daily close at 10.04075, having reached an intraday high of 10.07579. Consistent higher closes over recent sessions reflect persistent buying pressure, although the latest candle encountered resistance near the 10.07579 peak before settling lower.
Key Technical Indicators:
Bollinger Bands: The Daily Bollinger Bands show the baseline middle band positioned at 9.80520, with the upper band at 10.09718 and the lower band at 9.51322. USD/SEK closed at 10.04075, trading well above the middle band and pressing near the upper volatility threshold, which illustrates strong bullish expansion alongside potential vulnerability to mean reversion.
RSI: The 14-day Relative Strength Index (RSI) stands at 79.13, situating the pair firmly in overbought territory above the standard 70 threshold. While elevated RSI readings confirm intense upward momentum, they also highlight an extended move that warrants caution regarding potential consolidation or technical pullbacks.
MACD: The Moving Average Convergence Divergence (MACD) indicator registers a value of 0.10884 on the daily chart. Maintaining a position above the zero mark, the indicator reflects sustained upside momentum, though traders will observe whether the positive trajectory can be preserved without divergence near resistance.
Support and Resistance:
Daily technical parameters establish key resistance at 10.07579, which coincides with the recent session peak. On the downside, critical technical support rests at 9.41359. Intermediate dynamic support can also be observed near the middle Bollinger Band at 9.80520.
News to Watch for USDSEK This Week:
- ISM Services PMI: This release measures business activity in the predominant services sector and may sway expectations for monetary policy.
- FOMC Meeting Minutes: The detailed summary provides direct insight into policy discussions regarding future interest rate trajectories.
- Unemployment Claims: Weekly jobless claims gauge the strength and resilience of the labor market.
- Prelim UoM Inflation Expectations: This indicator reflects consumer expectations regarding inflation, potentially impacting Federal Reserve policy outlooks.
- Prelim UoM Consumer Sentiment: Consumer confidence figures offer perspective on economic optimism and consumer spending capacity.
Weekly Outlook and Consideration:
The weekly outlook for USD/SEK (USDSEK) remains technically bullish yet overextended. Price action is pressing near the upper Bollinger Band of 10.09718 and testing resistance at 10.07579 following a close at 10.04075. While the positive MACD of 0.10884 confirms strong buying momentum, the daily RSI at 79.13 indicates heavily overbought conditions that could prompt pauses or short-term corrections toward the middle band at 9.80520. Continued momentum above 10.07579 would extend the prevailing trend, whereas failure to breach it may lead to consolidation above the primary support at 9.41359, with upcoming economic events likely driving directional volatility.
Disclaimer: The analysis provided for USD/SEK is for informational purposes only and does not constitute investment advice. Traders are encouraged to perform their own analysis and research before making any trading decisions. Market conditions can change quickly, so staying informed with the latest data is essential.