
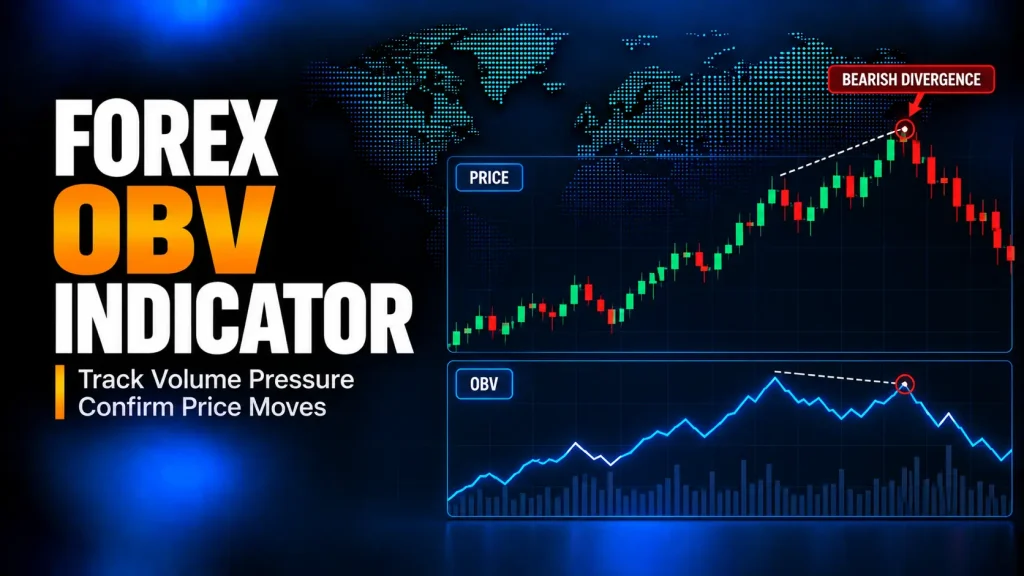
What Is OBV in Forex?
OBV stands for On-Balance Volume. It is a cumulative indicator that adds the available volume on higher closes and subtracts it on lower closes. The resulting line can be compared with price swings, but it does not measure actual net buying or selling orders.
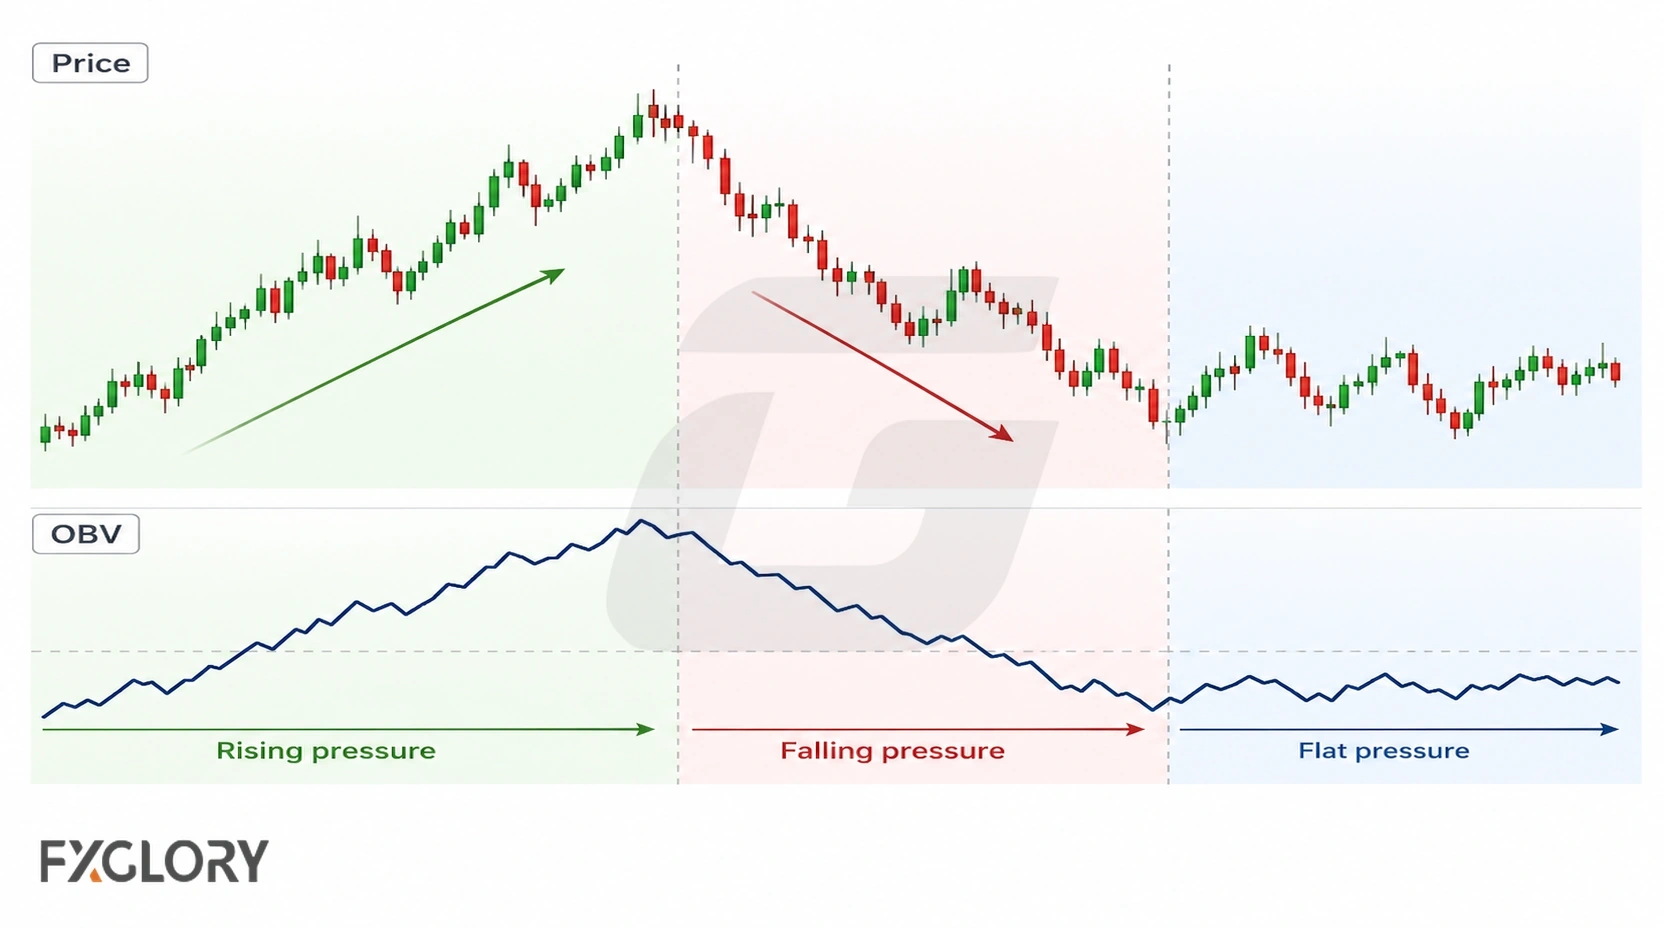
OBV was popularized by Joseph Granville as a cumulative way to compare price closes with volume behavior.
OBV is cumulative and unbounded, unlike the 0–100 MFI and RSI oscillators. Its starting value is arbitrary, so changes in its direction and shape generally matter more than the raw number.
In spot forex, OBV needs extra caution because volume is usually tick volume or platform-specific activity rather than total centralized global forex volume.
For chart context around OBV pressure changes, review market structure context.
How On-Balance Volume Works
OBV moves by adding or subtracting available volume based on the closing direction of price. If price closes higher than the previous period, the current period's available volume is added to OBV. If price closes lower, the current period's available volume is subtracted. If price closes unchanged, OBV stays unchanged.
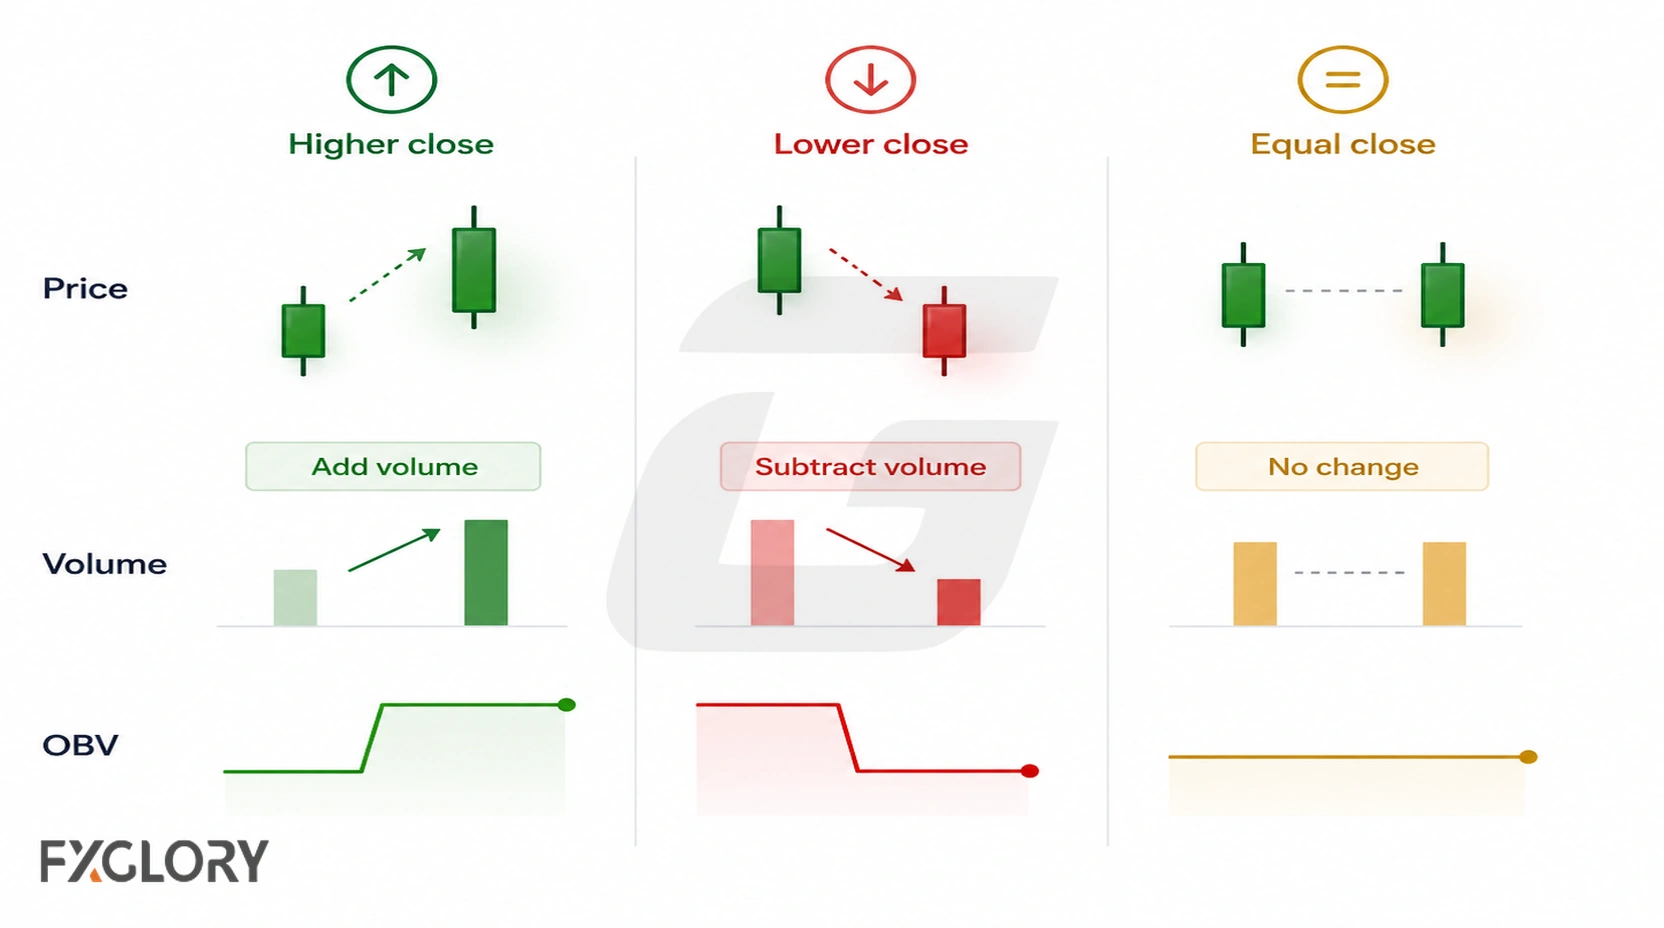
This assigns the entire period’s available volume a positive or negative sign based solely on the close-to-close change. OBV does not separate buyer-initiated from seller-initiated transactions, and a small price change can add or subtract a large volume reading.
- Rising OBV: Available volume pressure may be building with upward closes, but price direction still needs confirmation.
- Falling OBV: Available volume pressure may be building with downward closes, but this does not confirm continuation.
- Flat OBV: Pressure may be unclear, quiet, or range-bound.
- Spiking OBV: One unusual volume period may be distorting the cumulative line.
- Diverging OBV: Price and available volume pressure may no longer be confirming each other.
Why OBV Needs Extra Caution in Forex
OBV needs a volume input. Spot forex has no single centralized market-wide volume feed, so platforms commonly use tick volume (the number of price updates in a period), broker-specific activity, or another proxy. These inputs are not interchangeable with global traded volume.
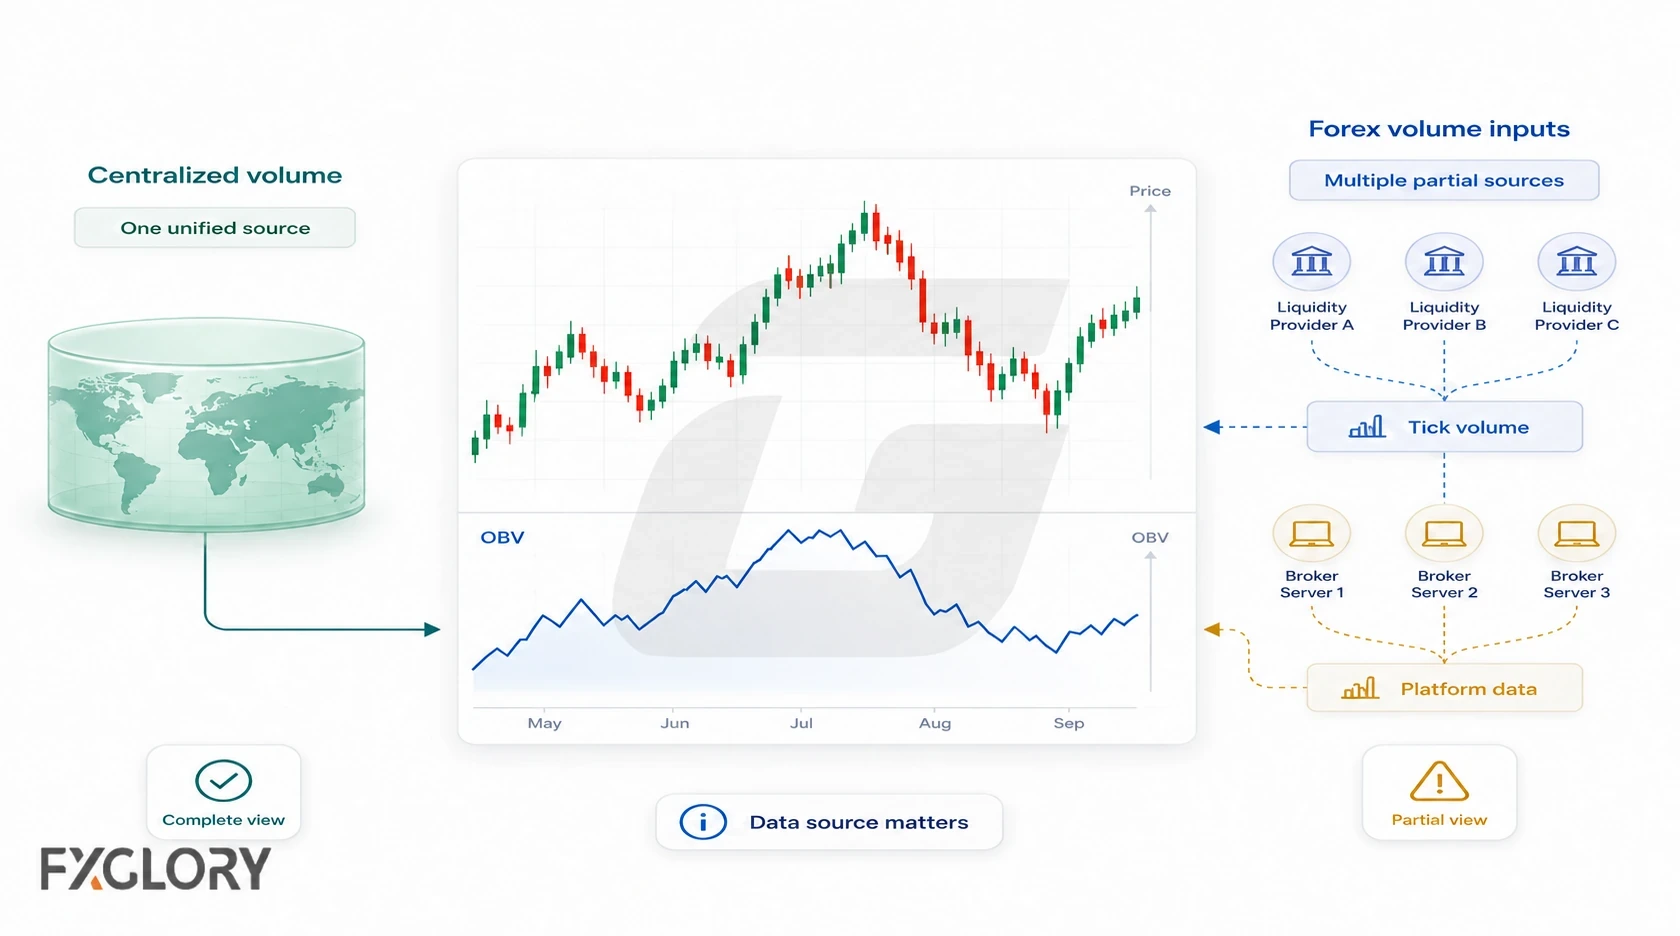
This does not make OBV useless, but it changes how it should be read. A clean OBV movement on one platform may not mean the same thing across every broker, data feed, pair, or timeframe.
- Tick-volume dependency: OBV may be calculated from price-update activity rather than full market-wide transaction size.
- Platform dependency: OBV can vary when the available volume source changes.
- Pair dependency: Quiet pairs and active pairs can create different OBV behavior.
- Timeframe dependency: Lower-timeframe OBV readings can become noisy or unstable.
- News dependency: Event-driven movement can distort volume and pressure readings.
OBV Formula in Plain English
The OBV formula is simple. It classifies each period by the closing price compared with the previous close, then adds, subtracts, or leaves volume unchanged.
| Price close condition | OBV action | Main caution |
|---|---|---|
| Close higher than previous close | Add the current period's available volume to OBV | Does not prove price must continue higher |
| Close lower than previous close | Subtract the current period's available volume from OBV | Does not prove price must continue lower |
| Close equal to previous close | OBV remains unchanged | Does not mean pressure is absent from the broader market |
In symbols: OBV today = OBV yesterday + volume if the close rises; OBV yesterday − volume if it falls; or OBV yesterday if the close is unchanged. An up-close period receives the full available volume regardless of how small the gain was.
OBV Is Cumulative, Not Bounded
OBV is cumulative. That means it keeps adding and subtracting volume over time. Because of that, the raw OBV number depends on the starting point and data source.
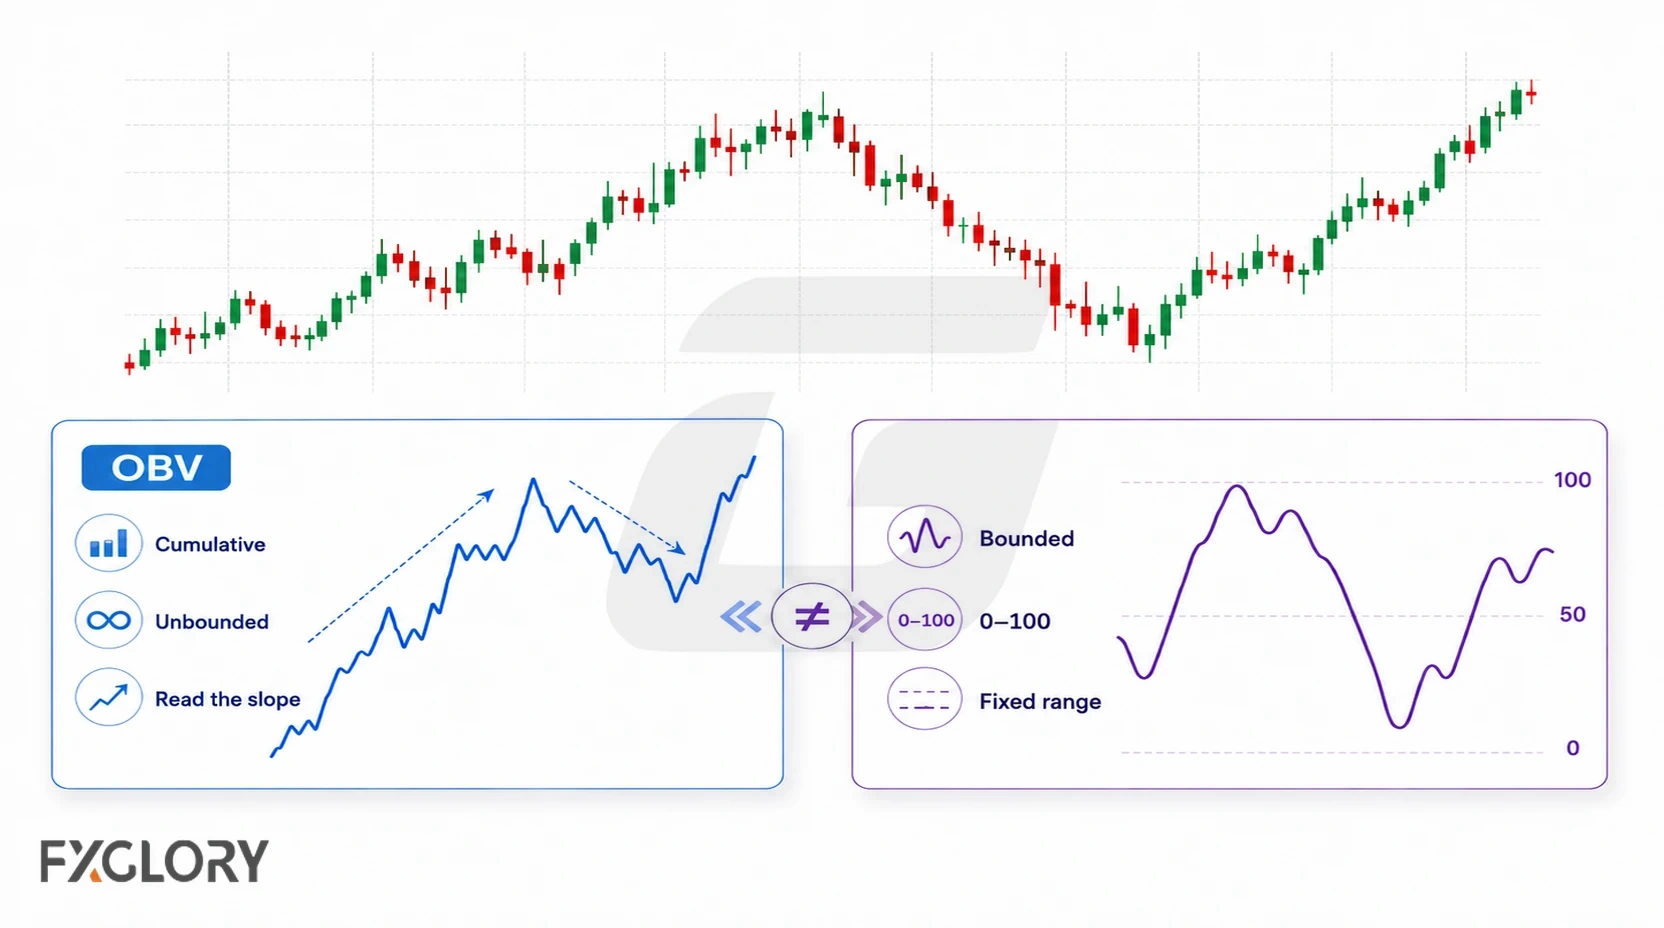
This is why OBV should not be read like RSI or MFI. It does not have a universal high zone, low zone, overbought level, or oversold level. Its behavior matters more than its absolute value.
- Raw OBV value: Usually less useful by itself because it depends on the starting point.
- OBV slope: Can help review whether available pressure is rising, falling, or flattening.
- OBV direction: Can be compared with price direction for agreement or disagreement.
- OBV divergence: Can warn that price and available pressure are no longer aligned.
- OBV spike: Can distort the cumulative line after one unusual volume period.
Common OBV Readings in Forex
OBV readings become more useful when they are compared with price behavior. The question is not whether OBV is high or low. The question is whether OBV and price are confirming, disagreeing, flattening, or reacting abnormally.
| OBV behavior | What it may suggest | What it does not confirm |
|---|---|---|
| OBV rising with price | Available pressure may be supporting upward closes | Does not confirm price must continue higher |
| OBV falling with price | Available pressure may be supporting downward closes | Does not confirm price must continue lower |
| Price rising while OBV falls | Upside movement may lack available pressure confirmation | Does not confirm bearish reversal |
| Price falling while OBV rises | Downside movement may lack available pressure confirmation | Does not confirm bullish reversal |
| OBV flat | Pressure may be unclear, quiet, or range-bound | Does not mean the market is safe or predictable |
| OBV spike | One period may be distorting the line | Does not confirm clean participation or direction |
OBV Divergence in Forex
Divergence compares corresponding price and OBV swing highs or lows: a higher price high paired with a lower OBV high is bearish divergence; a lower price low paired with a higher OBV low is bullish divergence. Swing points should be comparable, not selected arbitrarily.
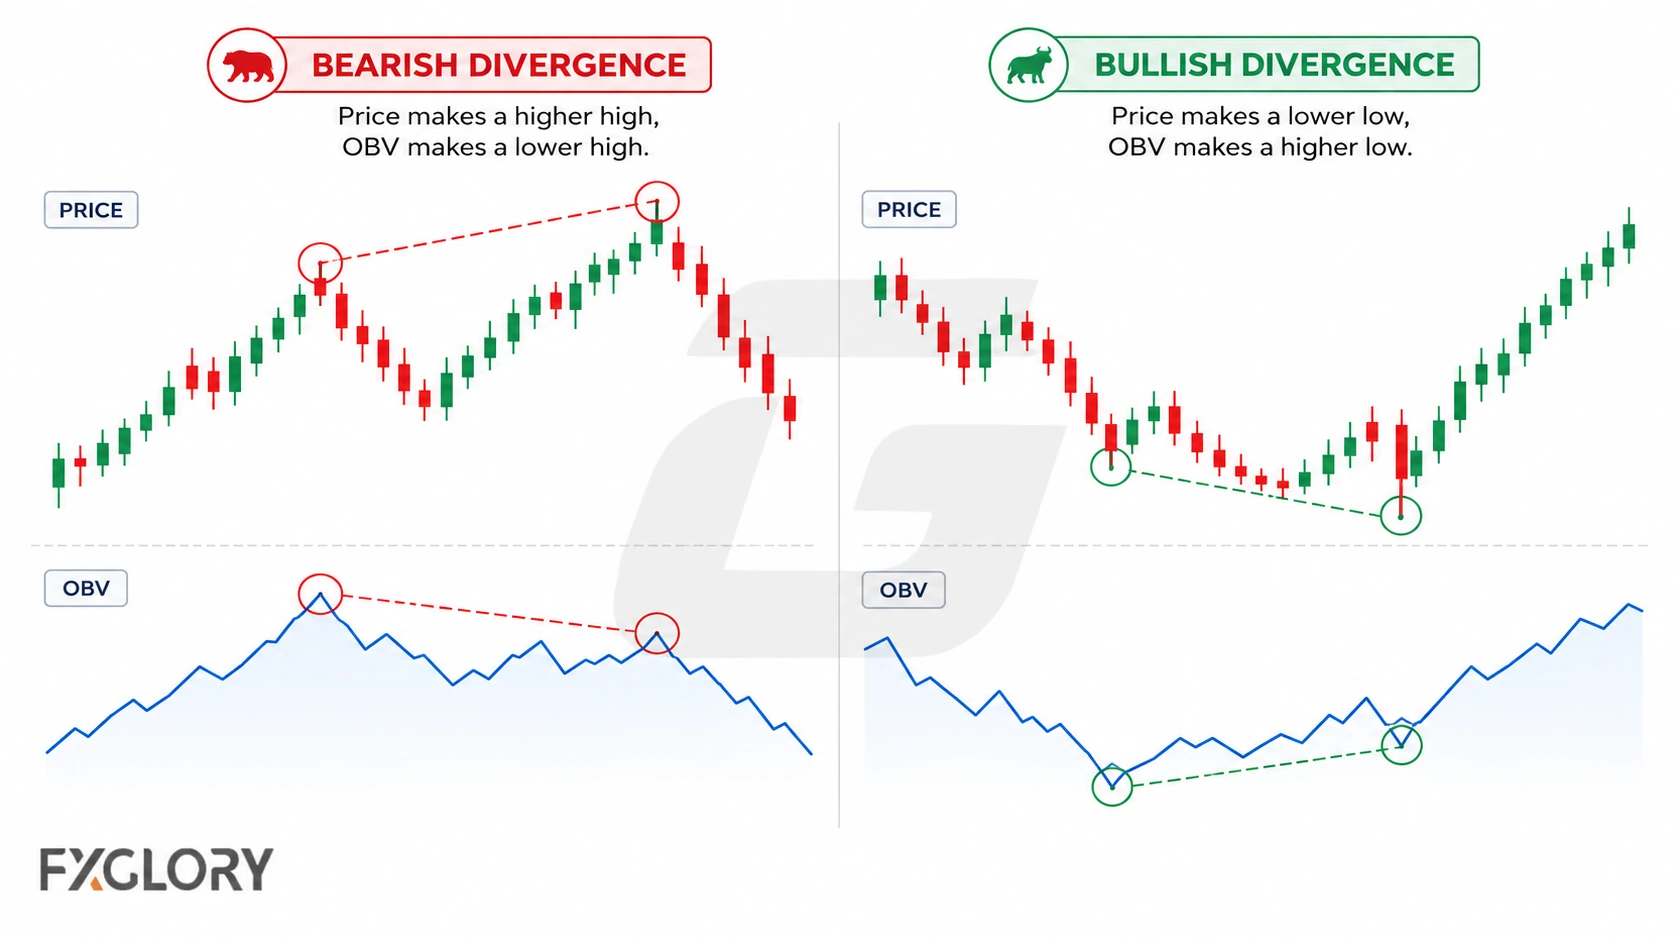
Divergence can warn that available pressure is changing, but it is not reversal confirmation by itself. It needs price location, structure reaction, volatility context, data-source awareness, and invalidation.
- Bullish OBV divergence: Price makes a lower low while OBV makes a higher low. This can warn that downside pressure is weakening.
- Bearish OBV divergence: Price makes a higher high while OBV makes a lower high. This can warn that upside pressure is weakening.
- Weak divergence: Divergence away from support, resistance, or structure can be easier to misuse.
For confirmation beyond OBV disagreement, review market structure context and support and resistance zones.
OBV Trendlines and Breakout Misuse
Some traders draw trendlines on OBV or compare OBV breaks with price breaks. This can help review a pressure-shift question, but it should not be treated as a signal by itself.
OBV can break a trendline before price and still fail. Price can break structure while OBV lags. OBV and price can also disagree during choppy markets or after a volume spike.
- OBV trendline break: May show a pressure shift, but price structure still decides whether the shift matters.
- OBV breakout before price: May be early, noisy, or false.
- Price breakout without OBV support: May create a confirmation question, not an automatic rejection.
- OBV trendline inside chop: Can create repeated false breaks.
OBV and Volume Spikes
Because OBV is cumulative, one abnormal volume period can shift the line sharply. In forex, spikes may come from news, session changes, platform feed behavior, thin liquidity, or sudden volatility.
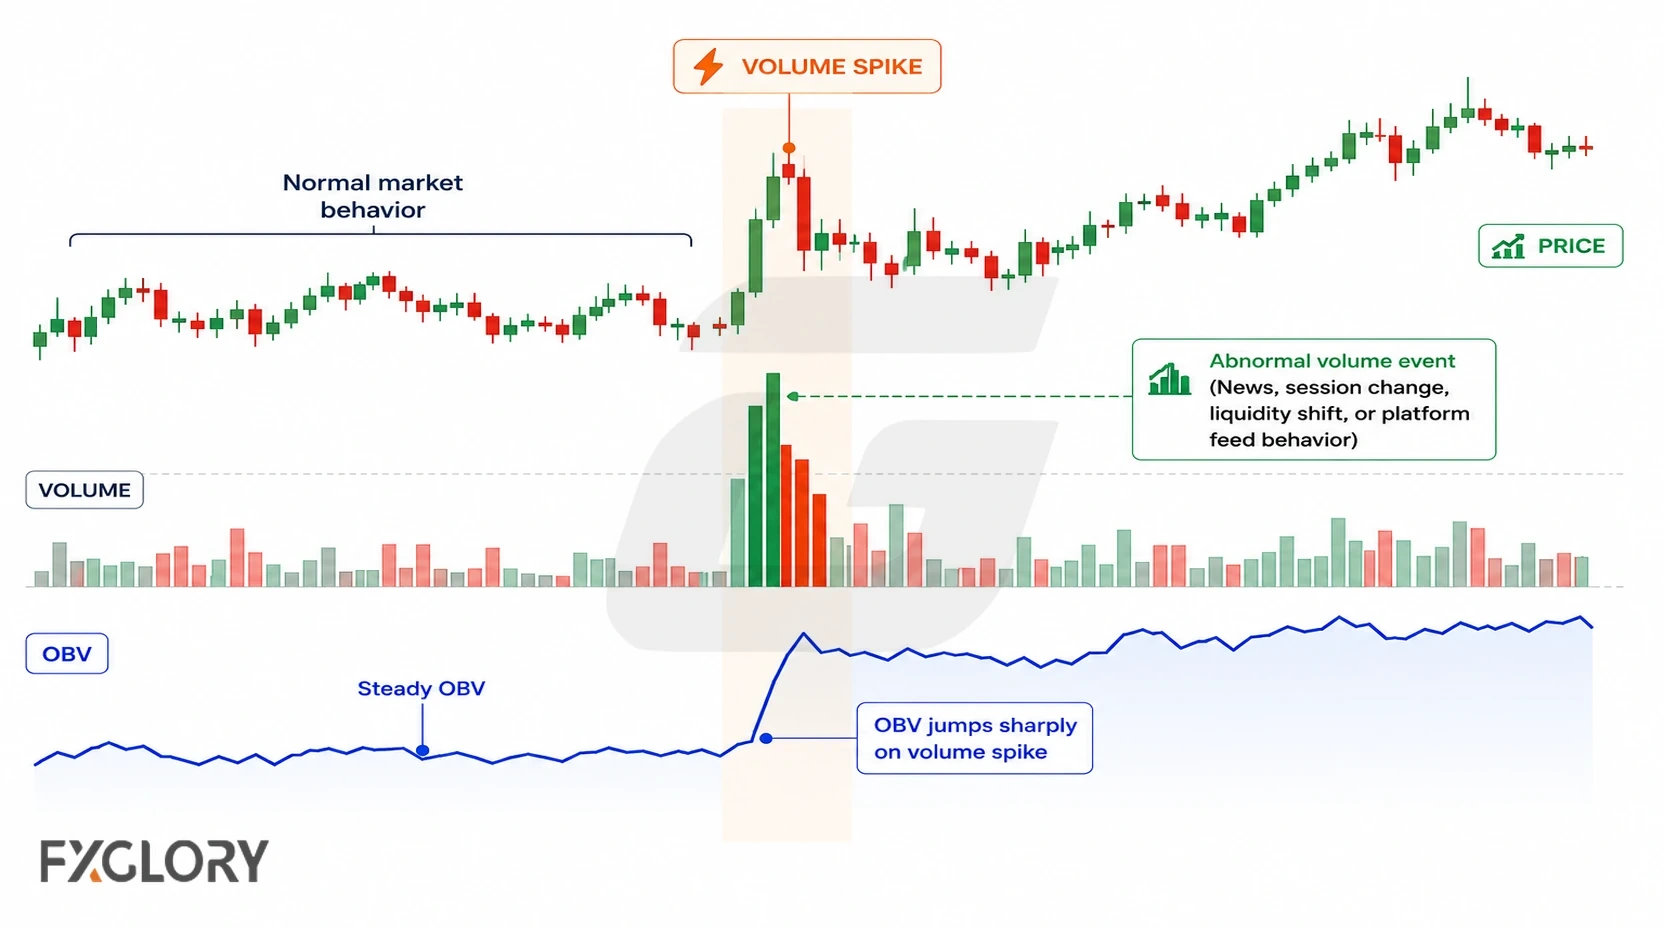
A spike does not automatically confirm a breakout, reversal, or continuation. It only shows that the OBV input changed sharply. The quality of the price reaction still matters.
- News spike: OBV may jump because of event-driven activity rather than clean participation.
- Session spike: OBV may shift around market opens, overlaps, or thin-session transitions.
- Platform spike: OBV may reflect one data source rather than full market-wide activity.
- One-candle distortion: A single abnormal candle can affect the cumulative OBV line.
- Low-liquidity movement: OBV can react sharply when price updates occur in unstable conditions.
OBV in Trending Markets vs Ranging Markets
OBV can behave differently in trends and ranges. In a trend, OBV may broadly move with price. In a range, OBV may flatten, whipsaw, or create disagreements that do not lead to clean movement.
| Market condition | OBV behavior | Main risk |
|---|---|---|
| Quiet range | OBV may flatten or move noisily | Treating small OBV shifts as meaningful pressure |
| Active range | OBV may diverge near range edges | Assuming divergence means immediate reversal |
| Strong uptrend | OBV may rise with price or pause during pullbacks | Calling reversal too early from one OBV disagreement |
| Strong downtrend | OBV may fall with price or pause during pullbacks | Buying too early from one OBV disagreement |
| News volatility | OBV can spike or distort sharply | Confusing event-driven volume with clean pressure |
When OBV behavior conflicts with price structure, review market structure context before trusting the reading.
OBV vs MFI, A/D, VPT, VWAP, and Volume Profile
OBV belongs to the volume-indicator family, but it has a specific job. It is a cumulative volume-pressure line. It should not be confused with bounded oscillators, close-location tools, weighted-average tools, or profile-style tools.
| Tool | Main job | Difference from OBV |
|---|---|---|
| OBV | Cumulative volume-pressure review | Adds or subtracts volume based on close direction |
| MFI | 0–100 price-volume oscillator | Uses typical price and volume/tick volume in a bounded oscillator |
| Accumulation/Distribution | Close-location and volume-flow review | Uses where price closes inside the candle range |
| Volume Price Trend, or VPT | Volume and price-change magnitude review | Includes size of price change rather than close direction alone |
| VWAP | Volume-weighted average price context | Price-location tool, not a cumulative pressure line |
| Volume Profile | Available activity by price area | Distribution-style context, not a rising/falling cumulative line |
For related chart context, use market structure context, support and resistance zones, and price action in forex.
How to Use OBV in Forex Without Treating It as a Signal
Start with the volume data source, then compare OBV behavior with price movement and market condition. The goal is to decide whether OBV clarifies a cumulative pressure question, not to turn a line move, divergence, or trendline break into a trade command.
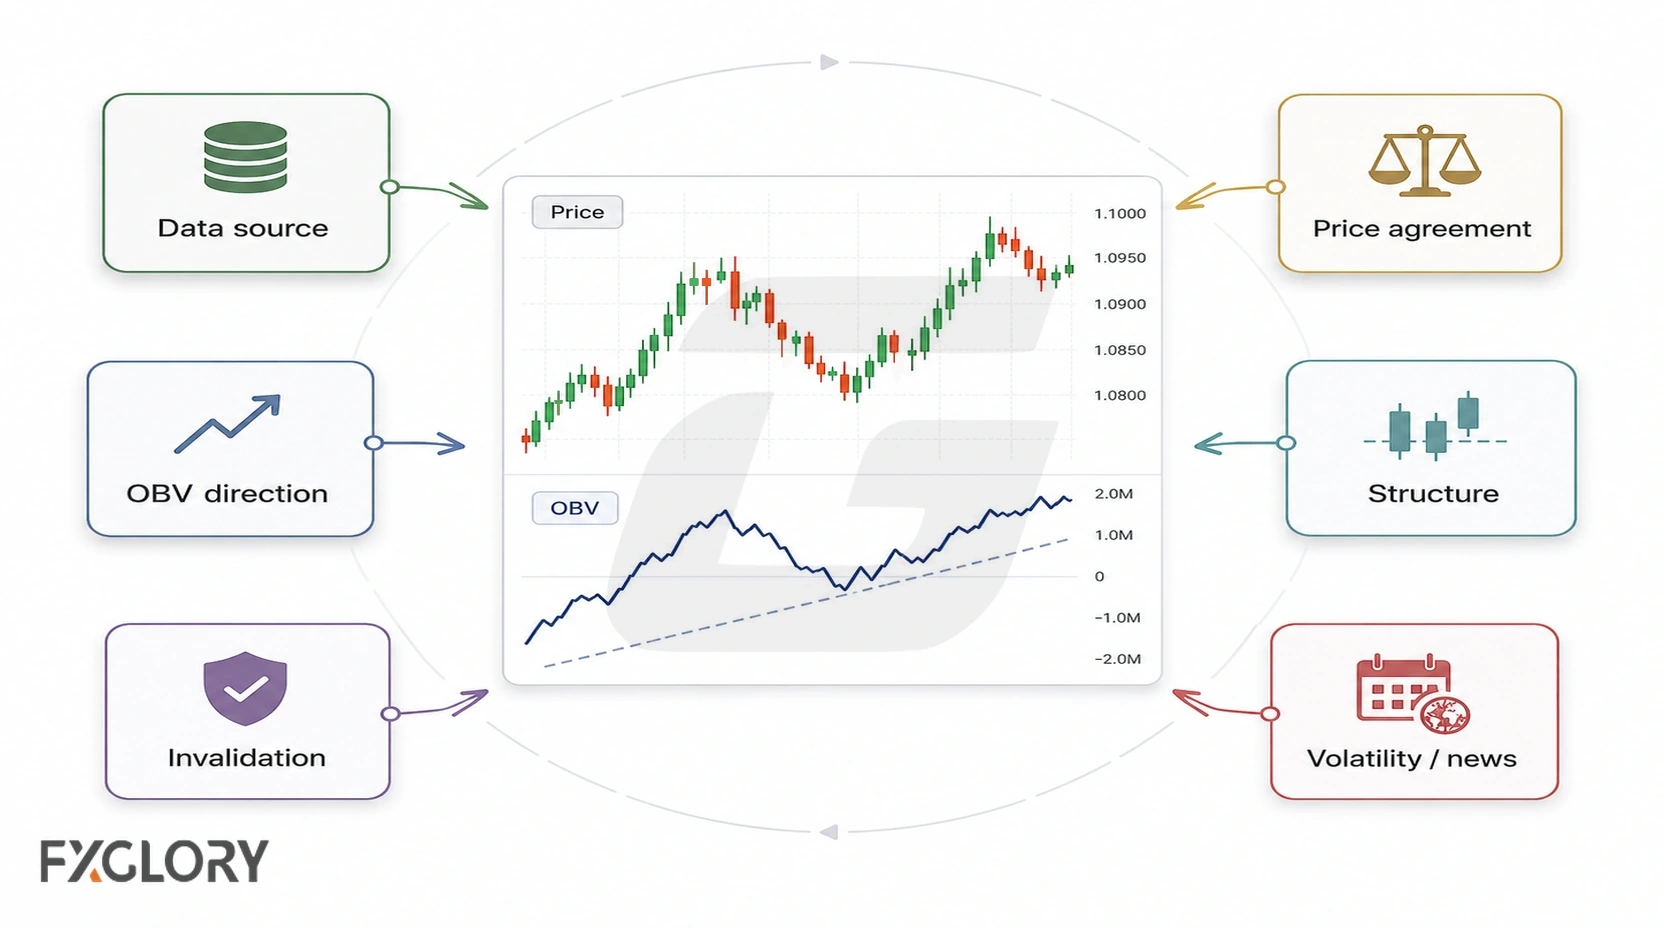
- Identify the data source: Tick volume, broker/platform data, or another available volume input.
- Read OBV direction: Is OBV rising, falling, flat, spiking, or diverging from price?
- Compare with price: Are price and OBV confirming each other or disagreeing?
- Check price structure: Is price trending, ranging, breaking out, rejecting a level, or moving inside chop?
- Check support and resistance: Is the OBV reading appearing near a meaningful price area?
- Check volatility and news: Is the reading affected by spread, session, event risk, or abnormal movement?
- Define invalidation: Know where the OBV-based idea is wrong before using it in a plan.
OBV Chart Scenarios to Practise
These are hypothetical chart-reading exercises, not current market observations or verified trading signals. Apply each question to a chart using a known volume source.
| Scenario | OBV question | Price context to check |
|---|---|---|
| Quiet currency-pair range | Does OBV flatten or whipsaw while price stays inside the range? | Range boundaries and volume-source quality |
| Higher high near resistance | Does OBV fail to make a matching high? | Comparable swings and an actual price rejection |
| Directional breakout | Does OBV move with price or lag? | Level break, retest, follow-through, and invalidation |
| News-driven price spike | Did one period shift the cumulative line sharply? | Event timing, spreads, volatility, and subsequent candles |
Custom OBV Indicator Caution
Some traders use custom OBV dashboards, OBV trendline tools, divergence labels, moving-average overlays, colored OBV signals, or alert-based OBV tools. These can make scanning easier, but the logic should be understandable before it is used.
A custom OBV tool can look clean in old examples and still fail when volume source, market condition, session, spread, or volatility changes.
- Calculation check: Does the tool use standard OBV or a modified formula?
- Data-source check: Does it use tick volume, broker data, platform volume, or another source?
- Alert-timing check: Does the alert appear after candle close, or does it change while the candle is forming?
- Repaint check: Does the indicator change past signals after new data appears?
- Trendline check: Are OBV line breaks being treated as hard breakout rules?
- Divergence check: Does the tool explain how it detects divergence, or does it hide the logic?
OBV False-Signal Filters
Use these filters when the OBV indicator looks active but the chart condition does not support the reading.
| Filter | Problem it catches | What to check |
|---|---|---|
| Tick-volume-source filter | OBV treated as if it uses full centralized forex volume | Data source, platform context, and recent activity history |
| Raw-value filter | OBV number treated as if it has universal meaning | OBV direction, slope, divergence, and starting point |
| Spike-distortion filter | One abnormal volume period shifts the cumulative line | News, session, spread, and platform feed behavior |
| Divergence-overread filter | OBV divergence treated as reversal confirmation | Price reaction, structure change, and follow-through |
| Trendline-overread filter | OBV trendline break treated as breakout confirmation | Price structure, retest behavior, and invalidation |
| No-level filter | OBV warning appears away from a meaningful price area | Support, resistance, retracement, or structure point |
| Range-whipsaw filter | OBV shifts repeatedly inside sideways movement | Range condition, timeframe, and volume quality |
| News-volatility filter | OBV jumps because of event-driven movement | News risk, spread behavior, and liquidity conditions |
| Low-timeframe-noise filter | OBV changes repeat on a noisy lower timeframe | Broader structure and timeframe alignment |
| No-invalidation filter | No clear place where the idea is wrong | Risk distance and invalidation rule |
How to Test OBV in Forex
Test a clearly defined OBV observation rather than selecting attractive historical divergences after the fact. Use consistent data and record both signals that work and those that fail. The process below is a testing framework, not evidence of OBV profitability.
- Define one hypothesis: For example, specify whether a particular divergence at a range boundary predicts a defined subsequent price event.
- Record the source and sample: Note broker/platform, tick-volume or other input, pair, timeframe, time zone, downloaded data window, and dates tested.
- Write objective rules: Specify swing-point detection, signal timing (such as candle close), price trigger, invalidation, and any stop or exit before reviewing outcomes.
- Separate conditions: Classify trend versus range, session, volatility, and scheduled news conditions rather than combining incompatible situations.
- Include trading frictions: If testing trade outcomes, account for applicable spread, slippage, and holding costs; distinguish modeled costs from actual broker executions.
- Log all eligible cases: Record signals accepted and rejected, reasons, subsequent price response, false signals, and missing-data cases.
- Evaluate out of sample: Compare results on a separate period or dataset and check whether small rule changes alter the findings.
- State limitations: Report sample size, source dependence, missing data, and whether results are chart observations, hypothetical backtests, or live trades.
A clear test can show whether OBV adds useful context in a defined situation; it cannot establish a universal setting or guarantee future results.