
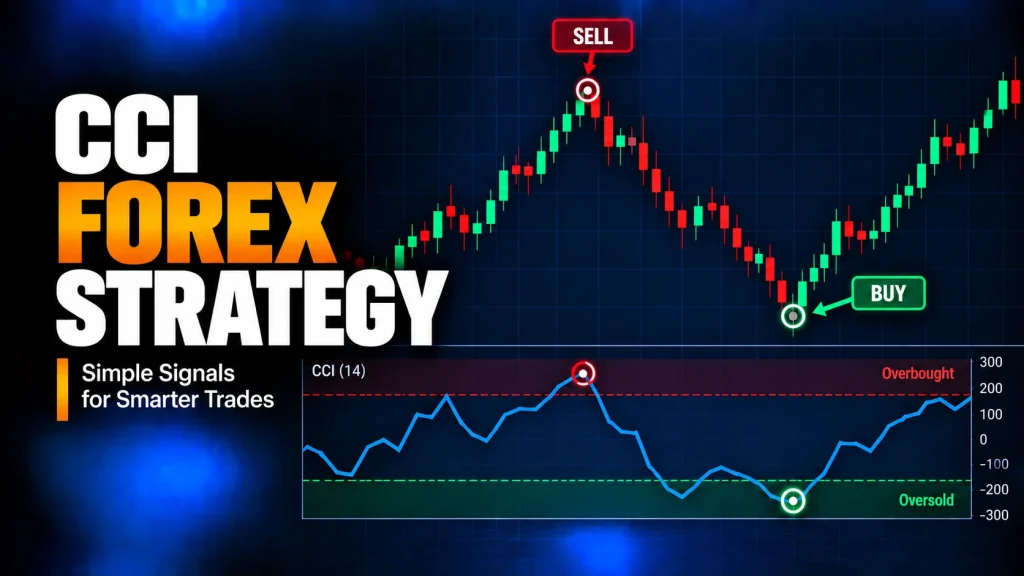
What Is A CCI Forex Strategy?
A CCI forex strategy is a rule-based trading method that uses the Commodity Channel Index to review how far price has moved from its recent average and whether momentum pressure may be changing. In forex trading, CCI can be used for overbought and oversold re-entry, zero-line continuation, divergence review, pullback timing, or a Woodies-style momentum filter.
The important point is that CCI is not a complete trade by itself. A reading above +100, below -100, crossing the zero line, or creating divergence only becomes useful when it is tied to market context, a setup, a trigger, an invalidation point, position risk, and an exit rule.
This page focuses on CCI as a strategy tool. For the broader indicator-strategy framework, use forex indicator strategies. For CCI mechanics, formula logic, common settings, +100 and -100 levels, and indicator basics, use the dedicated CCI Forex Indicator guide.
CCI Signal vs CCI Setup vs CCI Strategy
Many CCI strategy mistakes start when a trader treats one CCI reading as a full trading decision. A CCI move above +100 can show strong upside pressure, but it can also happen inside a trend that keeps extending. A CCI move below -100 can show downside pressure, but it is not automatically a buy condition. A zero-line cross may support continuation, but only when the broader chart agrees.
| Term | What It Means | CCI Example |
|---|---|---|
| CCI signal | A single indicator event | CCI crosses back above -100 or crosses the zero line |
| CCI condition | The indicator behavior that makes the chart worth reviewing | CCI was oversold, then starts returning toward neutral |
| CCI setup | The market condition where the CCI event becomes relevant | CCI re-entry appears near support while the higher timeframe is range-like |
| CCI strategy | The full rule set for trading the setup | Context, trigger, entry, stop, target, invalidation, cost check, and review rules |
| CCI filter | A condition used to accept or reject another trade idea | Only take pullbacks when price is above SMA100 and CCI turns upward |
Use the forex trading setups framework when a CCI signal needs to become a complete trade idea.
Market Conditions Where CCI Changes Meaning
CCI measures price deviation from a recent average, so the same CCI level can mean different things in different market conditions. A CCI reading near +100 may warn of overextension in a range, but in a trend it can also show continuation pressure. A reading near -100 may show a stretched move, but it can stay weak when the market is trending lower.
| Market Condition | CCI Use | Better Focus | Skip When |
|---|---|---|---|
| Sideways range | Overbought or oversold re-entry | Wait for CCI to move back inside +100 or -100 near support or resistance | The range breaks or the stop distance is too wide after spread |
| Clear trend | Zero-line continuation or pullback timing | Use CCI to confirm momentum returning with the trend | The CCI signal fights the higher-timeframe direction |
| Trend pullback | CCI + moving-average re-entry | Look for CCI recovery after price holds a trend filter | Price breaks the moving average or the trend structure fails |
| Possible reversal | CCI divergence with price structure | Use divergence as a warning, then wait for confirmation | Divergence appears without a trigger or invalidation point |
| Choppy market | Mostly a caution filter | Reduce signal weight and check spread, range size, and structure | CCI crosses repeatedly without clean price movement |
When CCI is used for continuation, review forex trend. When it is used for range re-entry or reversal context, review support and resistance in forex.
CCI Forex Strategy Types
The examples below show how CCI can support different strategy roles. They are not guaranteed systems. Each one still needs market context, a trigger, invalidation, position risk, exit rules, and review.
CCI Range Re-Entry Strategy
A CCI range re-entry strategy waits for CCI to move beyond +100 or below -100 and then return inside the level while the broader market is range-like. The purpose is not to buy every low CCI reading or sell every high CCI reading. The purpose is to wait until the stretch begins to fade near a useful chart area.
- Context: Higher timeframe is range-like or sideways.
- CCI role: Overbought or oversold stretch and re-entry check.
- Long idea: CCI moves below -100, then crosses back above -100 near support or range low.
- Short idea: CCI moves above +100, then crosses back below +100 near resistance or range high.
- Skip rule: Skip when price is trending strongly or the range is too narrow after spread.
CCI Zero-Line Trend Continuation Strategy
A CCI zero-line strategy uses the zero line as a momentum divider. In a bullish trend, a move back above zero can suggest momentum is returning after a pullback. In a bearish trend, a move back below zero can suggest downside pressure is returning. The zero-line cross should agree with the higher-timeframe trend and the trade should still have a clear stop.
- Context: Higher timeframe trend agrees with the trade direction.
- CCI role: Momentum continuation filter.
- Trigger: CCI crosses the zero line in the trend direction after a pullback.
- Invalidation: Price structure or the trend filter fails.
- Skip rule: Skip if the zero-line cross appears inside flat, choppy price action.
CCI Moving Average Strategy
A CCI moving average strategy gives the moving average one job and CCI another. The moving average defines directional context or a pullback zone, while CCI reviews whether momentum is turning back in the direction of that context. This helps avoid using CCI alone as both the trend filter and entry trigger.
- Context: Price and moving-average slope support one direction.
- CCI role: Pullback re-entry and momentum recovery.
- Long idea: Price stays above the moving average while CCI recovers from below -100.
- Short idea: Price stays below the moving average while CCI recovers from above +100.
- Skip rule: Skip when price repeatedly crosses the moving average and CCI gives conflicting signals.
For broader moving-average concepts, use the Forex Moving Average guide. For full moving-average strategy structure, use Moving Average Forex Strategy.
CCI Divergence Strategy Forex
A CCI divergence strategy compares price swings with CCI swings. Bullish divergence may appear when price makes a lower low while CCI makes a higher low. Bearish divergence may appear when price makes a higher high while CCI makes a lower high. Divergence is only a warning; it should not be treated as an entry by itself.
- Context: Price is stretched or approaching a meaningful chart area.
- CCI role: Momentum disagreement warning.
- Trigger: CCI re-entry, candle confirmation, or structure shift after the divergence.
- Invalidation: Price breaks beyond the divergence pivot and removes the reversal idea.
- Skip rule: Skip if divergence keeps forming against a strong trend without price confirmation.
For the indicator-side explanation of divergence, use What Is Divergence in Forex?.
Woodies CCI Strategy Forex
A Woodies CCI strategy uses CCI-style momentum behavior around the zero line and often includes a faster CCI reading. A full Woodies system can be more detailed than a basic article example, so this page treats it as an educational zero-line reject setup rather than a complete discretionary Woodies CCI system.
- Context: A higher-timeframe trend is established before the zero-line reject is considered.
- CCI role: Main CCI checks the zero-line rejection; faster CCI checks short-term confirmation.
- Long idea: CCI holds near zero, turns upward, and fast CCI agrees.
- Short idea: CCI holds near zero, turns downward, and fast CCI agrees.
- Skip rule: Skip if the setup depends on CCI alone without price structure or trend context.
CCI Settings And Strategy Tools
The common CCI setting is 20 periods, but no CCI length is best for every pair, timeframe, or strategy. A shorter CCI reacts faster but may create more noise. A longer CCI reacts slower but may reduce false signals. The setting should be chosen before testing and kept consistent during the review.
| Tool Or Setting | Strategy Use | Main Risk |
|---|---|---|
| 20-period CCI | Baseline setting for re-entry, zero-line, pullback, and divergence review | Not automatically best for every timeframe or pair |
| +100 and -100 levels | Identify stretched conditions and possible re-entry points | Can stay extreme during strong trends |
| Zero line | Momentum continuation or trend-alignment reference | Can whip back and forth in choppy markets |
| Moving average | Separate trend context from CCI timing | A flat moving average can create weak signals |
| ATR | Define stop buffer and risk distance | ATR-based stops still need chart invalidation |
| Divergence pivots | Identify disagreement between price swings and CCI swings | Discretionary divergence can be subjective |
When combining CCI with another indicator, use the Forex Indicator Combinations framework so each tool has a separate role.
CCI Multi-Timeframe Confirmation
CCI can be reviewed across more than one timeframe, but each timeframe should have a different job. The higher timeframe should define trend, range, or market condition. The trading timeframe should define the CCI setup. The entry timeframe, if used, should clarify the trigger and invalidation area.
| Timeframe Role | What To Check | Use In The Strategy | Skip If |
|---|---|---|---|
| Higher timeframe | Trend, range, major level, or broader momentum condition | Defines whether CCI should be used for re-entry, continuation, or reversal review | The lower-timeframe signal fights the broader structure |
| Trading timeframe | CCI +100/-100, zero-line, divergence, or pullback setup | Defines the setup being tested | CCI events appear in unclear or flat price action |
| Entry timeframe | Candle confirmation, structure break, retest, or failure point | Helps refine entry and invalidation | It creates noise instead of clearer risk |
Worked Example: One CCI Reading, Four Outcomes
Assume CCI has moved below -100 on a currency pair. That does not automatically create a buy setup. The trader still needs to ask why CCI is low and what the broader market is doing.
| Observation | Possible Meaning | Next Check | Skip If |
|---|---|---|---|
| Price is range-bound and near support | CCI may be showing temporary downside stretch | Wait for CCI re-entry and price confirmation | Support breaks and holds lower |
| Price is in a strong downtrend | Low CCI may show continuation pressure | Check whether selling pressure is still active | The trade is only a guess at a bottom |
| Price pulls back above an upward moving average | CCI may be resetting before trend continuation | Wait for CCI recovery and candle confirmation | Price closes below the trend filter |
| Price makes a lower low while CCI makes a higher low | Bullish divergence may be forming | Wait for structure or CCI re-entry confirmation | Price keeps breaking lower without confirmation |
When CCI Forex Strategies Fail
CCI forex strategies often fail when the indicator is used outside the market condition it was meant to support. A re-entry setup can fail during a strong trend. A zero-line cross can fail in choppy markets. Divergence can appear early and continue forming while price keeps moving against the trade idea.
- Automatic +100 or -100 entries: Selling only because CCI is above +100 or buying only because CCI is below -100 can be risky in strong trends.
- No context: The CCI signal is used without trend, range, support, resistance, or structure.
- Zero-line whipsaw: CCI crosses the zero line repeatedly in sideways price action.
- Early divergence: Divergence is treated as a reversal entry before price confirms.
- Duplicate confirmation: Several indicators are added but all measure similar momentum, so the setup is not truly stronger.
- Late entry: The trigger appears after price has already moved too far from invalidation.
- Cost problem: A short-term CCI signal has too little room after spread and slippage.
- Settings changed too often: CCI length or filters are adjusted after losses, making the test unreliable.
- Event volatility: News changes spread, slippage, and price behavior before the setup can be managed.
When stop distance, position size, and margin exposure need to be reviewed together, use the FXGlory margin calculator.
Testing A CCI Forex Strategy
A CCI forex strategy should be tested as a full rule set, not as a single indicator event. The test should include winning trades, losing trades, skipped signals, false re-entries, failed zero-line crosses, early divergence, choppy sessions, and changes in spread or slippage assumptions.
- What market condition does the CCI strategy need?
- Is CCI being used for re-entry, continuation, moving-average pullback, divergence, or Woodies-style zero-line behavior?
- What CCI level or cross makes the chart worth reviewing?
- What price action confirms the entry?
- Where is the idea invalid?
- Does the target still make sense after spread and slippage?
- Does stop distance fit position size and margin exposure?
- Are CCI settings kept consistent during the test?
- Are skipped signals and no-context warnings recorded?
- Does the result change across selected currency pairs, sessions, or setup types?
Review available currency pairs before applying the same CCI method across too many markets. Review FXGlory trading platforms when the strategy depends on charting tools, indicator settings, alerts, order placement, or trade-management workflow.
CCI Forex Strategy Checklist
Before using a CCI forex strategy, answer these questions.
- Is the market trending, ranging, reversing, pulling back, or unclear?
- What role does CCI play in this strategy?
- Is the CCI signal near a meaningful chart area?
- Does the higher timeframe support or conflict with the CCI idea?
- Is there confirmation from price structure or another defined tool?
- Where is the trade idea invalid?
- Are the CCI settings fixed for the test?
- Does the setup still make sense after spread and slippage?
- Does position size fit stop distance and margin exposure?
- What closes or reviews the trade?
- What condition turns the CCI signal into a no-trade?
A CCI forex strategy is useful only when the indicator supports a clear rule. CCI can help review momentum pressure and price deviation, but it should not replace market context, invalidation, risk control, or review.
CCI Setup-Type Test Notes
This hypothetical educational CCI setup-type test reviewed five CCI setup types: CCI range re-entry, CCI zero-line trend continuation, CCI + moving-average pullback re-entry, CCI divergence reversal, and Woodies-style CCI zero-line reject. CCI is used as a price-deviation and momentum-pressure tool, not as an automatic buy or sell signal.
The model reviewed EURUSD, GBPUSD, USDJPY, AUDUSD, USDCAD, and USDCHF using public yfinance 15-minute OHLC data where available. The 1H candles were resampled from the same 15-minute data so that context and setup timing had defined roles. The downloaded 15-minute data begins at 2026-04-16 23:00 UTC for all six pairs and runs through 2026-07-09 15:00 UTC for EURUSD, GBPUSD, USDJPY, AUDUSD, and USDCAD; USDCHF extends to 15:15 UTC.
| Setup Type | Educational Model Rule |
|---|---|
| CCI range re-entry | Reviews CCI crossing back inside +100 or -100 only when the 1H context is range-like |
| CCI zero-line trend continuation | Reviews CCI crossing the zero line in the direction of 1H trend context |
| CCI + moving-average pullback re-entry | Reviews CCI recovery after a pullback while price respects the 100-period SMA trend filter |
| CCI divergence reversal | Reviews simplified price/CCI divergence with pivot logic and CCI re-entry confirmation |
| Woodies-style CCI zero-line reject | Reviews simplified zero-line rejection using CCI20 and a faster 6-period CCI confirmation |
| Rule Area | Educational Model Rule |
|---|---|
| Main CCI | 20-period CCI |
| Turbo CCI | 6-period CCI used only for the Woodies-style setup |
| Moving average | 100-period simple moving average |
| Context chart | 1H trend, range, CCI, SMA, and slope context |
| Setup chart | 15M CCI, SMA, ATR, structure, candle location, and divergence logic |
| Session grouping | London morning, London/New York overlap, early New York afternoon, and a separately reported rollover/off-hours group |
| Operating window | Setups are accepted from 07:00 through 18:59 UTC; Friday setups after 16:00 UTC are rejected |
| Overlap filter | Only one open trade is allowed per pair per setup type; a new candidate for the same pair and setup type is rejected while that combination already has an open trade |
| Entry | Next 15M open after the completed setup candle |
| Stop | Setup candle, structure extreme, or divergence pivot with a 0.25 ATR(14) buffer |
| Target comparison | Fixed 1.3R target from entry |
| Invalidation exit | Setup-specific invalidation based on CCI, SMA, structure, divergence pivot, or range failure |
| Same-day exit | Forced close at the last available 15M close at or before 20:45 UTC |
| Cost Input | Assumptions Used |
|---|---|
| Spread | 0.5, 1.5, and 3.0 pips |
| Slippage | 0.1, 0.5, and 1.0 pips per side |
| Baseline comparison | 1.5-pip spread and 0.5-pip slippage per side |
| Swap and rollover | Not included because trades are forced flat before the same-day cutoff |
The review records setup candidates, accepted trades, rejected candidates, no-context CCI signals, rejection reasons, trade count, win rate, average win in R, average loss in R, expectancy in R, profit factor, maximum drawdown in R, worst losing streak, holding time, same-day cutoff exits, setup-type behavior, session-level behavior, pair-level behavior, direction-level behavior, exit reasons, and spread/slippage sensitivity.
Educational CCI Setup-Type Test Results
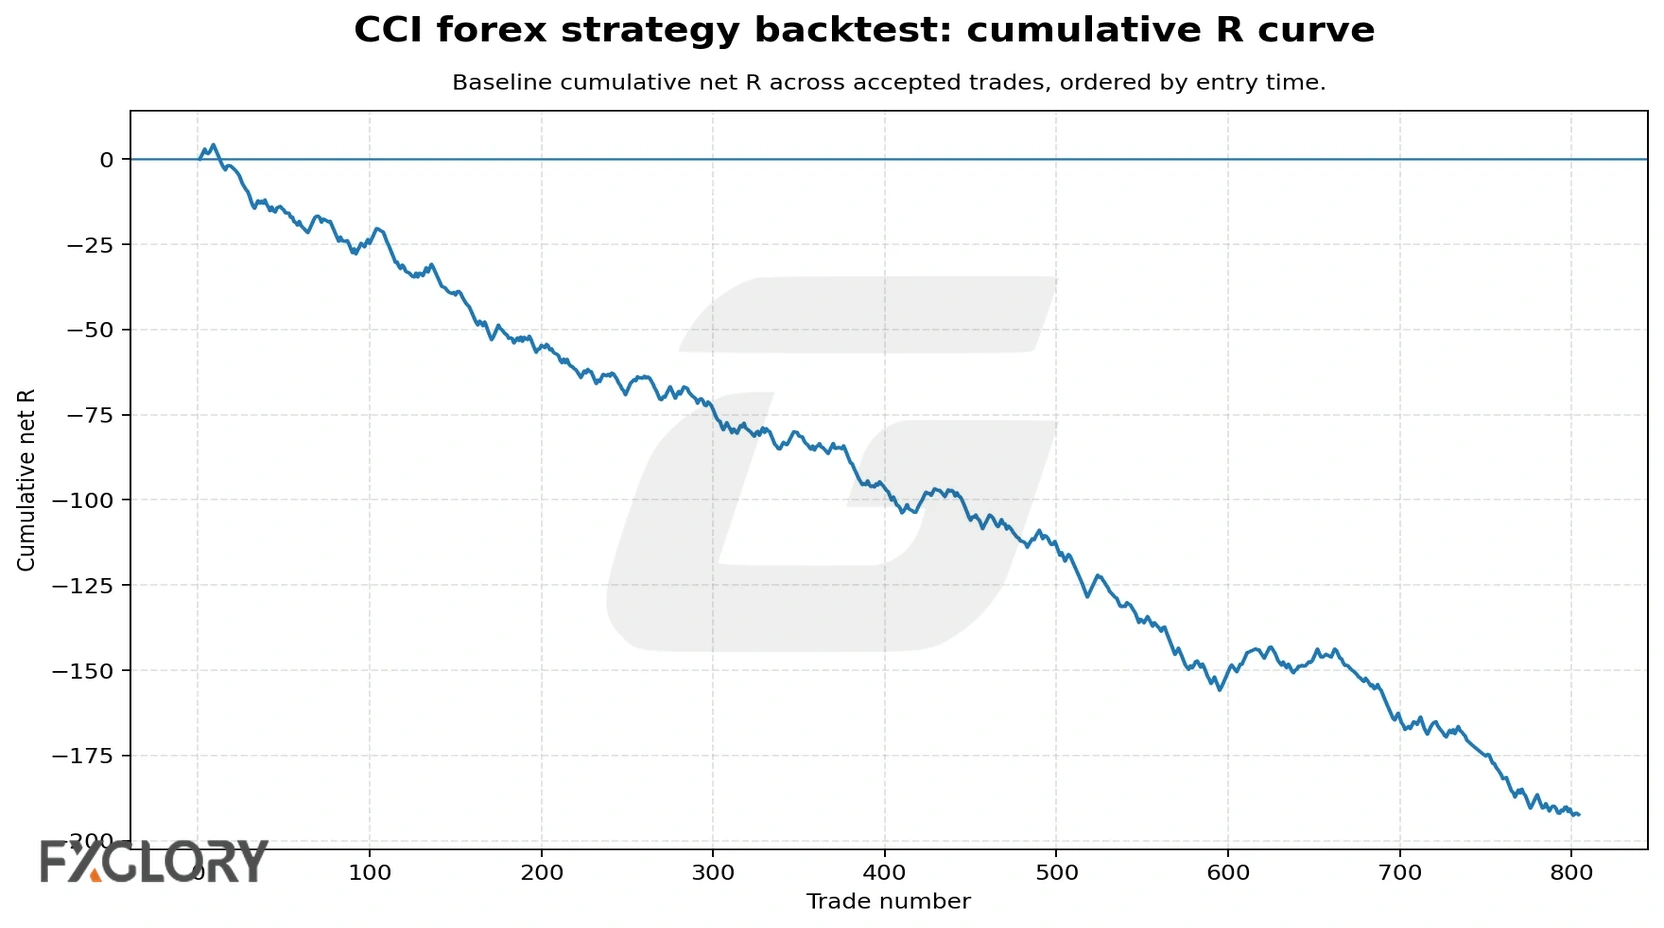
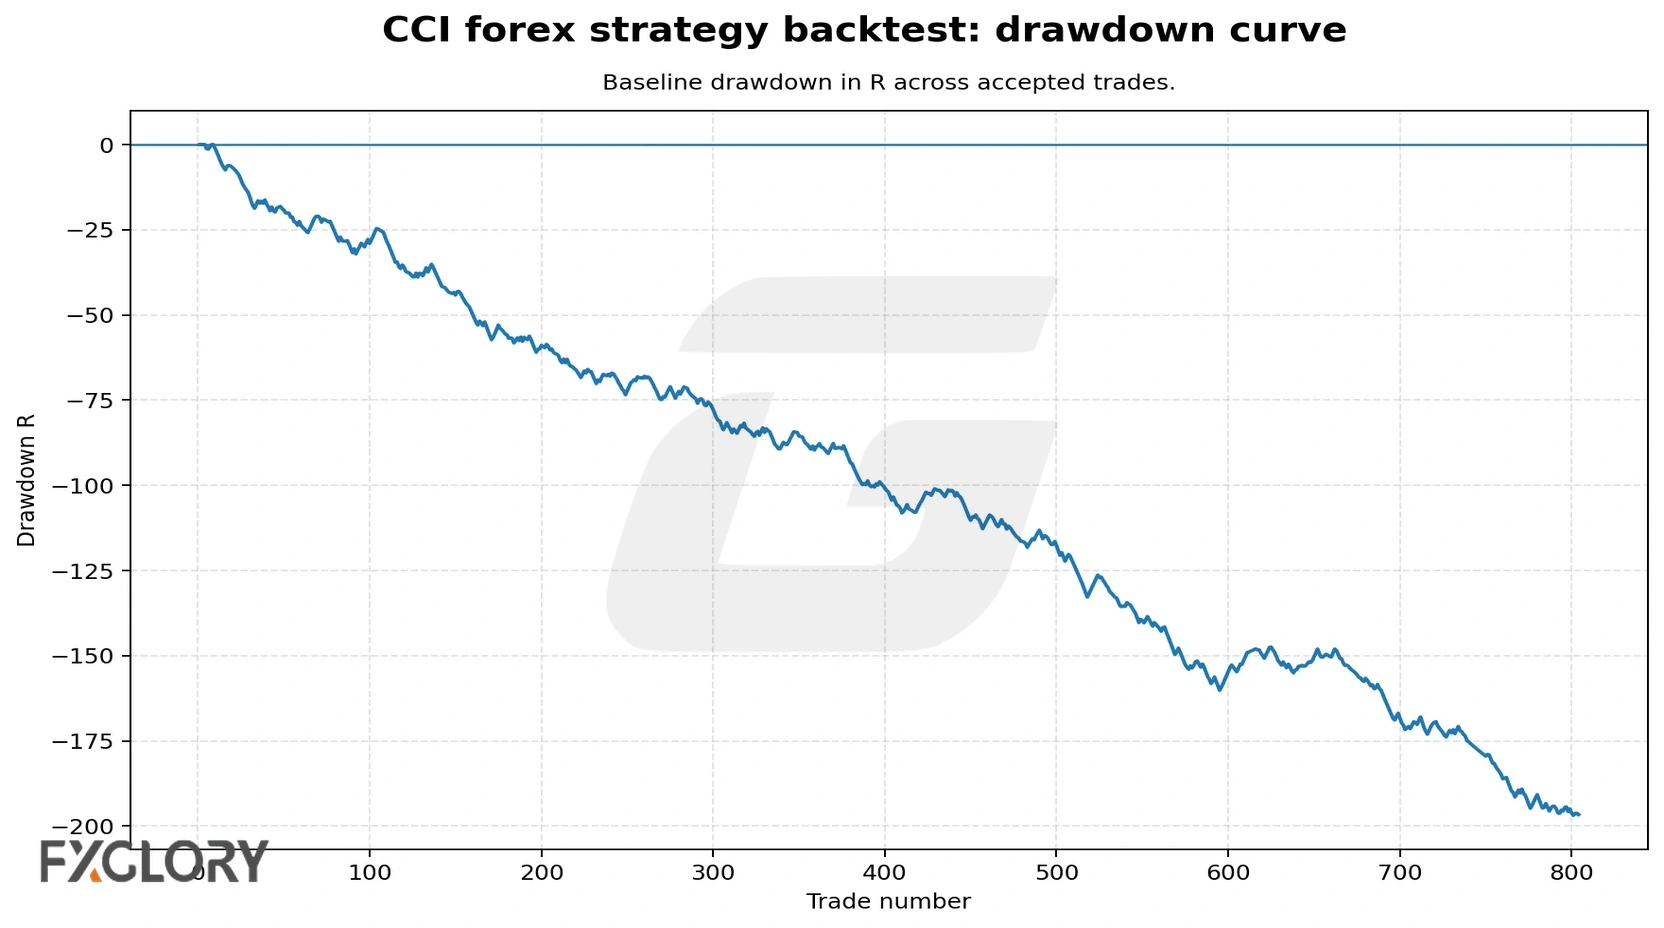
The baseline run was negative: -0.2392R expectancy and -192.3533R total net result across 804 accepted trades. The test used a 1.5-pip spread and 0.5-pip slippage per side. These figures are hypothetical historical results from one educational CCI setup-type model, not proof of future live-trading performance.
| Metric | Baseline Result |
|---|---|
| Number of trades | 804 |
| Win rate | 33.96% |
| Average win | 0.8385R |
| Average loss | -0.7933R |
| Expectancy | -0.2392R |
| Profit factor | 0.5434 |
| Maximum drawdown | -196.8853R |
| Worst losing streak | 16 |
| Average holding period | 153.43 minutes |
| Same-day cutoff exit rate | 10.95% |
| Invalidation exit rate | 33.96% |
| Total net result | -192.3533R |
The candidate funnel has two acceptance stages. Of 2,090 setup candidates, 949 passed the initial time/risk gates and reached the overlap filter, which is 45.41% of candidates. The overlap filter then rejected 145 same-pair, same-setup-type candidates, leaving 804 final accepted trades, or approximately 38.47% of all setup candidates. The reported 61.53% candidate rejection rate refers to the 1,286 candidates rejected by the end of the full filtering process.
| Control Area | Count Or Result |
|---|---|
| Setup candidates | 2090 |
| Trades before overlap filter | 949 |
| Accepted trades | 804 |
| Rejected candidates | 1286 |
| CCI no-context warnings | 1377 |
| Pre-overlap qualification rate | 45.41% (949 of 2,090 candidates) |
| Final accepted-trade rate | 38.47% (804 of 2,090 candidates) |
| Final candidate rejection rate | 61.53% (1,286 of 2,090 candidates) |
| Rejected Condition | Count |
|---|---|
| Outside 07:00-18:59 UTC operating window or Friday after 16:00 UTC | 1121 |
| Invalid trade after setup or risk gate | 20 |
| Same pair and setup type already had an open trade | 145 |
Setup-Type Baseline Results
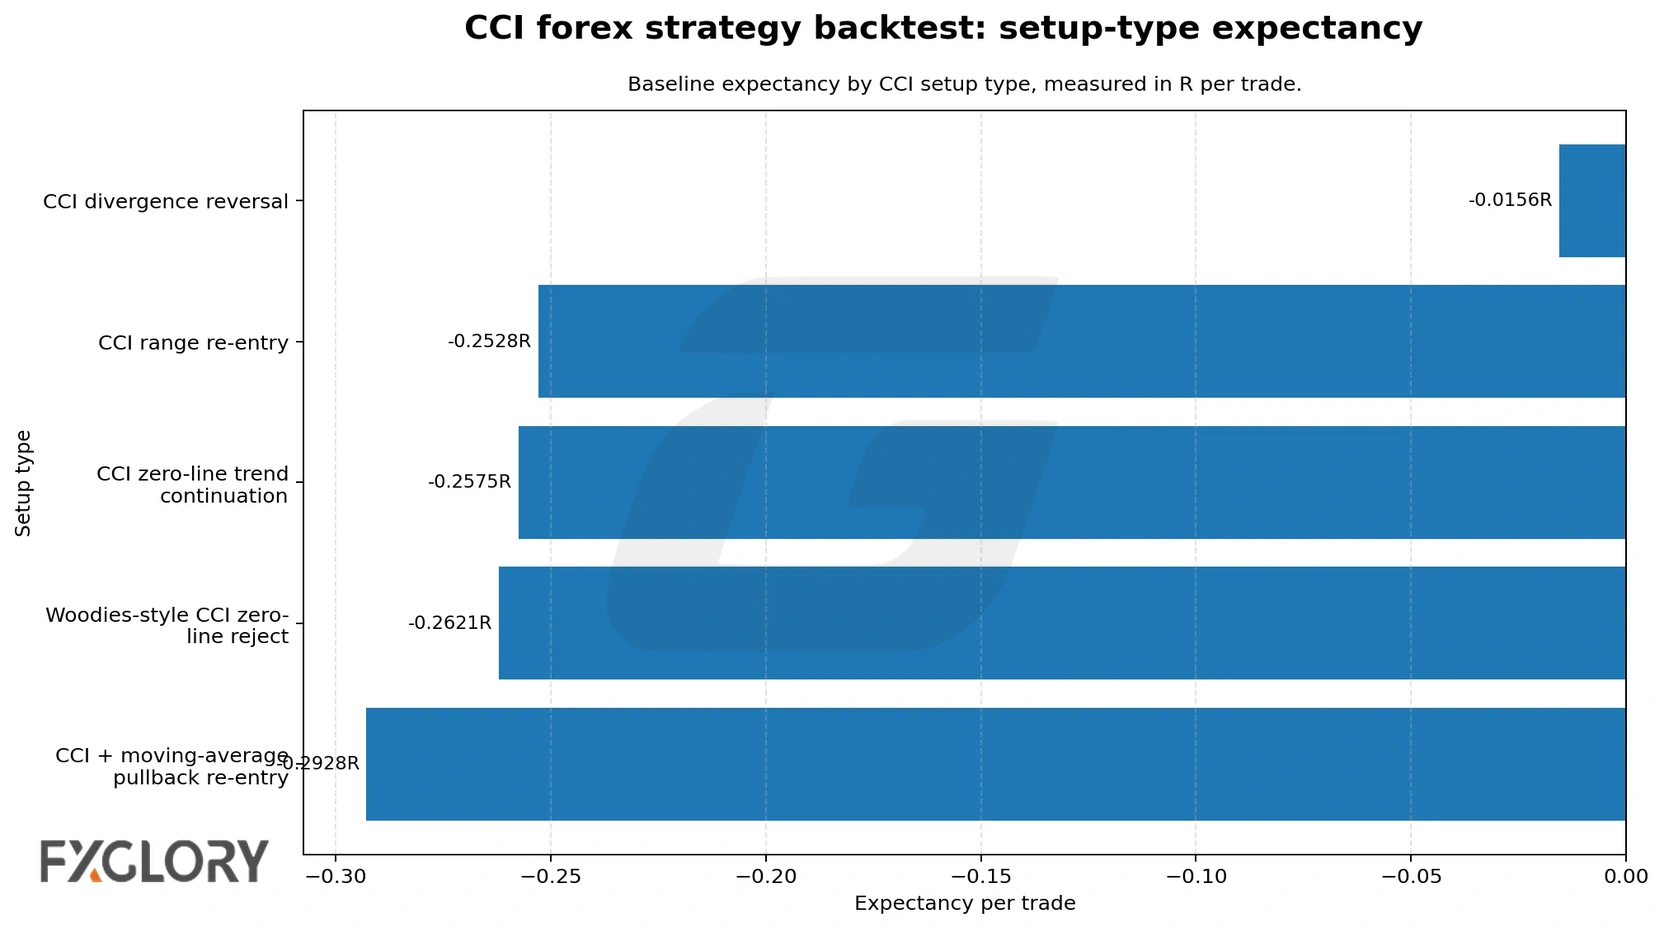
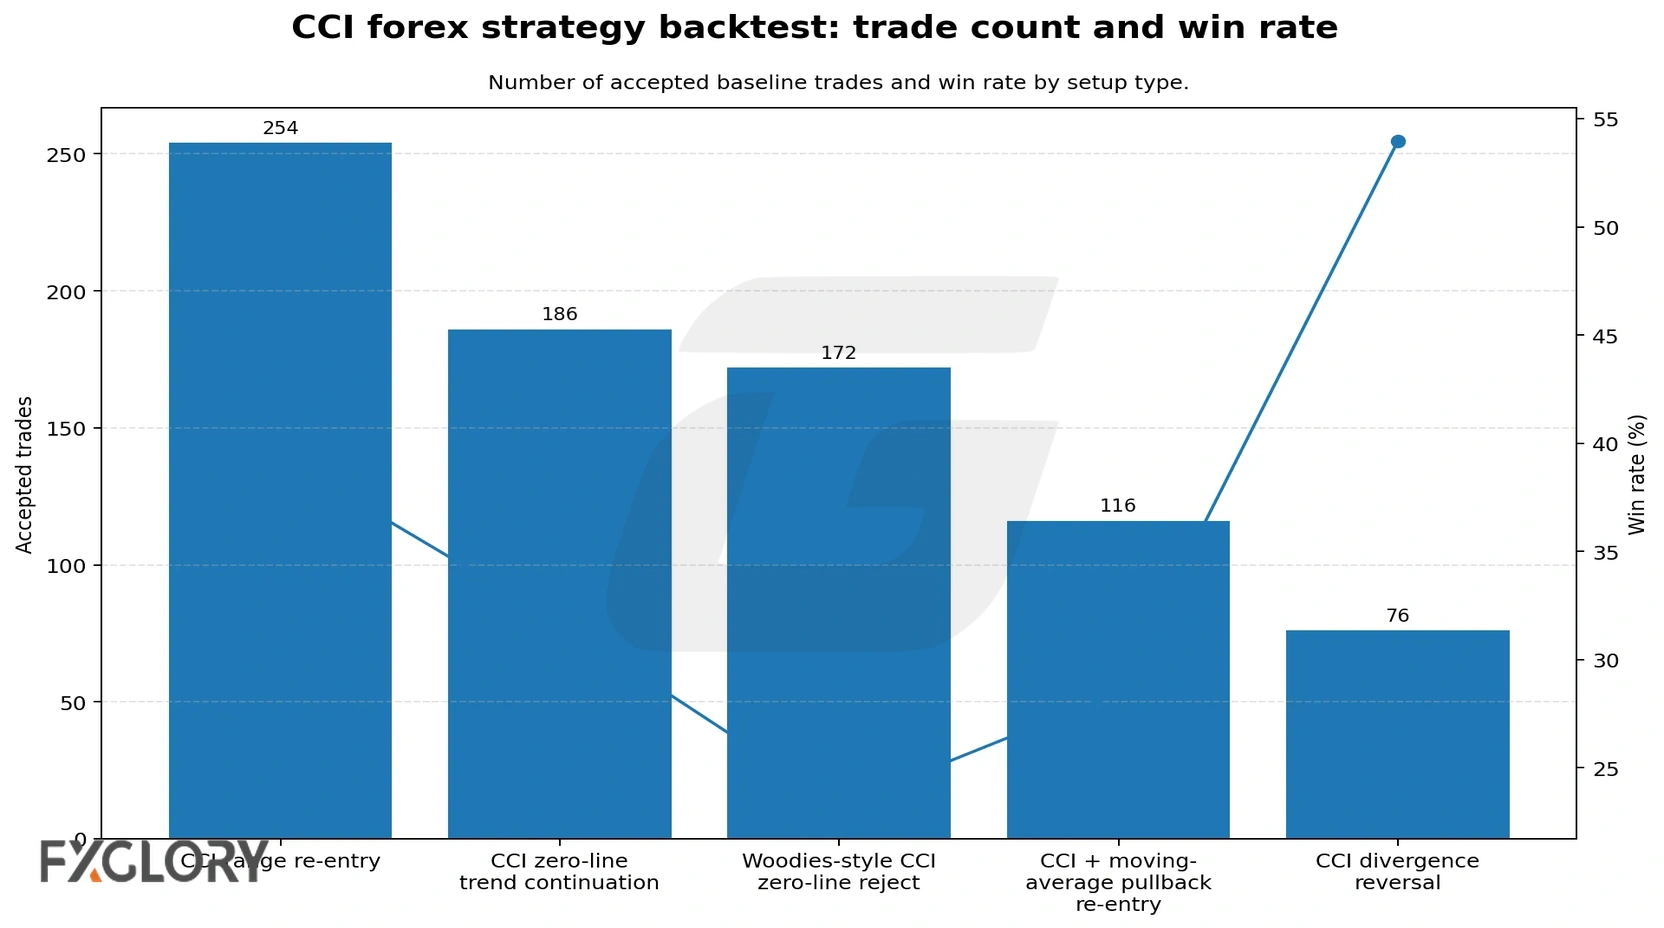
The setup-type comparison shows how each CCI setup behaved under the same cost, stop, target, session, same-day exit, and overlap rules. In this run, CCI divergence reversal was closest to breakeven, but it was still slightly negative under the baseline cost assumption. This should be read as setup-behavior evidence, not as proof that divergence is best.
| Setup Type | Trades | Win Rate | Expectancy | Profit Factor | Total Net Result | Max Drawdown | Worst Losing Streak |
|---|---|---|---|---|---|---|---|
| CCI divergence reversal | 76 | 53.95% | -0.0156R | 0.9665 | -1.1884R | -13.0575R | 4 |
| CCI range re-entry | 254 | 39.37% | -0.2528R | 0.5732 | -64.2160R | -66.0894R | 9 |
| CCI zero-line trend continuation | 186 | 31.72% | -0.2575R | 0.4989 | -47.9024R | -49.0154R | 12 |
| Woodies-style CCI zero-line reject | 172 | 23.26% | -0.2621R | 0.3914 | -45.0808R | -46.3848R | 23 |
| CCI + moving-average pullback re-entry | 116 | 28.45% | -0.2928R | 0.4827 | -33.9659R | -36.9060R | 16 |
Session-Level Baseline Results
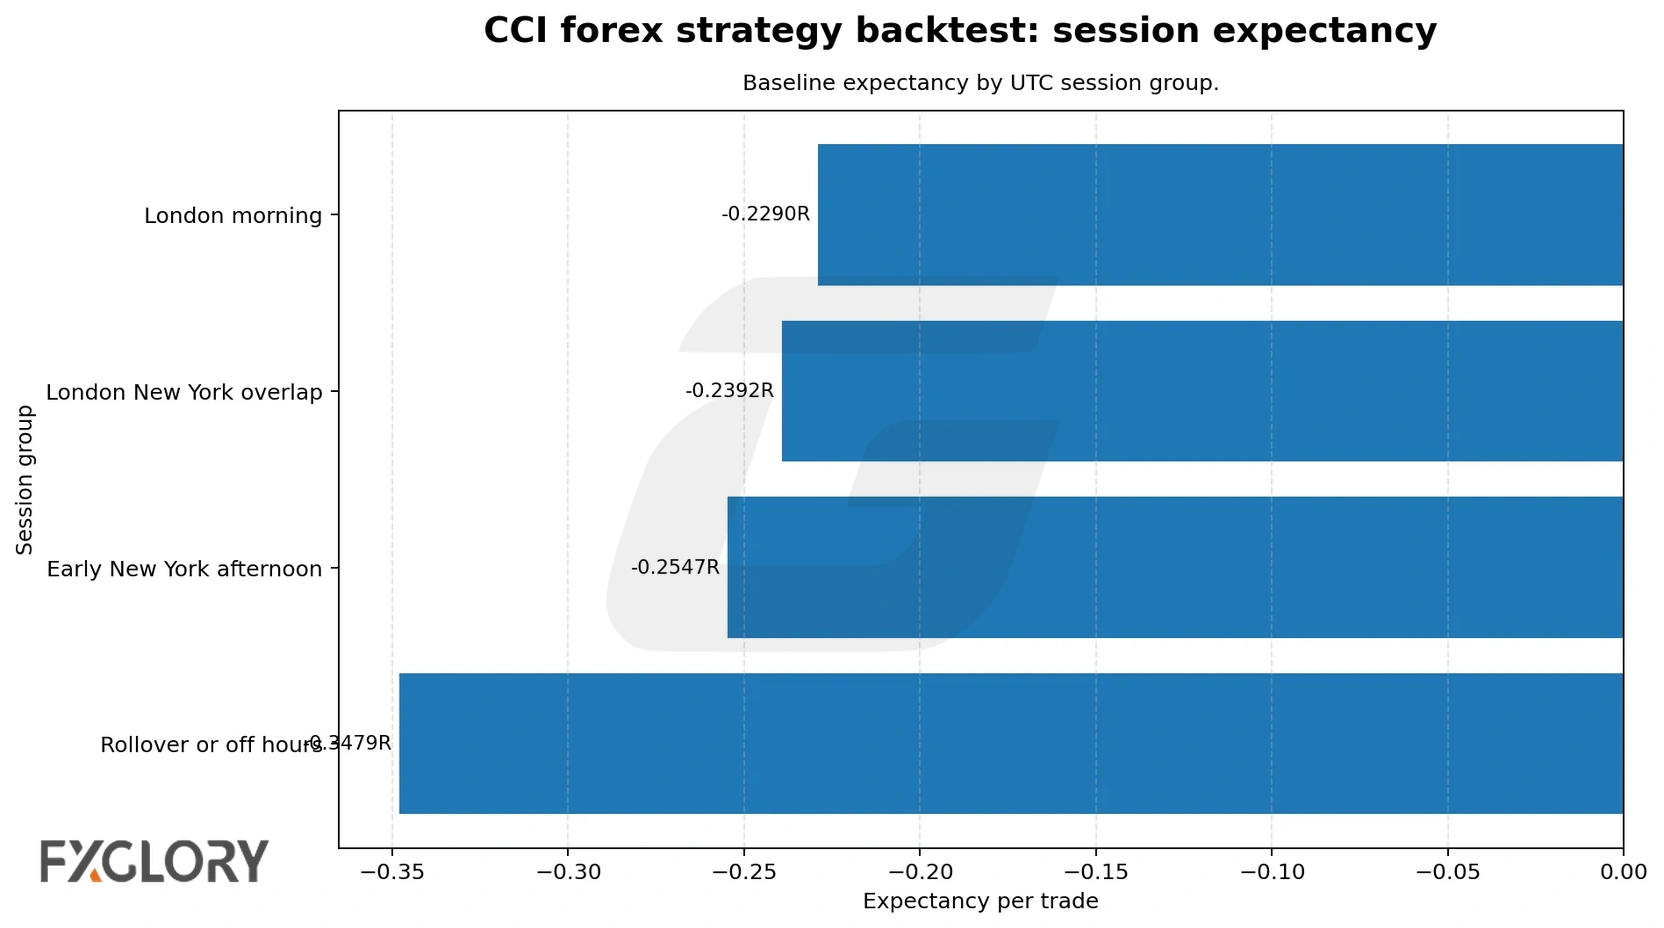
Session-level results help show whether the CCI model behaved differently during London morning, London/New York overlap, early New York afternoon, or off-hours conditions. The baseline run was negative in all reported session groups, while rollover/off-hours had the weakest win rate and a very small sample.
| Session | Trades | Win Rate | Expectancy | Total Net Result | Same-Day Cutoff Exit Rate | Invalidation Exit Rate |
|---|---|---|---|---|---|---|
| London morning | 349 | 36.96% | -0.2290R | -79.9137R | 0.00% | 33.24% |
| London New York overlap | 307 | 34.20% | -0.2392R | -73.4354R | 5.86% | 34.85% |
| Early New York afternoon | 134 | 28.36% | -0.2547R | -34.1333R | 44.78% | 35.07% |
| Rollover or off hours | 14 | 7.14% | -0.3479R | -4.8709R | 71.43% | 21.43% |
Pair-Level Baseline Results
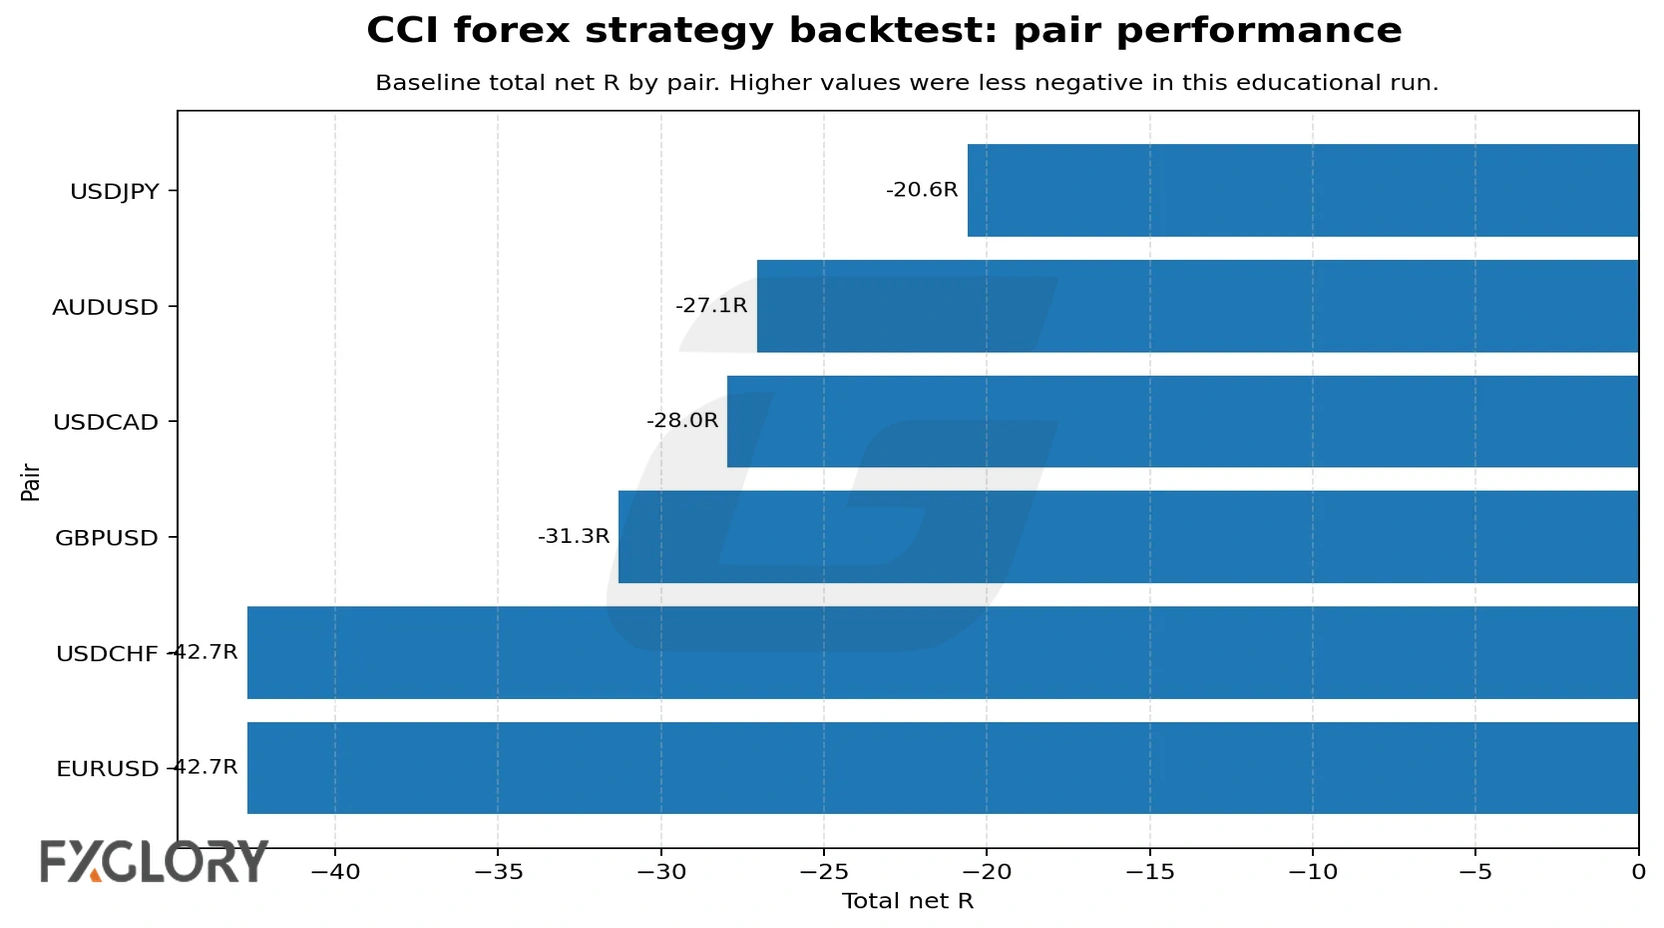
Pair-level results should not be used to assume one currency pair will work better in live trading. They are useful for understanding whether the same CCI rule model behaved differently across the tested instruments.
| Pair | Trades | Win Rate | Expectancy | Profit Factor | Total Net Result | Max Drawdown |
|---|---|---|---|---|---|---|
| USDJPY | 132 | 38.64% | -0.1561R | 0.6503 | -20.6042R | -21.3557R |
| AUDUSD | 112 | 36.61% | -0.2417R | 0.5526 | -27.0649R | -30.0081R |
| USDCAD | 150 | 30.00% | -0.1864R | 0.6051 | -27.9571R | -30.3947R |
| GBPUSD | 136 | 38.24% | -0.2302R | 0.5831 | -31.3122R | -30.1885R |
| USDCHF | 148 | 29.73% | -0.2885R | 0.4636 | -42.7046R | -45.4974R |
| EURUSD | 126 | 31.75% | -0.3390R | 0.4405 | -42.7104R | -46.1833R |
Spread And Slippage Sensitivity
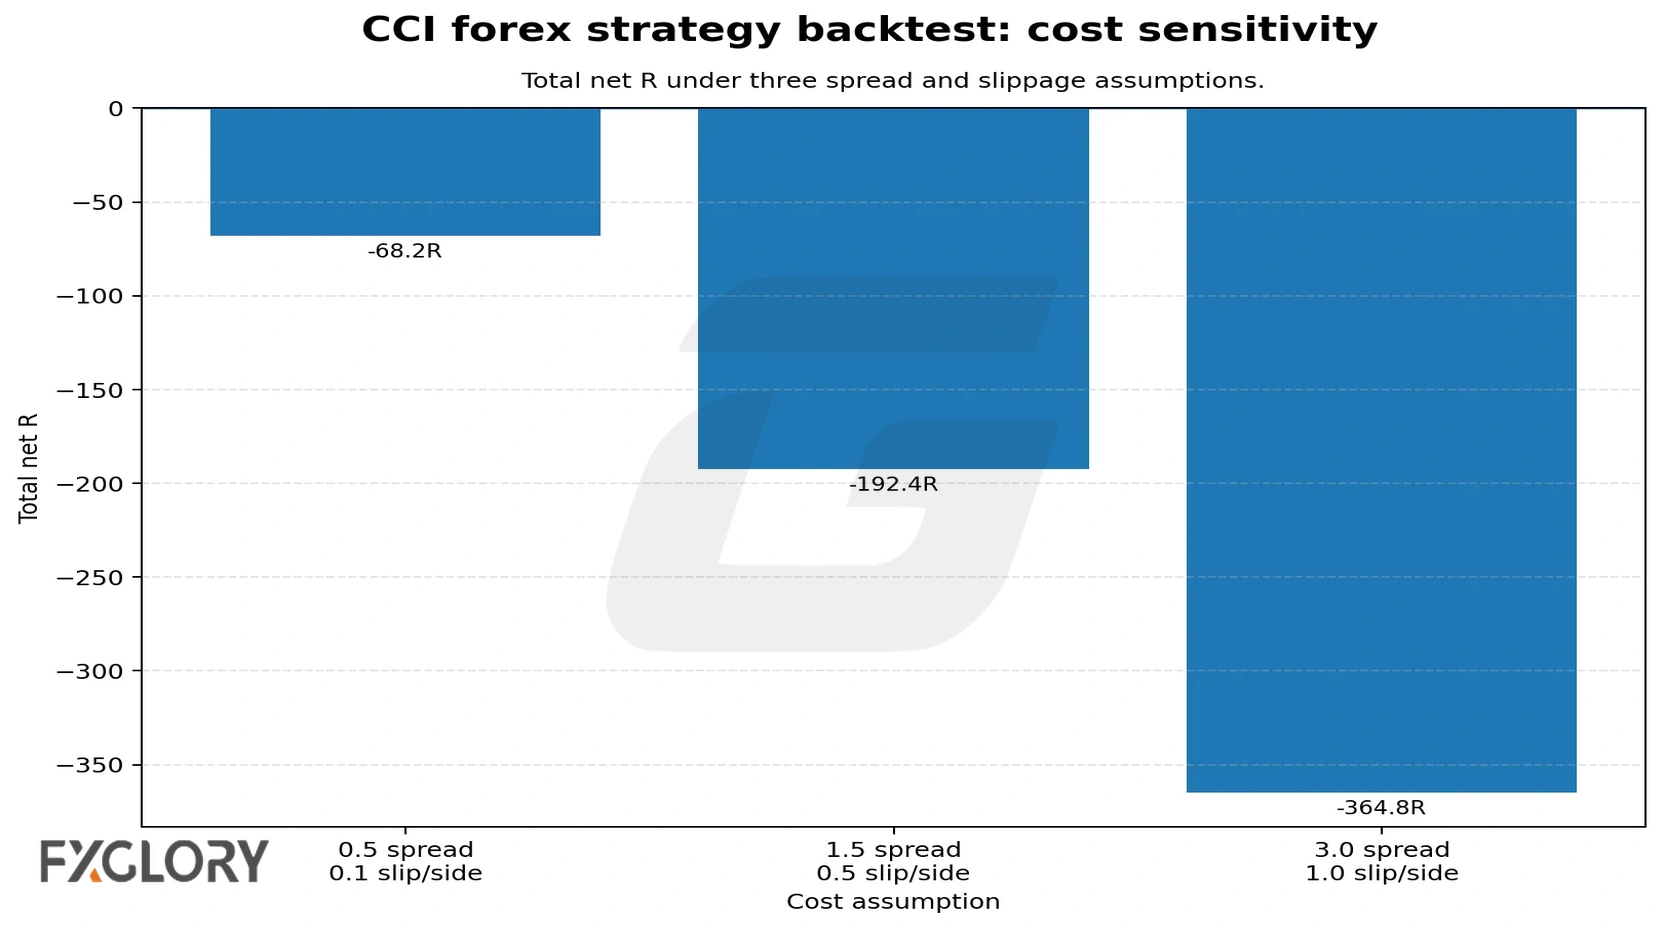
Cost sensitivity is important for short-term indicator strategies. In this test, the same CCI model became more negative as spread and slippage assumptions increased. This is one reason CCI strategy pages should not discuss entries without also discussing stop distance, target distance, and execution cost.
| Spread | Slippage | Trades | Win Rate | Expectancy | Profit Factor | Total Net Result | Max Drawdown |
|---|---|---|---|---|---|---|---|
| 0.5 pips | 0.1 pips per side | 804 | 36.19% | -0.0848R | 0.8025 | -68.2045R | -76.9407R |
| 1.5 pips | 0.5 pips per side | 804 | 33.96% | -0.2392R | 0.5434 | -192.3533R | -196.8853R |
| 3.0 pips | 1.0 pips per side | 804 | 31.72% | -0.4537R | 0.3119 | -364.7823R | -367.0045R |
Exit Reason Counts
| Exit Reason | Count |
|---|---|
| cci divergence reversal invalidation exit | 7 |
| cci ma pullback reentry invalidation exit | 59 |
| cci range reentry invalidation exit | 10 |
| cci zero line trend continuation invalidation exit | 81 |
| same day cutoff exit | 88 |
| stop first same bar | 3 |
| stop loss | 174 |
| target 1 3r | 201 |
| time exit | 65 |
| woodies cci zero line reject invalidation exit | 116 |
CCI Backtest Conclusion
The educational test did not show a profitable baseline CCI forex strategy. The total result was negative, and all five setup types were negative under the baseline cost assumption. The most useful finding is not that CCI failed or that CCI divergence should be traded. The useful finding is that CCI setup behavior changed meaningfully by setup type, pair, session, and cost assumption.
CCI divergence reversal was closest to breakeven in the baseline model, but it had only 76 trades and still finished slightly negative. CCI range re-entry had more trades and a higher win rate than several other setup types, but the average loss and cost assumptions still produced negative expectancy. The Woodies-style zero-line reject model had the highest invalidation pressure and the weakest win rate in this simplified test.