
Bearish daily structure and negative momentum keep downside pressure in focus, while mixed daily closes and scheduled data leave room for hesitation and countertrend movement.
Daily check — 21 October 2026: The latest completed D1 close was 1.97652 on 20 October 2026. It remains below the upper formal invalidation level 1.99039; the lower calibrated boundary 1.95154 is an extension/confirmation boundary. The authored weekly thesis remains valid.
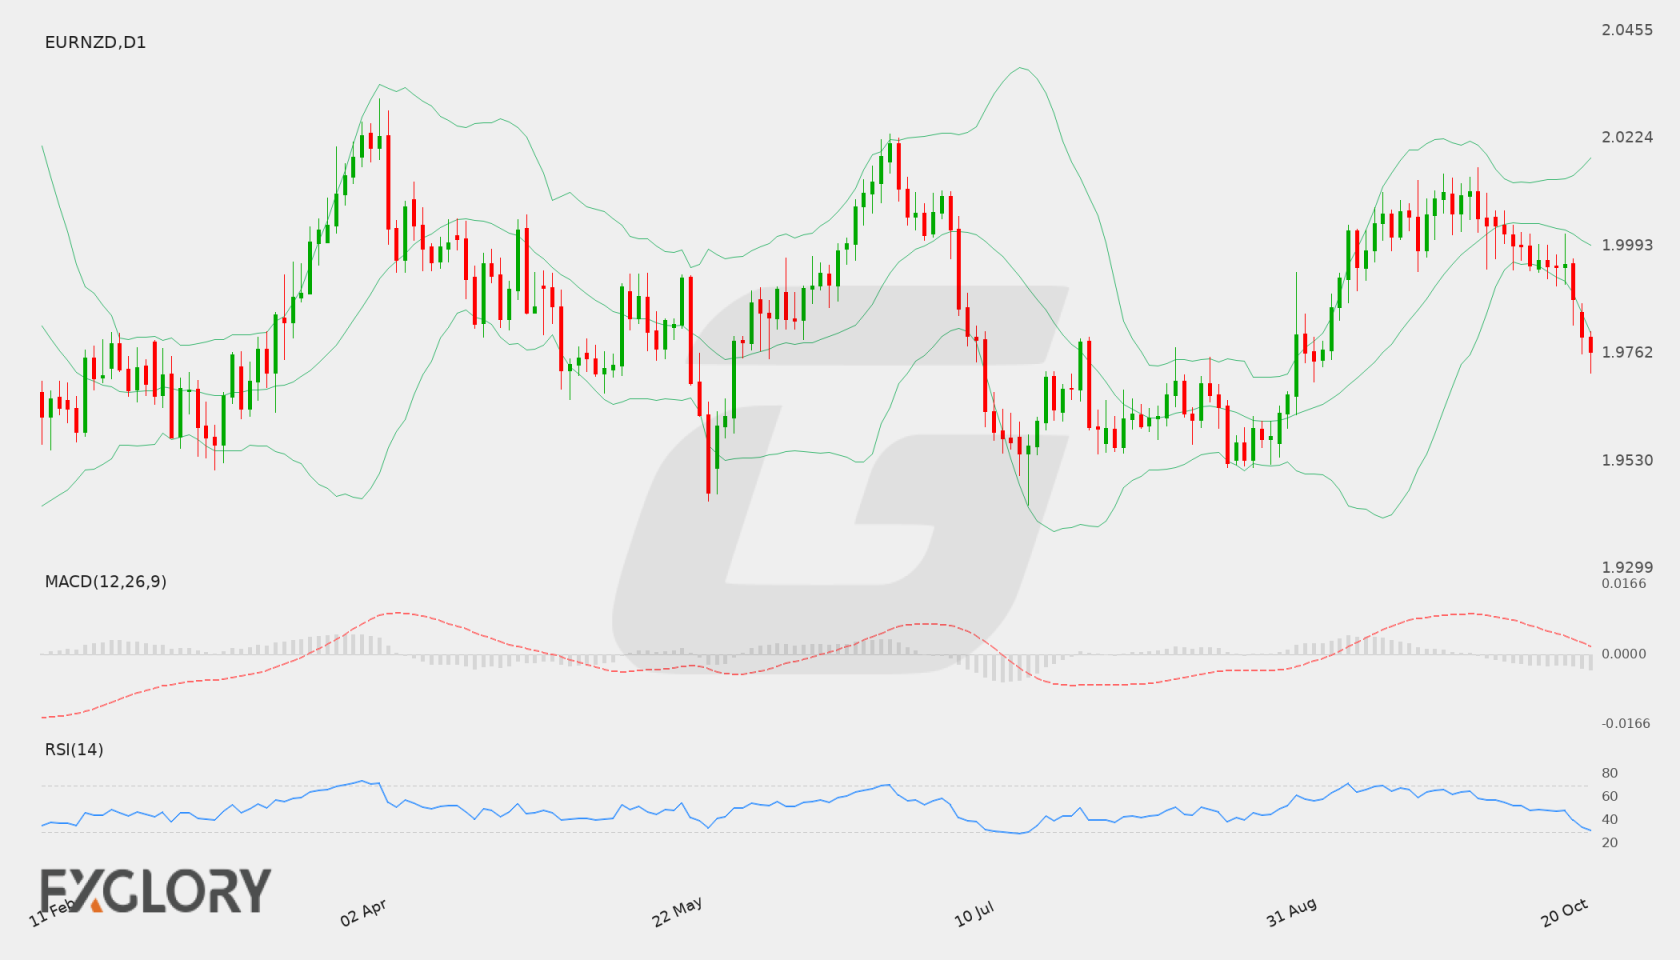
EUR/NZD Weekly Forecast at a Glance
In brief
EUR/NZD has a bearish weekly bias as negative momentum and falling daily moving-average slopes align, although mixed D1 closes and scheduled data leave room for pauses or countertrend price action.
The D1 trend is bearish, and the reference close of 1.97976 sits below the supplied primary resistance at 1.99039 and the daily EMA20, EMA50 and SMA200. Negative MACD readings and an RSI of 33.54 reinforce downside pressure, while the mixed D1 close sequence argues against treating continuation as settled.
H4 is also bearish, with its close below the H4 EMA20 and EMA50 and its MACD histogram negative; this supports the daily direction tactically, but does not establish how quickly price may develop. The supplied support levels at 1.95154 and 1.9443 frame the downside reference area, while the NZD CPI and EUR PMI releases may introduce repricing risk during the week.
| Price at last update | 1.97655 as of 21 Oct 2026 08:05 GMT+3 |
|---|---|
| Completed D1 reference close | 1.97976 as of 19 October 2026 |
| Primary support | 1.95154 |
| Secondary support | 1.94430 |
| Primary resistance | 1.99039 |
| Bullish targets | 1.99663, 2.0019 |
| Bearish targets | 1.9443 |
| Formal weekly thesis invalidation | Upper 1.99039 — One completed D1 close above 1.99039 formally invalidates the bearish weekly thesis. |
Live EUR/NZD Tools
A forecast is a snapshot. These pages keep moving with the market.
- Live
Live chart & price
Watch EUR/NZD move tick by tick. Flip from the 1-minute chart to the monthly, with trading conditions right alongside.
- Live
Technical signals
Buy, sell or sit it out? Oscillators, moving averages and pivot points boiled down to one clear reading, updated live.
Economic calendar
Know what's coming before it hits the price: every scheduled release with impact, forecast and actual.
Historical data
Open, high, low and close on any timeframe from 1 minute to monthly. Test your idea, then download the data.
All EUR/NZD forecasts
Every weekly outlook in one place. Scroll back to see how earlier calls played out against the chart.
EUR/NZD Fundamental Drivers This Week
Scheduled economic events relevant to EUR/NZD during 18–24 October 2026 include CPI q/q, French Flash Manufacturing PMI, French Flash Services PMI. Directional impact depends on the released data relative to supplied expectations.
Scroll table sideways for more columns →
| Event | Scheduled | Importance | Consensus | Previous |
|---|---|---|---|---|
| CPI q/q | 22 Oct 2026 00:45 GMT+3 | High | 0.8% | 1.5% |
| French Flash Manufacturing PMI | 23 Oct 2026 10:15 GMT+3 | Medium | 50.6 | 50.3 |
| French Flash Services PMI | 23 Oct 2026 10:15 GMT+3 | Medium | 50.8 | 51.4 |
| German Flash Manufacturing PMI | 23 Oct 2026 10:30 GMT+3 | Medium | 53.5 | 53.8 |
Current EUR/NZD Price and Weekly Market Context
The D1 bearish trend is the controlling weekly signal: the 1.97976 close is below the supplied daily moving averages and primary resistance at 1.99039. Negative momentum and falling EMA50 and SMA200 slopes reinforce that structure, although the mixed close sequence cautions against assuming a smooth continuation. H4 is bearish and adds tactical alignment, while stable volatility describes the trading environment rather than direction. Scheduled NZD and EUR releases may increase repricing risk around the established levels.
- D1 trendbearishClose vs 50 EMA and 200 SMA
- H4 tacticalbearishH4 close vs 20 and 50 EMA
- MomentumnegativeRSI and MACD histogram
- VolatilitystableD1 ATR change
Is EUR/NZD Bullish or Bearish This Week?
The bearish case is supported by D1 trend, negative momentum, falling EMA50 and SMA200 slopes, and a bearish H4 backdrop. Mixed D1 closes temper immediate conviction; consolidation remains plausible, while a sustained shift in the daily structure would make the bearish path less relevant. The supplied downside reference is 1.9443, with 1.95154 as primary support.
Scenario 1 of 3Bullish reversal
- D1 confirmation
- A bullish alternative would require a completed D1 close above the supplied primary resistance at 1.99039, with subsequent daily price action showing that the move is more than a temporary countertrend test. Such development would conflict with the current bearish structure and falling moving-average slopes.
- H4 tactical signal
- H4 price action would need to move above the supplied H4 resistance at 1.98038 and develop toward the D1 primary resistance at 1.99039. This would be tactical evidence only; the weekly interpretation would remain controlled by D1 closes.
- Targets
- 1.99663, 2.0019
- Scenario failure condition
- Failure to hold above the supplied H4 resistance, followed by renewed downside pressure while D1 remains below 1.99039, would materially weaken the bullish alternative.
Scenario 2 of 3Base / neutral
- D1 confirmation
- A base case would be supported by continued mixed D1 closes without a completed close above 1.99039 or below 1.95154, leaving the daily structure unresolved within the supplied boundaries.
- H4 tactical signal
- H4 hesitation around its supplied support at 1.97624 and resistance at 1.98038, without directional follow-through, would fit a short-term two-sided phase rather than strengthen either directional scenario.
- Targets
- The supplied levels at 1.97624 and 1.98038 provide the immediate H4 context for a possible pause; the wider D1 reference boundaries are 1.95154 and 1.99039. These are scenario references, not a forecast of a fixed range.
- Scenario failure condition
- A completed D1 close beyond either supplied boundary, 1.95154 or 1.99039, would weaken the consolidation interpretation by resolving price action toward one of the directional scenarios.
Scenario 3 of 3Bearish continuation
- D1 confirmation
- The bearish case would gain structural support from a completed D1 close below the supplied primary support at 1.95154, particularly if negative momentum remains in place. The next supplied downside reference is 1.9443.
- H4 tactical signal
- A move below the supplied H4 support at 1.97624 would add tactical evidence of renewed downside pressure, but would not by itself confirm a weekly structural break; D1 remains controlling.
- Targets
- 1.9443
- Scenario failure condition
- A completed D1 close above 1.99039 would materially weaken the bearish scenario by moving price above the supplied primary resistance and formal upper boundary.
EUR/NZD D1 Outlook and H4 Technical Triggers
The daily timeframe controls the weekly thesis. H4 evidence is used only for earlier confirmation, tactical warning and scenario-failure context. Complete live H4, H1 and intraday readings remain on the Technical page.
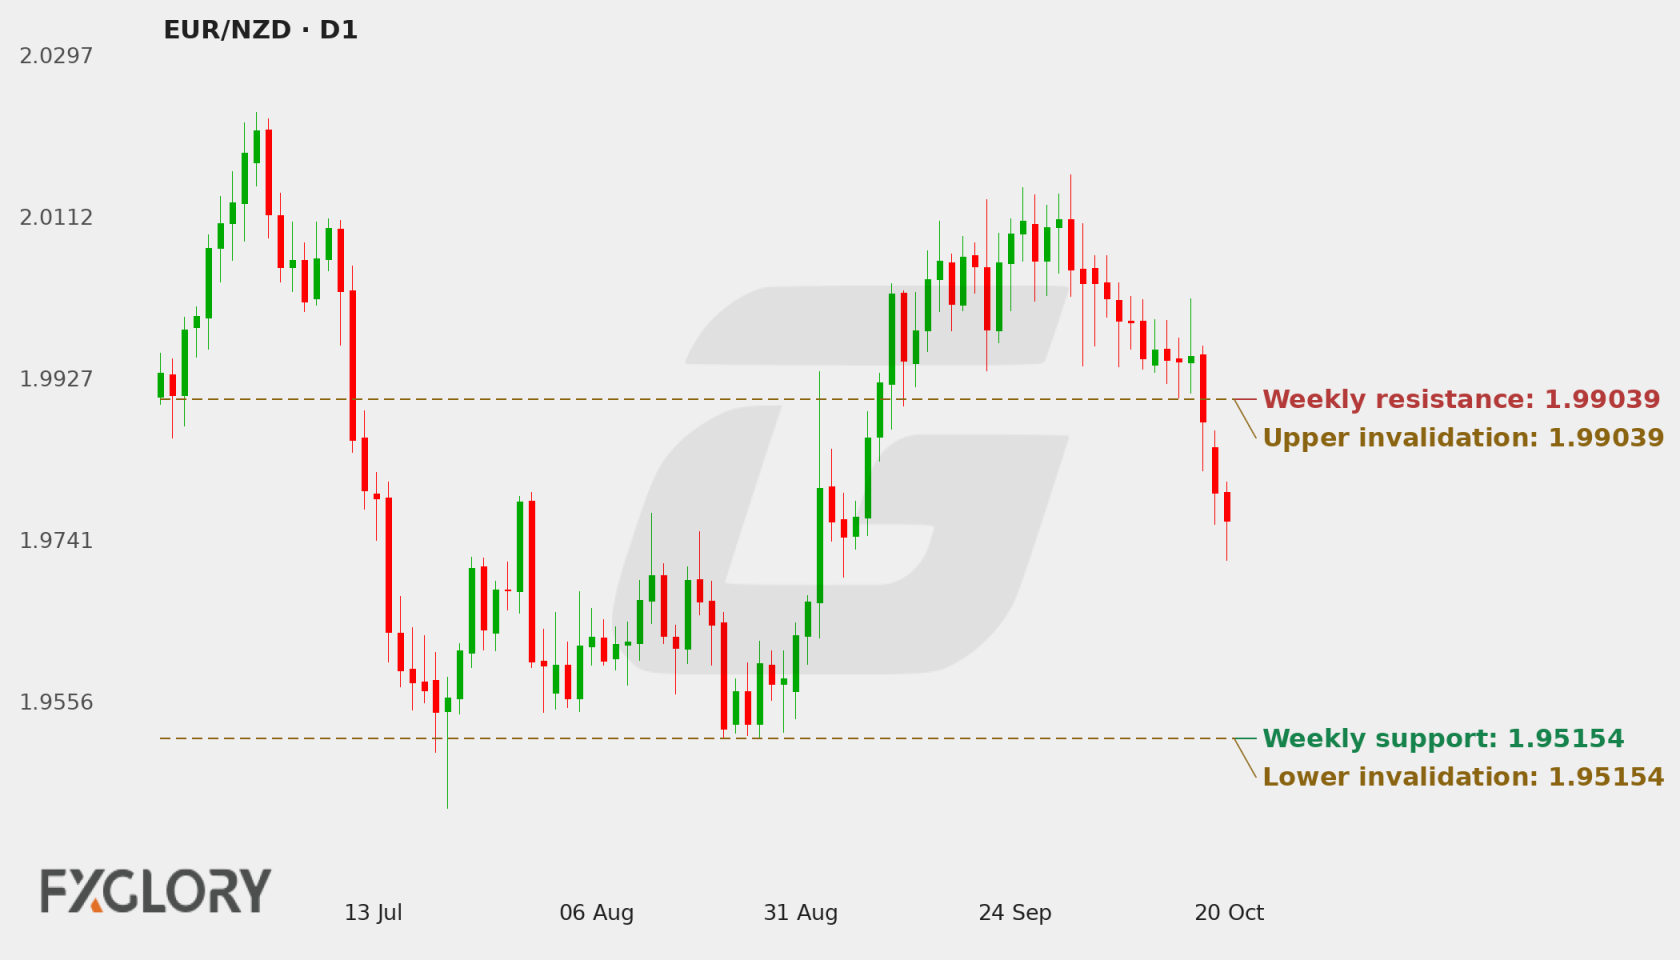
D1 Price Action and Market Structure
The D1 close at 1.97976 is below the daily EMA20 at 1.9955, EMA50 at 1.99058 and SMA200 at 1.98383, while the supplied EMA50 and SMA200 slopes are falling. This places price beneath the listed trend references and aligns with the bearish D1 state. MACD and its histogram are negative, supporting downside momentum, but the mixed close sequence is a counterweight: the evidence supports a bearish weekly framework without establishing uninterrupted continuation. Primary resistance at 1.99039 and primary support at 1.95154 define the key supplied boundaries.
H4 Tactical Triggers
H4 shares the bearish direction, with the 1.97964 close below its EMA20 at 1.98649 and EMA50 at 1.99225; its MACD histogram is also negative. RSI at 33.63 is consistent with weak momentum but does not determine whether price will extend or pause. The H4 support at 1.97624 and resistance at 1.98038 frame near-term tactical context. H4 alignment supports, rather than independently establishes, the D1 weekly thesis.
Technical Indicators at a Glance
Automated technical summary
The technical configuration is bearish on D1 and H4, with negative MACD readings and falling daily EMA50 and SMA200 slopes. The D1 close below its supplied moving averages reinforces the trend assessment, while mixed daily closes qualify the consistency of price action. Stable volatility does not imply direction; scheduled NZD and EUR events add potential repricing risk.
Selected snapshot: D1 with H4 tactical context. Updated 21 October 2026.
- RSI33.54Neutral
- MACDBelow signalBearish
- Bollinger BandsOutside bandBelow lower band
- Moving averagesBelow bothBearish
- ATR102.3 pipsStable
RSI (14)
Neutral
H4 33.63
The D1 and H4 RSI readings are in the low-to-mid 30s, consistent with weak momentum alongside the bearish trend. RSI alone does not establish a reversal or determine the timing of further movement.
- D1 RSI
- 33.54
- H4 RSI
- 33.63
MACD (12, 26, 9)
Bearish momentum
Negative D1 MACD and histogram readings support the bearish daily structure. H4 MACD and histogram are also negative, adding tactical alignment rather than a separate weekly signal.
- MACD
- -0.000664
- Signal
- 0.002672
- Histogram
- -0.003336
Bollinger Bands (20, 2σ)
Below lower band
Striped ends = price outside the bands.
The D1 close is below the supplied lower Bollinger value, while the H4 close is between its lower and middle values. This indicates different placement across the bands by timeframe, adding caution about assuming immediate synchronized follow-through; band position alone does not establish a direction or outcome.
- Position in band
- 50.2 pips below lower
- Band width
- 313.7 pips (1.57%)
Moving averages (D1)
Bearish structure
- 50 EMA falling1.99058Price is 108.2 pips below (-0.54%)
- 200 SMA falling1.98383Price is 40.7 pips below (-0.21%)
The D1 close is below EMA20, EMA50 and SMA200, and the supplied EMA50 and SMA200 slopes are falling. This is a notable structural confirmation of the bearish trend. H4 also closes below its EMA20 and EMA50, reinforcing the tactical alignment.
- D1 close
- 1.97976
- 50 EMA
- 1.99058
- 200 SMA
- 1.98383
ATR (14)
Stable volatility
One ATR either side of the latest close. A measure of move size, not a price target.
Volatility is classified as stable. ATR contextualizes the trading environment and potential pace of level tests, but provides no directional signal; event-driven repricing could still affect the observed pace.
- D1 ATR
- 0.01023 (0.52%)
- H4 ATR
- 0.0042 (0.21%)
Technical conclusion: The D1 case is bearish because price is below the supplied daily moving averages, their longer-term slopes are falling, and momentum is negative; bearish H4 conditions add tactical support. The strongest qualification is the mixed D1 close sequence, which leaves room for consolidation or countertrend movement. The supplied primary support at 1.95154 and primary resistance at 1.99039 are the key weekly boundaries, with 1.9443 the listed bearish reference beyond support.
View all live EUR/NZD oscillators, moving averages, pivot points and timeframe signals.
EUR/NZD Weekly Support, Resistance and Invalidation
| Level | Role | Timeframe | Why it matters |
|---|---|---|---|
| 1.95154 | Primary support | D1 | The supplied primary support and lower structural boundary; a completed D1 close below it would strengthen the bearish scenario, with 1.9443 the supplied next downside reference. |
| 1.9443 | Secondary support and bearish reference target | D1 | This is the supplied secondary support and bearish target reference, below primary support. |
| 1.99039 | Primary resistance | D1 | A completed D1 close above this supplied resistance would materially weaken the bearish framework and meet its formal upper boundary. |
| 1.99663 | Secondary resistance and bullish reference target | D1 | This supplied level is the secondary resistance and first listed bullish reference target; it is relevant if price develops above primary resistance. |
| 2.0019 | Additional resistance and bullish reference target | D1 | This supplied resistance is the second listed bullish reference target and extends the alternative upside framework. |
| 1.97624 | H4 support | H4 | The supplied tactical support helps frame whether H4 downside pressure is developing; it does not substitute for D1 structural confirmation. |
| 1.98038 | H4 resistance | H4 | The supplied tactical resistance marks a nearby H4 reference for countertrend pressure or hesitation, subordinate to the D1 framework. |
These are forecast-specific market-structure levels. Formula-based Classic, Fibonacci and Camarilla pivots remain on the Technical page.
Economic News & Events to Watch for EUR/NZD This Week
Selected events may increase EUR/NZD volatility. Direction depends on the released value relative to consensus and previous results.
Scroll table sideways for more columns →
| Event | Date and time | Importance | Previous | Consensus |
|---|---|---|---|---|
| CPI q/q | 22 Oct 2026 00:45 GMT+3 | High | 1.5% | 0.8% |
| French Flash Manufacturing PMI | 23 Oct 2026 10:15 GMT+3 | Medium | 50.3 | 50.6 |
| French Flash Services PMI | 23 Oct 2026 10:15 GMT+3 | Medium | 51.4 | 50.8 |
| German Flash Manufacturing PMI | 23 Oct 2026 10:30 GMT+3 | Medium | 53.8 | 53.5 |
Calendar source: FXGlory economic calendar. Retrieved 20 Oct 2026 05:10 GMT+3. View the complete EUR/NZD economic calendar.
EUR/NZD Outlook for 18–24 October 2026
The weekly technical balance favors the downside: D1 is bearish, price is below the supplied daily moving averages, the EMA50 and SMA200 slopes are falling, and MACD momentum is negative. Bearish H4 conditions reinforce this alignment, while stable volatility offers no directional signal and mixed daily closes caution against treating follow-through as assured.
The supplied primary support at 1.95154 frames the first key downside structural test, with 1.9443 as the listed bearish reference; primary resistance at 1.99039 is the formal upper boundary for the bearish thesis. NZD CPI and EUR PMI releases may introduce repricing risk around those levels. The alternative paths remain conditional on completed D1 price action rather than intraday movement.
Weekly Forecast Risks and What Would Change the Outlook
- Mixed daily close sequence: It weakens the case for assuming consistent D1 follow-through despite the bearish trend and negative momentum.
- Timeframe-sensitive tactical movement: H4 is bearish, but its supplied support and resistance can frame hesitation or countertrend pressure; H4 movement alone does not establish the weekly D1 thesis.
- Scheduled NZD and EUR data: The high-impact NZD CPI and medium-impact EUR PMI releases may add volatility or repricing risk around the supplied technical levels, with no release result or direction assumed.
- Stable volatility classification: Stable volatility does not point directionally and does not rule out faster movement around scheduled events.
Formal weekly invalidation: The bearish weekly thesis is formally invalidated by one completed D1 close above 1.99039. One completed D1 close below 1.95154 confirms lower structural extension and continuation.
EUR/NZD Weekly Forecast FAQs
Is EUR/NZD bullish or bearish this week?
The weekly bias is bearish because the D1 trend and momentum are negative, with falling EMA50 and SMA200 slopes. Mixed daily closes remain a meaningful qualification.
What scenario would strengthen for EUR/NZD this week?
The bearish scenario remains more relevant while D1 structure and negative momentum persist; a completed D1 close below the supplied support area would strengthen that case, while a move back above resistance would weaken it. A sideways response around the current reference area would instead keep two-sided risk in focus.
What are the key EUR/NZD support and resistance levels?
The principal supplied levels are support at 1.95154 and 1.9443, and resistance at 1.99039 and 1.99663. The bearish reference target supplied is 1.9443; these levels frame scenarios rather than predict an outcome.
What would invalidate this EUR/NZD forecast?
The bearish weekly thesis is formally invalidated by one completed D1 close above 1.99039.
Methodology, Data and Sources
- Price-data source: FXGlory price feed (EURNZD)
- Live quote timestamp: 21 Oct 2026 08:05 GMT+3
- Weekly analysis timestamp: 18 October 2026
- Chart timestamp: 21 October 2026 (redrawn daily)
- Technical snapshot timestamp: 18 October 2026
- Calendar-data source: FXGlory economic calendar
- Calendar retrieval timestamp: 20 Oct 2026 05:10 GMT+3
- Candle convention: FXGlory D1 and H4 candles; D1 candle dates are evaluated in UTC and invalidation uses completed D1 closes only.
- Indicator settings: D1 RSI(14), MACD(12,26,9), Bollinger Bands(20,2), EMA(50), SMA(200), ATR(14); H4 RSI/MACD/Bollinger/EMA/ATR.
- Level-selection method: Weekly D1 support/resistance levels are structural market levels. Formal invalidation uses a hard 1.00× D1 ATR(14) minimum anchor distance plus a 0.00× D1 ATR(14) outward buffer; H4 levels are tactical only.
- Weekly forecast method: D1 controls the weekly thesis; H4 supplies tactical confirmation/warning only.