EURNZD Forecast

EUR iconNZD icon
EUR/NZD

Euro vs New Zealand Dollar

EUR/NZD Live Price

1.99517
+0.24%

EUR/NZD Forecast — 24 February 2025

Time Zone: GMT +2

Time Frame: 4 Hours (H4)

Fundamental Analysis:

The EURNZD pair is experiencing market volatility as traders react to key economic data from both the Eurozone and New Zealand. The IFO Business Climate Index from Germany, a leading indicator of economic sentiment, is expected to provide insights into the strength of the European economy. A better-than-expected reading could boost the Euro (EUR), while a weaker-than-expected outcome may pressure the currency. Additionally, the upcoming Core CPI and CPI reports from the Eurozone will significantly impact inflation expectations and influence the European Central Bank’s (ECB) monetary policy outlook.

On the New Zealand dollar (NZD) side, recent Retail Sales and Core Retail Sales reports reflect consumer spending trends. Since these are lagging indicators, their impact may be limited unless there is a significant deviation from expectations. The Reserve Bank of New Zealand (RBNZ) continues to monitor inflationary pressures, and upcoming credit card spending data will provide further clues on consumer activity. If the data signals a robust retail environment, the NZD may gain strength.

Price Action:

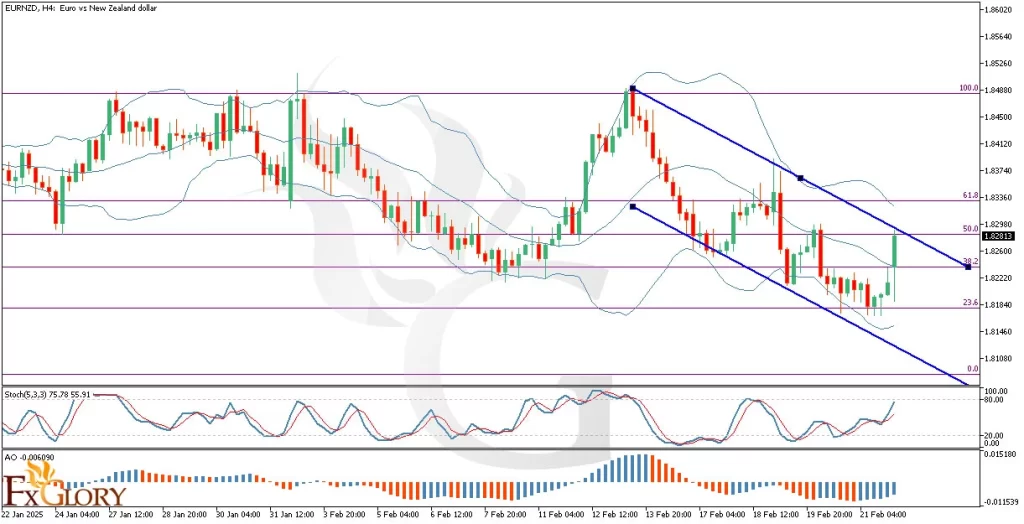
The EURNZD pair has been in a downward channel since reaching a peak in mid-February. However, the last four candles have been bullish, indicating a potential short-term reversal or correction. The price has swiftly moved from the lower Bollinger Band to the upper band, breaking through the middle band in a single strong bullish move. Additionally, the EUR NZD price is currently testing the 50% Fibonacci retracement level, which serves as a key decision point for traders. If buyers maintain momentum, the next resistance level could be challenged. Conversely, if selling pressure resumes, the downtrend may continue.

Key Technical Indicators:

Bollinger Bands: The EURNZD price has moved from the lower Bollinger Band to the upper band, signaling increased volatility and a potential breakout from the bearish channel. Despite the overall downtrend, this sudden price spike suggests that bulls are regaining some control. If the price holds above the middle band, further bullish movement could be expected.

Stochastic Oscillator (Stoch 5,3,3): The Stochastic Oscillator is currently near the 75-80 zone, indicating that momentum has shifted towards the bulls. This suggests that the EUR/NZD pair might enter overbought territory soon. However, if the %K and %D lines cross downwards from these levels, a potential pullback may occur.

Awesome Oscillator (AO): The AO histogram has transitioned from deep red to light blue, indicating weakening bearish momentum. While the histogram remains negative, the current trend suggests that bullish pressure is increasing. If the AO crosses above the zero line, it would confirm a stronger upside move.

Support and Resistance Levels:

Support: The nearest support level is at 1.8180, aligning with the 23.6% Fibonacci retracement level and recent lows. If the EURNZD price breaks below this level, further downside movement could follow.

Resistance: The immediate resistance is at 1.8290, corresponding to the 50% Fibonacci retracement level. A successful breakout above this level could lead to a test of 1.8330 (61.8% Fibonacci level).

Conclusion and Consideration:

The EURNZD H4 chart analysis suggests a potential short-term bullish correction within a broader downtrend channel. The recent bullish momentum, reflected in Bollinger Bands, Stochastic Oscillator, and AO, highlights a possible upside continuation if resistance levels are broken. However, traders should remain cautious as the overall trend remains bearish unless a significant breakout occurs. Key fundamental factors, including IFO Business Climate Index, CPI data from the Eurozone, and New Zealand’s retail sales, could drive volatility in the EUR-NZD pair. Traders should closely monitor these reports, as unexpected economic data could shift market sentiment rapidly.

Disclaimer: The analysis provided for EUR/NZD is for informational purposes only and does not constitute investment advice. Traders are encouraged to perform their own analysis and research before making any trading decisions on EURNZD. Market conditions can change quickly, so staying informed with the latest data is essential.

EURNZD-H4-Technical-and-Fundamental-Analysis-for-02.24.2025

EUR/NZD Forecast — 18 November 2024

Time Zone: GMT +2

Time Frame: 4 Hours (H4)

Fundamental Analysis

The EURNZD currency pair, reflecting the Euro (EUR) against the New Zealand Dollar (NZD), is influenced by contrasting central bank policies and economic developments. For the Euro, traders await ECB President Christine Lagarde’s upcoming speech, which may provide hints about inflation handling and potential policy adjustments. On the NZD side, cautious optimism prevails due to New Zealand’s steady economic performance, although the RBNZ remains wary of external global risks. Combined, these factors keep EUR/NZD in a sensitive position, with market participants awaiting new fundamental drivers to determine the pair’s direction.

Price Action

EURNZD shows short-term bullish momentum, with the last four candles indicating an upward movement within a broader bearish trend. The pair is trading between the 0% and 23.6% Fibonacci retracement levels, with the latter acting as a resistance zone. A breakout above this level could extend the recovery, while a rejection may lead to renewed bearish pressure toward support levels.

Key Technical Indicators

Ichimoku Cloud: The price remains below the Ichimoku Cloud, confirming the overall bearish sentiment. However, the narrowing Tenkan-sen (red line) and Kijun-sen (blue line) suggest growing bullish momentum in the short term. The cloud itself acts as a strong resistance above the current price levels.

MACD: The MACD is showing signs of a bullish crossover as the MACD line approaches the signal line, with a shrinking bearish histogram. This indicates weakening downward momentum, signaling a potential shift toward bullish sentiment.

Stochastic Oscillator: The Stochastic Oscillator, now exiting oversold territory near 31, signals potential for further upward movement. However, traders should watch for a slowdown as it approaches neutral or overbought levels.

Parabolic SAR: The Parabolic SAR dots are currently positioned above the candles, indicating bearish momentum in the broader trend. This aligns with the overall bearish sentiment, signaling potential resistance to further upside unless a breakout occurs.

Support and Resistance Levels

Support: Immediate support is at 1.7935, the 0% Fibonacci retracement level, which has been a strong barrier against further downside.

Resistance: Key resistance is at 1.8025, the 23.6% Fibonacci retracement level, where recent bullish attempts have faced rejection.

Conclusion and Consideration

EURNZD is displaying short-term bullish momentum, but the broader bearish trend remains intact. A sustained break above the 23.6% Fibonacci retracement level would strengthen the case for a continued bullish recovery toward 1.8100. Conversely, a failure to maintain upward momentum could lead to a drop back to 1.7935 or lower. Traders should monitor key technical levels and upcoming fundamental events, particularly speeches from ECB officials, for directional cues.

Disclaimer: The analysis provided for EUR/NZD is for informational purposes only and does not constitute investment advice. Traders are encouraged to perform their own analysis and research before making any trading decisions on EURNZD. Market conditions can change quickly, so staying informed with the latest data is essential.

EURNZDH4-H4_Daily_Technical_and_Fundamentan_Analysis_for_11_18_2024

EUR/NZD Forecast — 17 May 2024

Time Zone: GMT +3

Time Frame: 4 Hours (H4)

Fundamental Analysis:

The EURNZD pair reflects the exchange rate between the Euro and the New Zealand Dollar. Recent economic data from New Zealand shows the PPI Input at 0.7%, slightly above the forecast of 0.6%, and PPI Output at 0.9%, significantly above the forecast of 0.5%. These figures indicate stronger-than-expected producer prices, supporting the NZD currency. For the Euro currency, the Final Core CPI y/y is forecasted at 2.7% and the Final CPI y/y at 2.4%, reflecting mild inflationary pressures. While these figures suggest a stable economic environment in the Eurozone, their impact is expected to be low due to the nature of these data releases.

Price Action:

In the EURNZD technical analysis on H4 time frame, the EUR-NZD chart shows a clear downtrend, characterized by successive lower highs and lower lows. The price is currently consolidating near a recent low, suggesting potential for either a continued downward move or a short-term rebound. The bearish candles indicate strong selling pressure, and a break below the current support level could signal further declines.

Key Technical Indicators:

Bollinger Bands: The Bollinger Bands have widened and continue to widen, indicating increased volatility. The price is currently near the lower band, which suggests potential oversold conditions and a possible bounce.

MACD: The MACD line is below the signal line and in negative territory, indicating bearish momentum. The histogram shows increasing bearish divergence, suggesting that the downtrend may continue.

RSI: The RSI is at 33.55, which is approaching the oversold zone. This indicates that the pair might be due for a short-term correction or consolidation before continuing its downtrend.

Support and Resistance:

Support: The immediate support level is at 1.7748, which is a recent low. A break below this level could lead to further declines towards 1.7700.

Resistance: The immediate resistance level is at 1.7864 (23.6% Fibonacci retracement level). The next significant resistance is at 1.7900 (38.2% Fibonacci retracement level).

Conclusion and Consideration:

The EURNZD chart analysis shows a strong bearish trend on the H4 chart, as indicated by the widening Bollinger Bands and the bearish MACD signal. While the RSI suggests the pair is approaching oversold conditions, the overall EURNZD technical outlook remains bearish. Traders should monitor the support level at 1.7748 closely; a break below this level could signal further declines. Conversely, if the pair bounces, the resistance levels at 1.7864 and 1.7900 should be watched for potential selling opportunities. Given the current market conditions and economic data, traders should exercise caution and implement proper risk management strategies.

Disclaimer: The provided analysis is for informational purposes only and does not constitute investment advice. Traders should conduct their own research and analysis before making any trading decisions.

EURNZD-H4-Daily-Technical-Analysis--For-05.17

EUR/NZD Forecast — 20 February 2024

Time Zone: GMT +2

Time Frame: 4 Hours (H4)

Fundamental Analysis:

The EURNZD currency pair reflects the economic dynamics between the Eurozone and New Zealand, encompassing factors like the European Central Bank’s (ECB) monetary policies, Eurozone economic health, and New Zealand’s export data, among others. The Euro is influenced by fiscal developments within the EU and broader geopolitical issues affecting the region. The New Zealand Dollar often reacts to changes in commodity prices, especially dairy products, and the Reserve Bank of New Zealand’s (RBNZ) interest rate decisions.

Price Action:

The H4 chart shows a downtrend with the price movement currently in a bearish phase for EURNZD. The latest candles are bearish, suggesting increased selling pressure. The price has recently crossed below the middle Bollinger Band, indicating a potential continuation of the downward trend.

Key Technical Indicators:

Bollinger Bands: The price is breaking towards the lower Bollinger Band, which typically indicates bearish sentiment. The width of the bands suggests increasing volatility.

MACD: The MACD histogram is below the zero line, and the signal line is above the MACD line, further confirming bearish momentum.

RSI: The RSI is below 50, indicating bearish momentum. However, it is not yet in the oversold region, suggesting there may still be room for downward movement.

Support and Resistance:

Support: The nearest support level is likely around the lower Bollinger Band, with a further support level possibly forming at the recent low.

Resistance: Immediate resistance is around the middle Bollinger Band, followed by the upper band which may coincide with previous price peaks.

Conclusion and Consideration:

The EURNZD pair shows a bearish trend on the H4 chart, with the Bollinger Bands, MACD, and RSI all signaling a continuation of the current downward momentum. Traders should watch for any economic updates from the Eurozone and New Zealand that could affect the pair’s movement. Due to the observed volatility, a cautious approach with solid risk management would be prudent.

Disclaimer: This analysis is for informational purposes only and should not be construed as investment advice. Market conditions can change rapidly, and traders are advised to conduct their own research before making any financial decisions.

EUR/NZD Forecast — 29 November 2023

Time Zone: GMT +2

Time Frame: 4 Hours (H4)

Fundamental Analysis:

The EURNZD pair reflects the economic interaction between the Eurozone and New Zealand, where trade balance, relative interest rates, and commodity prices, especially dairy for New Zealand and economic health indicators for the Eurozone, play significant roles. The recent price movement could be reacting to the Eurozone’s monetary policy adjustments or shifts in New Zealand’s export volumes. Analysts should factor in the potential impact of COVID-19 recovery paths and the differing fiscal stimuli, which could lead to volatility in the pair’s exchange rate.

Price Action:

The EURNZD H4 chart displays a descending trend with bearish momentum, as indicated by the series of lower highs and lower lows. The recent price bars show an attempt to stabilize, suggesting a possible pause or reversal of the current downtrend. The market sentiment may be shifting, which is crucial for traders to monitor for confirmation of trend continuation or reversal.

Key Technical Indicators:

OsMA: The OsMA shows a consistent reading below the zero line, indicating bearish momentum, but the decreasing depth of the bars could signal a slowdown in downward pressure.

Parabolic SAR: The dots positioned above the price action denote a bearish trend; however, the recent contraction in distance between the dots and the price suggests the downtrend is losing strength.

Support and Resistance:

Resistance: The key resistance can be identified near the 1.8300 zone, which has acted as a barrier for price advances in the past.

Support: The immediate support level is around 1.7920, where the price has shown some rebound.

Conclusion and Consideration:

The technical analysis of the EURNZD on the H4 chart suggests a bearish trend with signs of potential exhaustion as the price attempts to stabilize. While the OsMA indicates ongoing bearish momentum, the Parabolic SAR hints at a weakening trend. Traders should approach with caution, considering the possibility of a trend reversal or pullback, and keep an eye on upcoming fundamental releases that could impact the Euro and New Zealand dollar, paying particular attention to the established support and resistance levels.

Disclaimer: This analysis is for informational purposes only and is not intended as investment advice. Trading involves risks and it is recommended that individuals conduct their own research and consult with financial advisors before making trading decisions.

1EUR = –––NZD –––%
EURNZD
Loading chart...