
Forex ZigZag Strategy Overview
A forex ZigZag strategy uses the ZigZag indicator to simplify price action into confirmed swing highs and swing lows. Traders often use those swings to label trend structure, draw support and resistance, place Fibonacci retracements, or watch for double tops and double bottoms.
The problem is that the ZigZag indicator is not a real-time turning-point signal. A swing high or swing low is confirmed only after price has already reversed by the chosen threshold. That means a serious zigzag forex trading strategy must separate the original pivot candle from the later confirmation candle.
Risk note: This article is educational research, not trading advice, investment advice, or an FXGlory signal. The backtest uses public yfinance 1H OHLC data, not FXGlory live execution data. It does not model leverage, live spreads, swaps, rejected orders, latency, or margin calls. Results are measured in R only.
60-Second Answer: Did The Forex ZigZag Strategy Work?
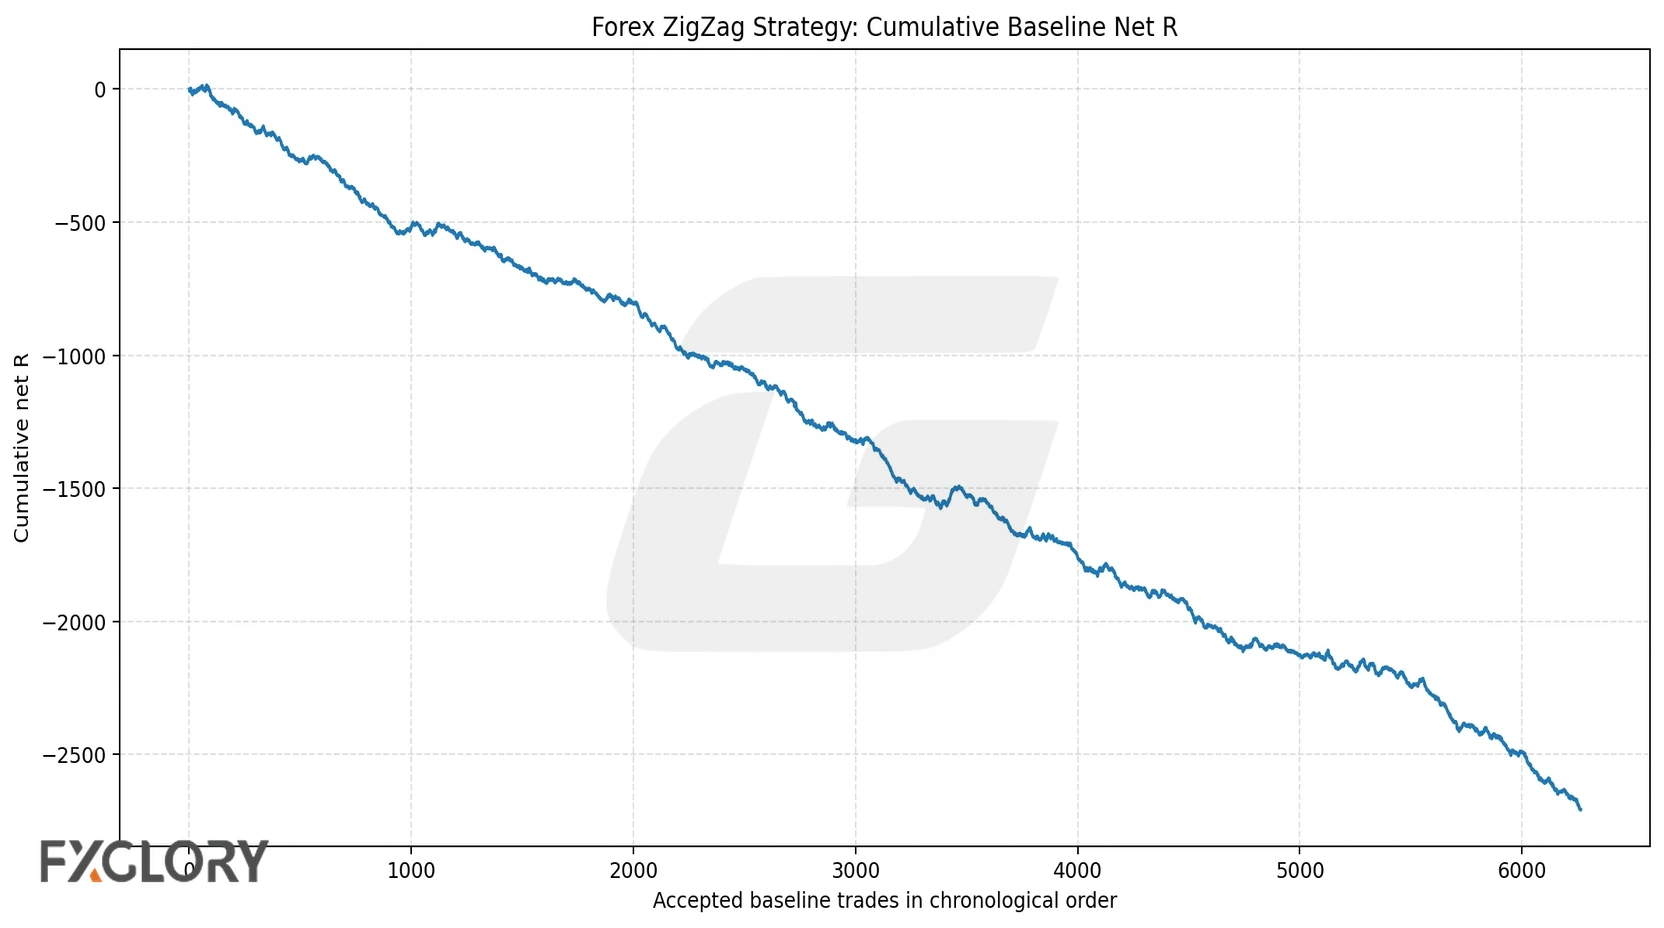
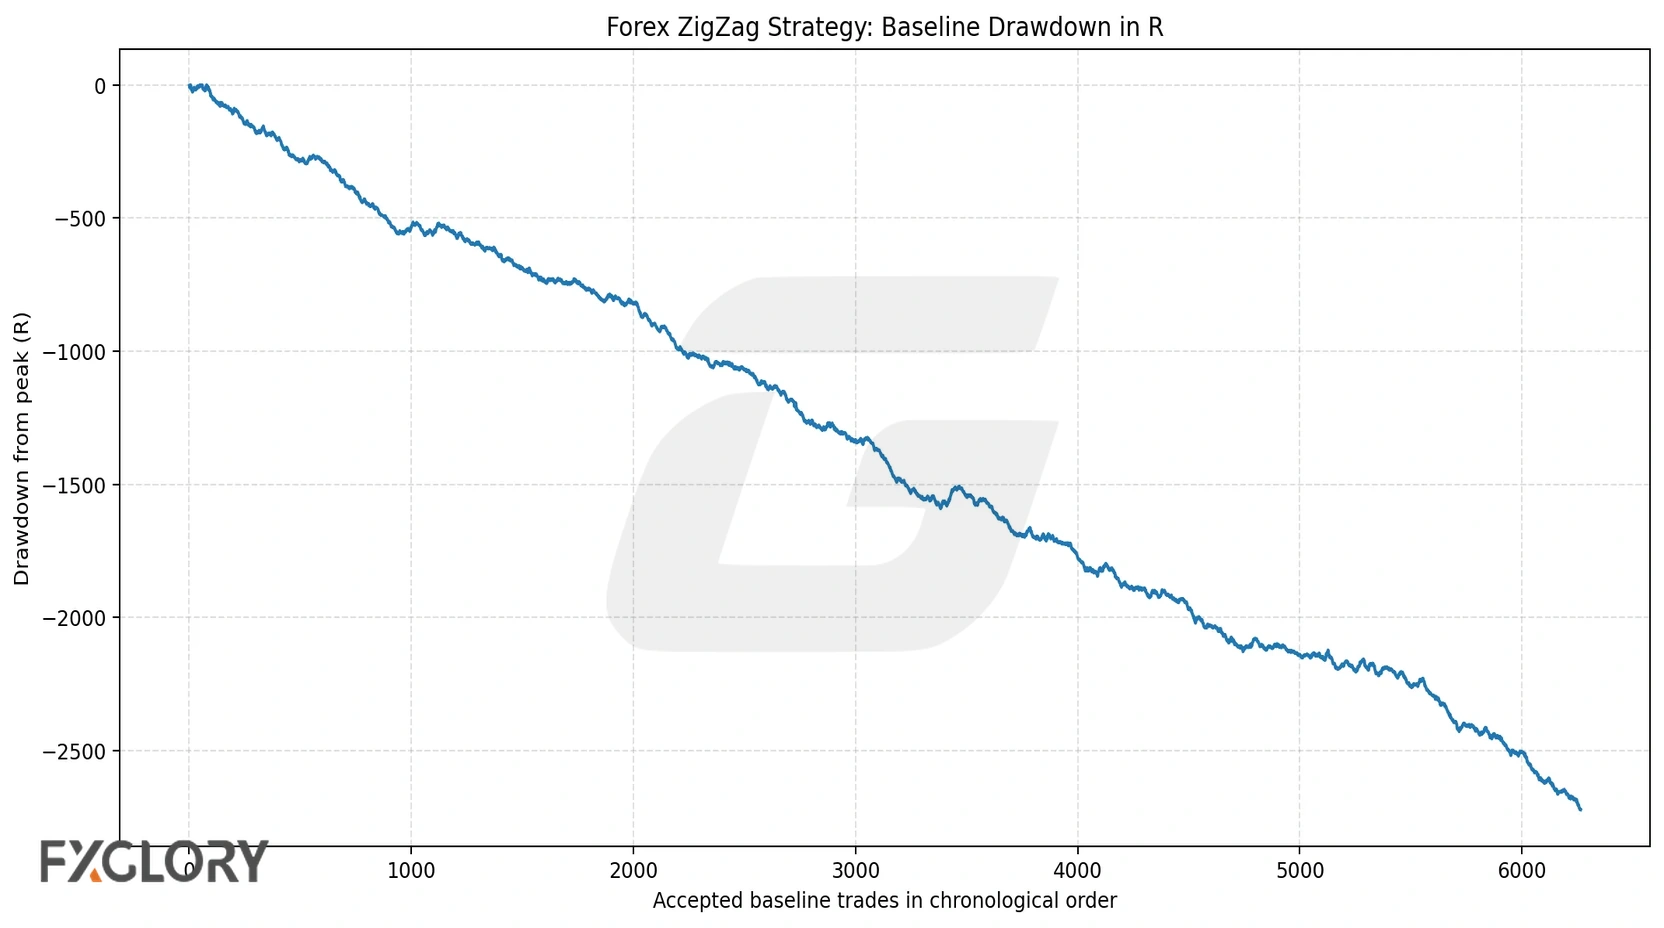
In FXGlory's educational test, the baseline confirmed-pivot forex ZigZag strategy did not work as a standalone mechanical strategy. Across 6,264 accepted baseline trades, the model produced a 41.84% win rate, -0.1508R expectancy, 0.7459 profit factor, -944.8230R total net R, and -961.1716R maximum drawdown.
| Metric | Baseline Result |
|---|---|
| ZigZag setting | 0.35% confirmed pivot threshold |
| Accepted trades | 6264 |
| Win rate | 41.84% |
| Expectancy | -0.1508R |
| Profit factor | 0.7459 |
| Total net R | -944.8230R |
| Maximum drawdown | -961.1716R |
| Worst losing streak | 14 |
The least negative setup was ZigZag trend-continuation breakout at -0.0542R expectancy. The weakest setup was ZigZag support/resistance rejection at -0.2071R expectancy. The honest takeaway is simple: the forex ZigZag indicator can help map confirmed structure, but the tested ZigZag entries did not survive as standalone trading systems.
What The ZigZag Indicator Really Shows
The ZigZag indicator filters smaller market noise by connecting price swings only after price moves by a chosen percentage, point distance, or platform-specific setting. On a clean chart, it can make trend structure easier to see because it highlights the major swing highs and swing lows.
That makes the ZigZag useful for structure work. It can help traders review higher highs, higher lows, lower highs, lower lows, double tops, double bottoms, broad support and resistance, and swing anchors for Fibonacci tools. For broader indicator context, compare this with forex indicator strategies, where indicators are treated as decision aids rather than complete trade systems.
ZigZag is a map, not a signal
The key distinction is timing. A finished ZigZag line looks obvious after the fact, but a trader did not know the pivot was confirmed at the original turning candle. This is why a tested forex ZigZag strategy must wait for confirmation before acting.
How To Add And Set The ZigZag Indicator On MT4, MT5, Or TradingView-Style Charts
Most traders who search for a forex ZigZag indicator strategy also want to know how the tool is applied on a real chart. The exact menu names depend on the platform and broker build, but the workflow is usually simple: open the chart, open the indicator list, search for ZigZag, add it to the chart, choose the swing-sensitivity settings, and save the template before testing any strategy rules.
| Platform Type | Typical Workflow | Important Caution |
|---|---|---|
| MT4 | Open the indicator list and look for ZigZag under Custom or Examples, depending on the terminal build. | Do not assume a historical ZigZag turning point was known at that candle. Check when the swing was confirmed. |
| MT5 | Open the indicator list and search for ZigZag or add it from the platform's example/custom indicators area. | Depth, Deviation, and Backstep settings can change the number and timing of pivots. |
| TradingView-style platforms | Open Indicators, search for Zig Zag or ZigZag, then review the available depth, deviation, reversal, or percent settings. | Different scripts can define ZigZag swings differently, so settings are not always one-to-one across platforms. |
On FXGlory's platform ecosystem, traders commonly use charting platforms such as MetaTrader-style tools or WebTrader-style access for chart review. The ZigZag indicator itself is only a charting layer. It does not place trades, manage risk, or decide whether the spread and stop distance make sense.
Depth, Deviation, And Backstep Explained
Many ZigZag tools use settings called Depth, Deviation, and Backstep. The names sound precise, but their exact implementation can differ across platforms and indicator scripts.
| Setting | Plain-English Meaning | Strategy Risk |
|---|---|---|
| Depth | The minimum number of bars used to look for a swing high or swing low. | More depth can make swings cleaner but later. Less depth can create more noise. |
| Deviation | The minimum price movement needed before a new ZigZag leg is accepted. | Smaller deviation gives more pivots and more trades. Larger deviation gives fewer but later pivots. |
| Backstep | The minimum spacing between nearby swing points. | If too small, pivots can cluster. If too large, valid smaller swings may disappear. |
This FXGlory test did not claim to clone every MT4, MT5, or TradingView ZigZag script. It used an online percent-deviation ZigZag proxy with 0.25%, 0.35%, and 0.50% confirmation thresholds so the rules could be tested consistently across six forex pairs.
How To Read ZigZag Without Fooling Yourself
- A rising ZigZag leg means the latest confirmed leg is pointing up, not that the next candle must rise.
- A falling ZigZag leg means the latest confirmed leg is pointing down, not that the next candle must fall.
- Higher confirmed highs and higher confirmed lows can describe an up-structure.
- Lower confirmed highs and lower confirmed lows can describe a down-structure.
- The most recent leg can change until it is confirmed, so it should not be used as a fixed trade signal.
Any ZigZag strategy that enters at the historical pivot candle without proving when that pivot was confirmed is likely using hindsight.
The ZigZag Repainting Problem
The biggest danger with the ZigZag indicator is lookahead bias. A chart can show a perfect swing high after price has already reversed, but that swing high was not confirmed at the high. If a backtest enters at that high or low, the result is using information the trader did not have yet.
In this study, a pivot became usable only after price moved far enough away from it to confirm the swing. The final unconfirmed ZigZag leg was excluded. That makes the test stricter, but much more honest.
- Do not treat the latest ZigZag leg as fixed while it is still forming.
- Do not enter at a historical pivot candle unless the pivot was already confirmed at that time.
- Do not redraw swing anchors after a trade fails just to make the setup look cleaner.
- Do not use ZigZag alone as a buy or sell signal.
How To Use ZigZag Without Lookahead Bias
A repainting-safe ZigZag approach needs a strict sequence:
- Choose the ZigZag threshold before the test.
- Wait for a swing high or swing low to be confirmed.
- Use only pivots with confirmation times before the entry trigger.
- Enter after a separate trigger, not at the original pivot candle.
- Place the stop and target from information already available at entry.
- Record costs, exit reason, holding time, and net R.
This turns a visual zig zag forex idea into a testable framework. It also explains why many attractive ZigZag chart examples are not realistic: they rely on a swing that was visible only after the reversal had already happened.
Five Forex ZigZag Strategy Setups Tested
The test compared five common ways traders try to convert the forex ZigZag indicator into entries and exits.
1. ZigZag Trend-Continuation Breakout
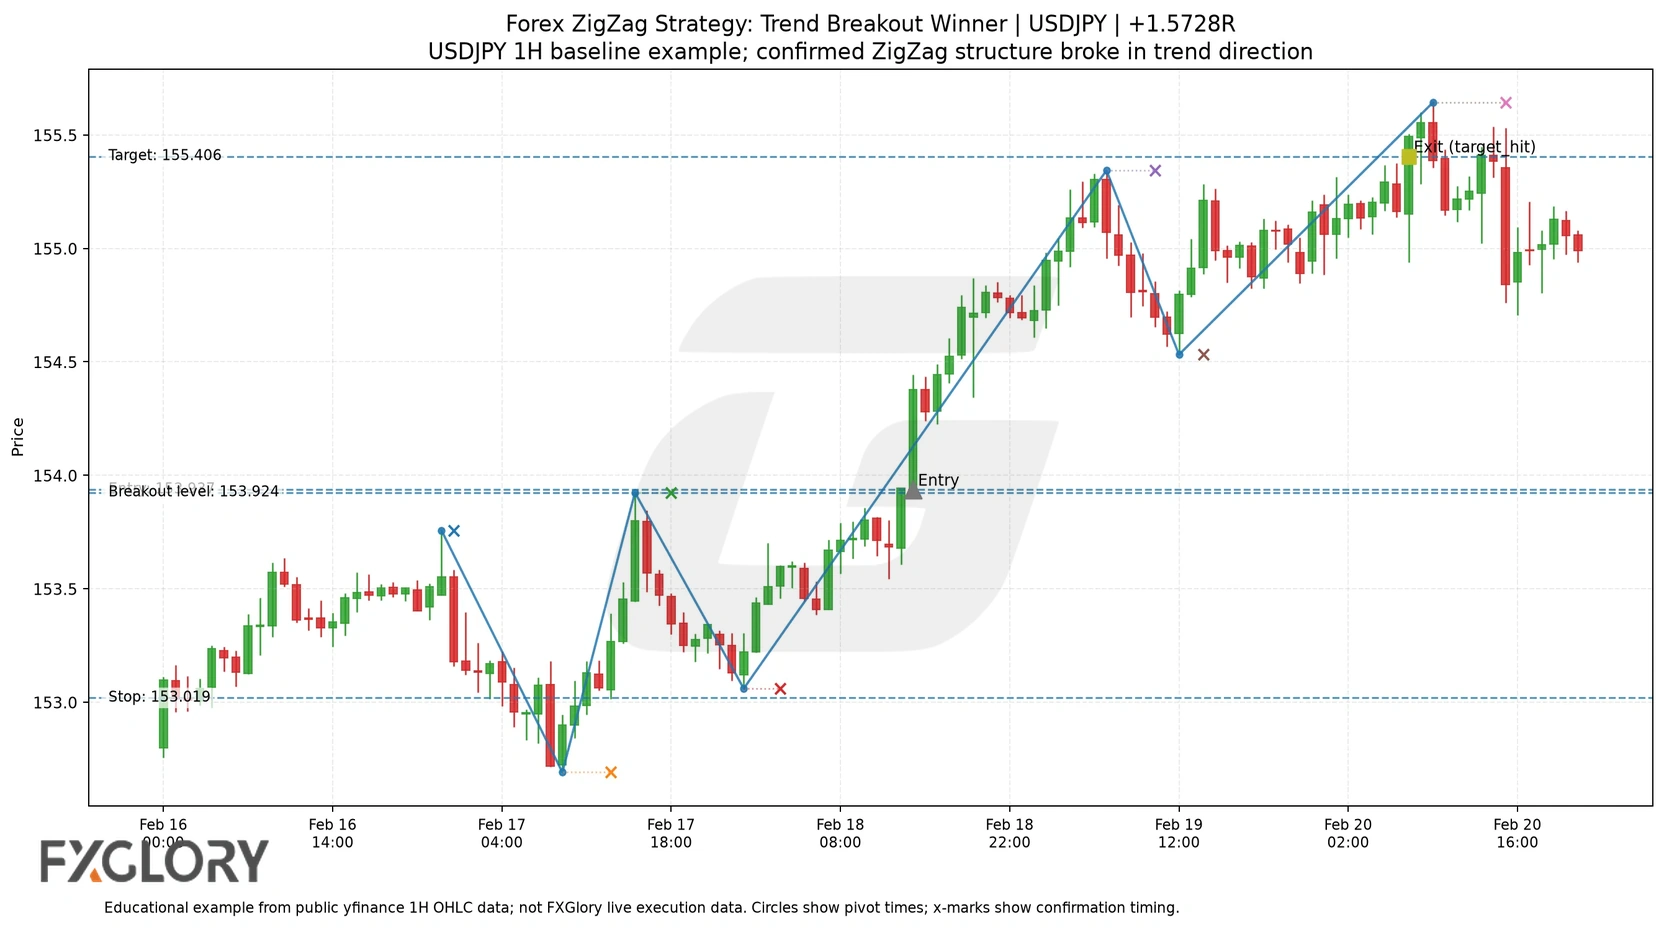
This setup waited for confirmed higher-high/higher-low or lower-high/lower-low structure, then entered after a break beyond the latest confirmed swing in the trend direction.
- Long idea: confirmed up-structure, then break above the prior confirmed swing high.
- Short idea: confirmed down-structure, then break below the prior confirmed swing low.
- Stop: beyond the most recent confirmed opposite swing.
- Target: fixed R target based on entry risk.
The chart below shows a repainting-safe trend-breakout example from the baseline test. The original swing points were not treated as tradable until the ZigZag pivot was confirmed, and the entry came only after the breakout trigger.
2. ZigZag Pullback Continuation
This setup used confirmed swing structure to find a pullback, then waited for price to resume in the original direction. It is similar to a price-action pullback model, but the swing points come from confirmed ZigZag pivots.
3. ZigZag Support/Resistance Rejection
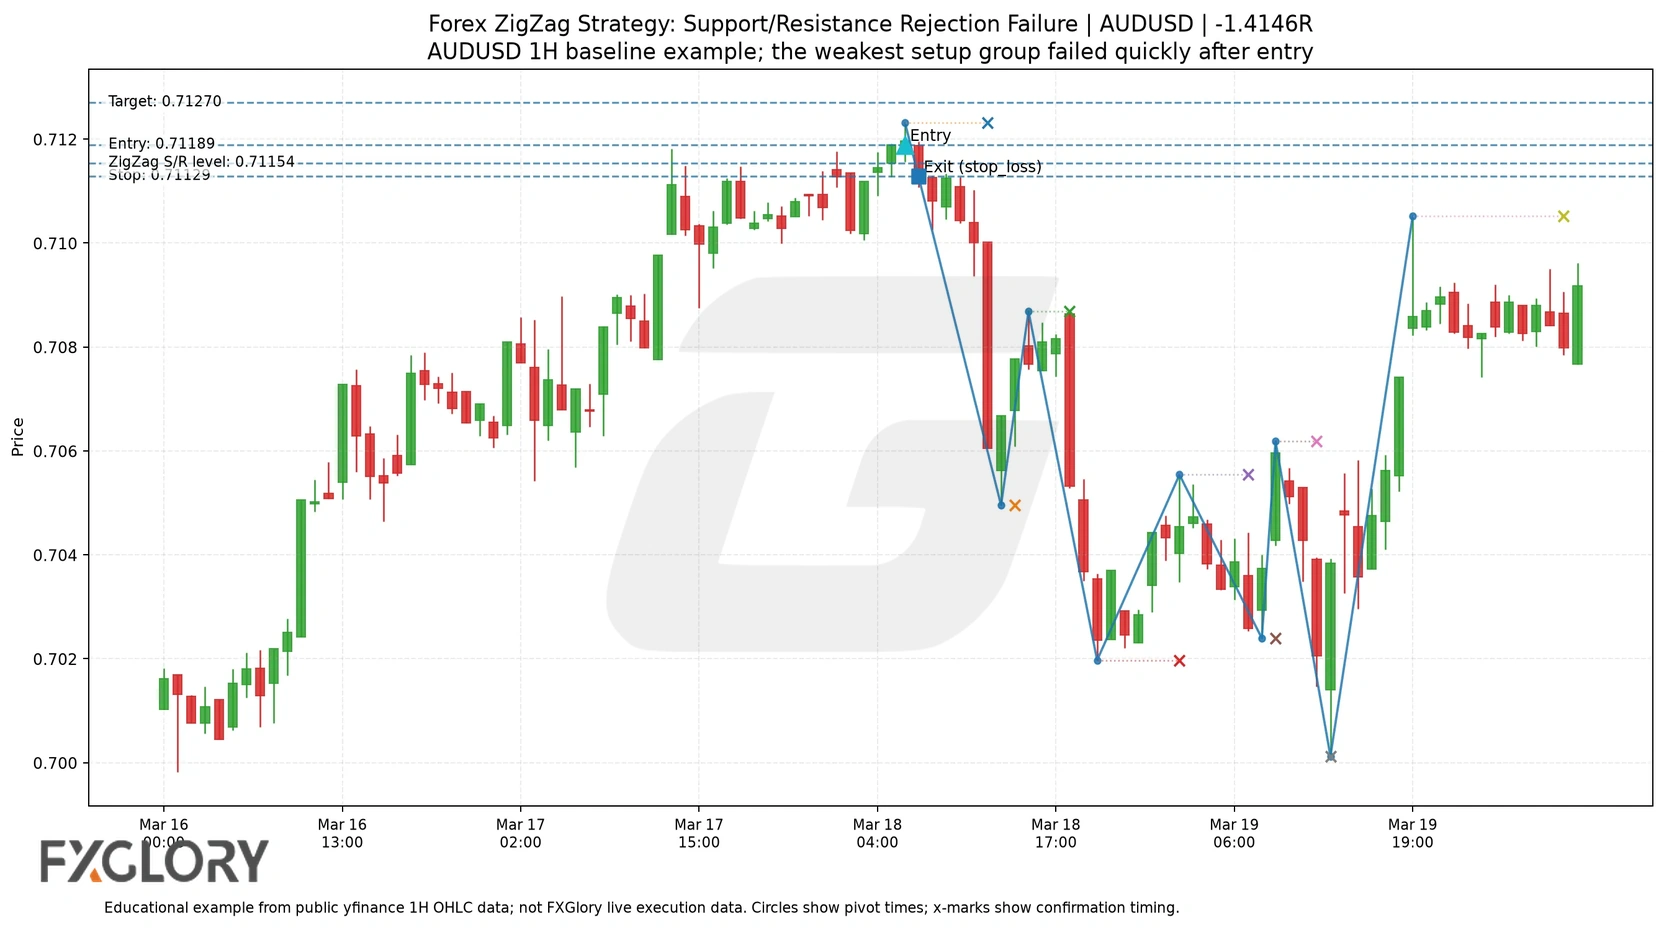
This setup treated older confirmed ZigZag highs and lows as support or resistance zones. It entered after price rejected one of those zones. This is a popular use of ZigZag, but the test shows it was the weakest group because many trades had short holding times and smaller risk distances.
For a broader explanation of these zones, use forex support and resistance as the base concept. ZigZag can help mark levels, but the level still needs confirmation, risk control, and cost awareness.
The failed example below shows why the support/resistance rejection setup was dangerous in the test. A historical ZigZag level can look meaningful, but the actual entry still has to survive spread, slippage, stop distance, and real-time confirmation timing.
4. ZigZag + Fibonacci Retracement Continuation
This setup used confirmed ZigZag swings as Fibonacci anchors and looked for continuation after a 50%-78.6% retracement. This connects naturally with the separate Fibonacci trading strategy forex page, but here the question is whether ZigZag-confirmed anchors improved the entry model.
5. ZigZag Double Top/Bottom Reversal
This setup looked for a confirmed retest of a prior ZigZag high or low within tolerance, then entered after the second top or bottom had been confirmed. It had fewer trades than the support/resistance model, but it still did not produce positive expectancy.
Backtest Methodology
The study used public yfinance 1H OHLC data across EURUSD, GBPUSD, USDJPY, AUDUSD, USDCAD, and USDCHF. The requested period was 730 days, with downloads running from September 2023 into July 2026 depending on pair availability.
The baseline setting was a 0.35% online ZigZag threshold. A fast 0.25% threshold and slow 0.50% threshold were also tested. Baseline costs were 1.5 pips of spread plus 0.5 pips of slippage per side, converted into R by each trade's risk distance.
Methodology precision note
This test uses an online percent-deviation ZigZag proxy. It is not a perfect clone of every MT4, MT5, or TradingView ZigZag implementation, because platforms and scripts can define Depth, Deviation, Backstep, reversal amount, and confirmation logic differently. The point of the test is not to rank one platform's ZigZag formula. It is to test whether confirmed ZigZag swing structure, used without lookahead bias, produced durable standalone forex entries.
| Method Item | Rule Used |
|---|---|
| Data source | yfinance public 1H OHLC; not FXGlory live execution data |
| Pairs | EURUSD, GBPUSD, USDJPY, AUDUSD, USDCAD, USDCHF |
| Baseline ZigZag threshold | 0.35% |
| Extra thresholds | 0.25% and 0.50% |
| Pivot rule | Online confirmed pivot only; final provisional leg excluded |
| Entry timing | After confirmation and trigger, usually next bar open |
| Baseline costs | 1.5 pip spread plus 0.5 pip slippage per side |
| Exit model | Stop, target, same-bar stop-first assumption, Friday flat exit, or time exit |
Backtest Transparency And Trust Notes
The backtest was built to answer one narrow question: can common confirmed-pivot ZigZag entry ideas work as standalone mechanical forex strategies after baseline costs? It was not built to promote a signal, sell an indicator, or suggest that FXGlory live execution would match public-data results.
| Trust Item | What Was Done |
|---|---|
| Source data | Public yfinance 1H OHLC data was used. The results are not FXGlory live execution data. |
| Pivot timing | Pivot time and confirmation time were separated so historical turning points were not treated as known before confirmation. |
| Provisional ZigZag leg | The final unconfirmed ZigZag leg was excluded from signal logic. |
| Cost model | Baseline results deducted spread and slippage converted into R by each trade's risk distance. |
| Scope | The test did not model leverage, account compounding, swaps, rejected orders, latency, partial fills, or margin calls. |
| Result disclosure | All five tested setup families were negative after baseline costs, and the article reports that result directly. |
This transparency matters because a completed ZigZag chart can make past turning points look obvious. The test only allowed entries after a pivot was confirmed, which is the key difference between a repainting-safe test and a hindsight chart example.
Backtest Summary
The baseline result was negative. This is not a failure of the article; it is the main finding. A useful forex ZigZag strategy page should tell traders that confirmed ZigZag structure can be descriptive without being profitable as a standalone entry model.
| Baseline Result | Value |
|---|---|
| Accepted baseline trades after overlap filter | 6264 |
| Win rate | 41.84% |
| Average win | 1.0583R |
| Average loss | -1.0208R |
| Expectancy | -0.1508R |
| Profit factor | 0.7459 |
| Total net R | -944.8230R |
| Maximum drawdown | -961.1716R |
| Average holding time | 14.5592 one-hour bars |
| Friday flat exit rate | 17.11% |
Setup Results: Which ZigZag Strategy Was Least Bad?
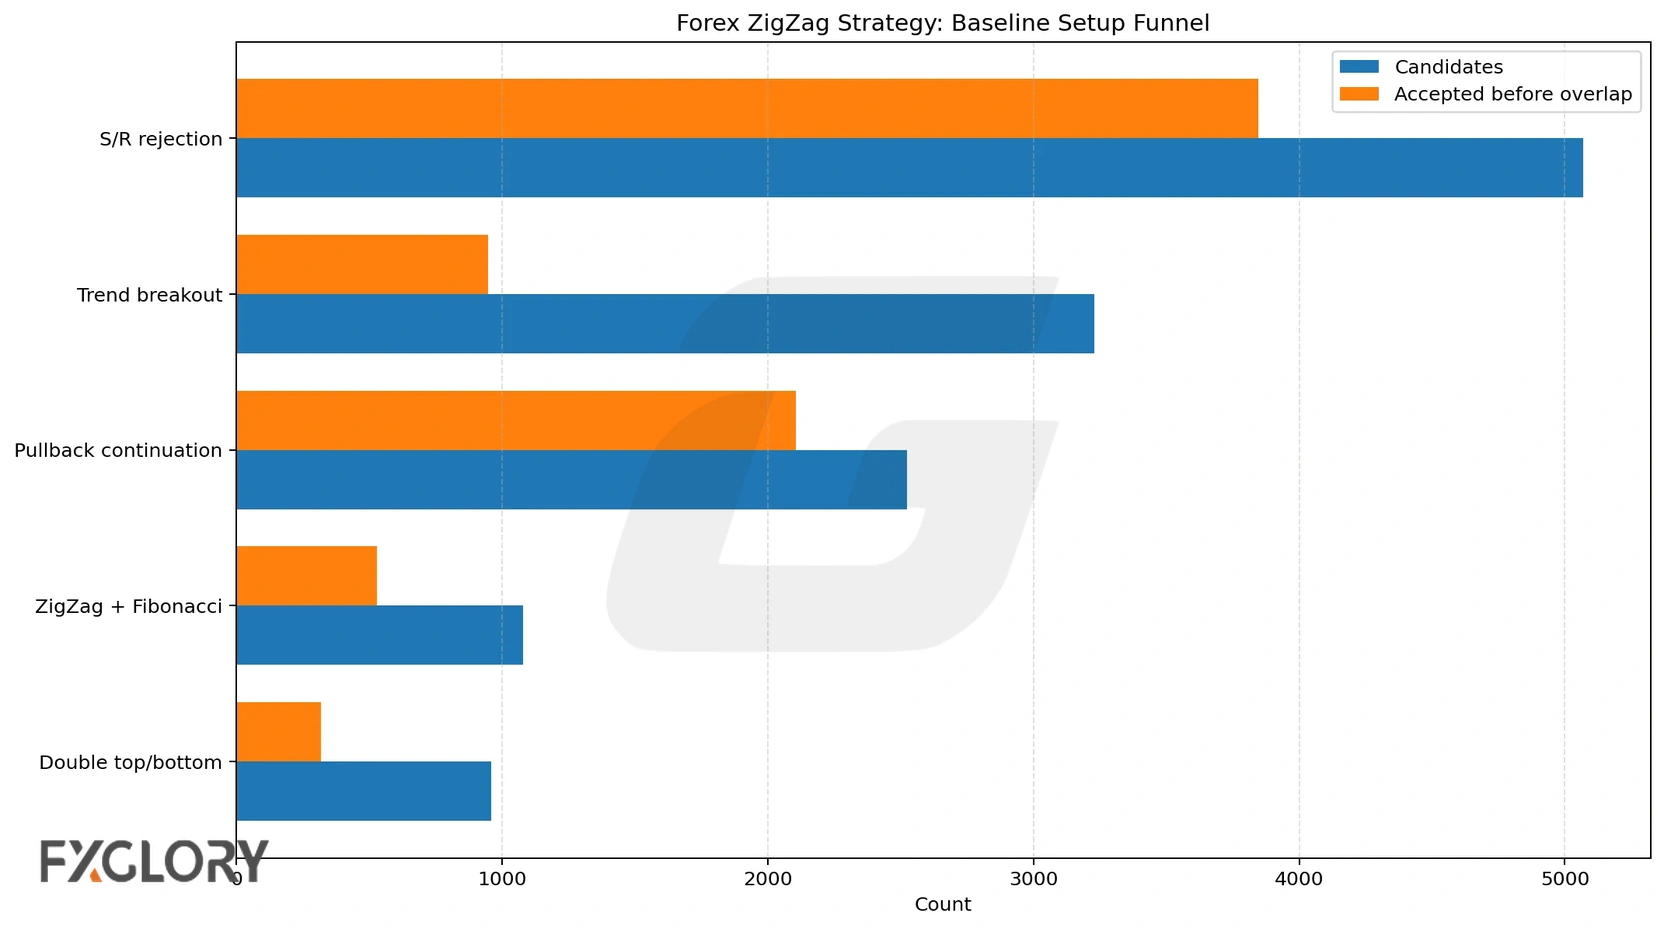
No tested setup was positive under the baseline cost model. The least negative group was ZigZag trend-continuation breakout. The most damaging group was ZigZag support/resistance rejection, mainly because it produced a large number of trades with weaker average outcomes.
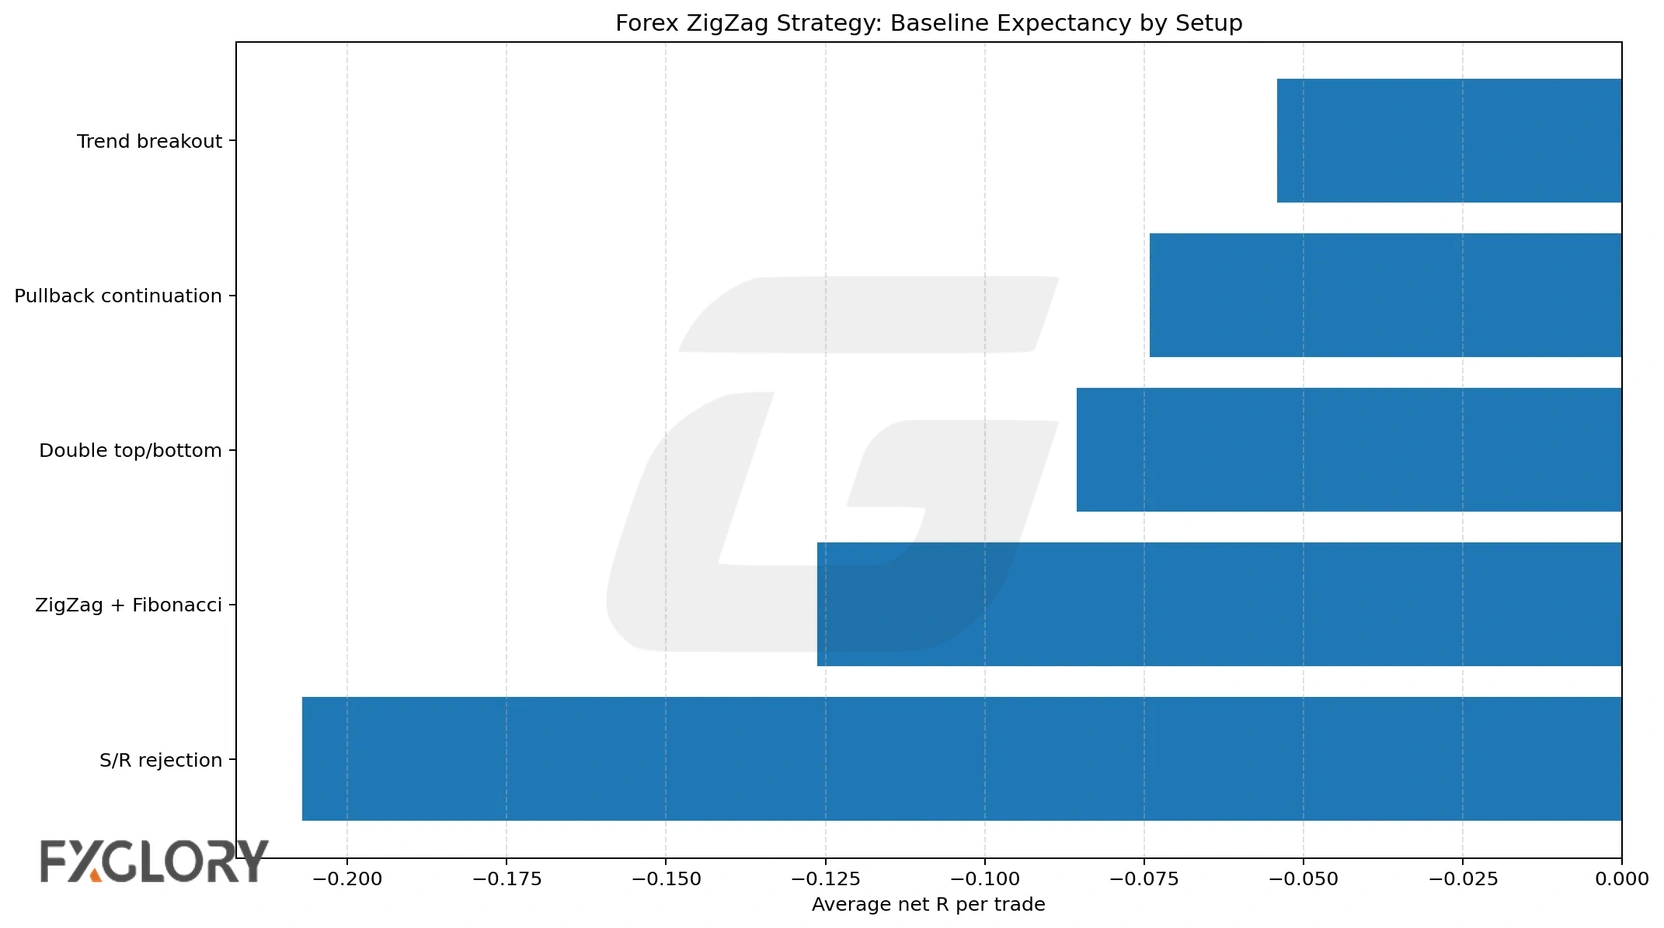
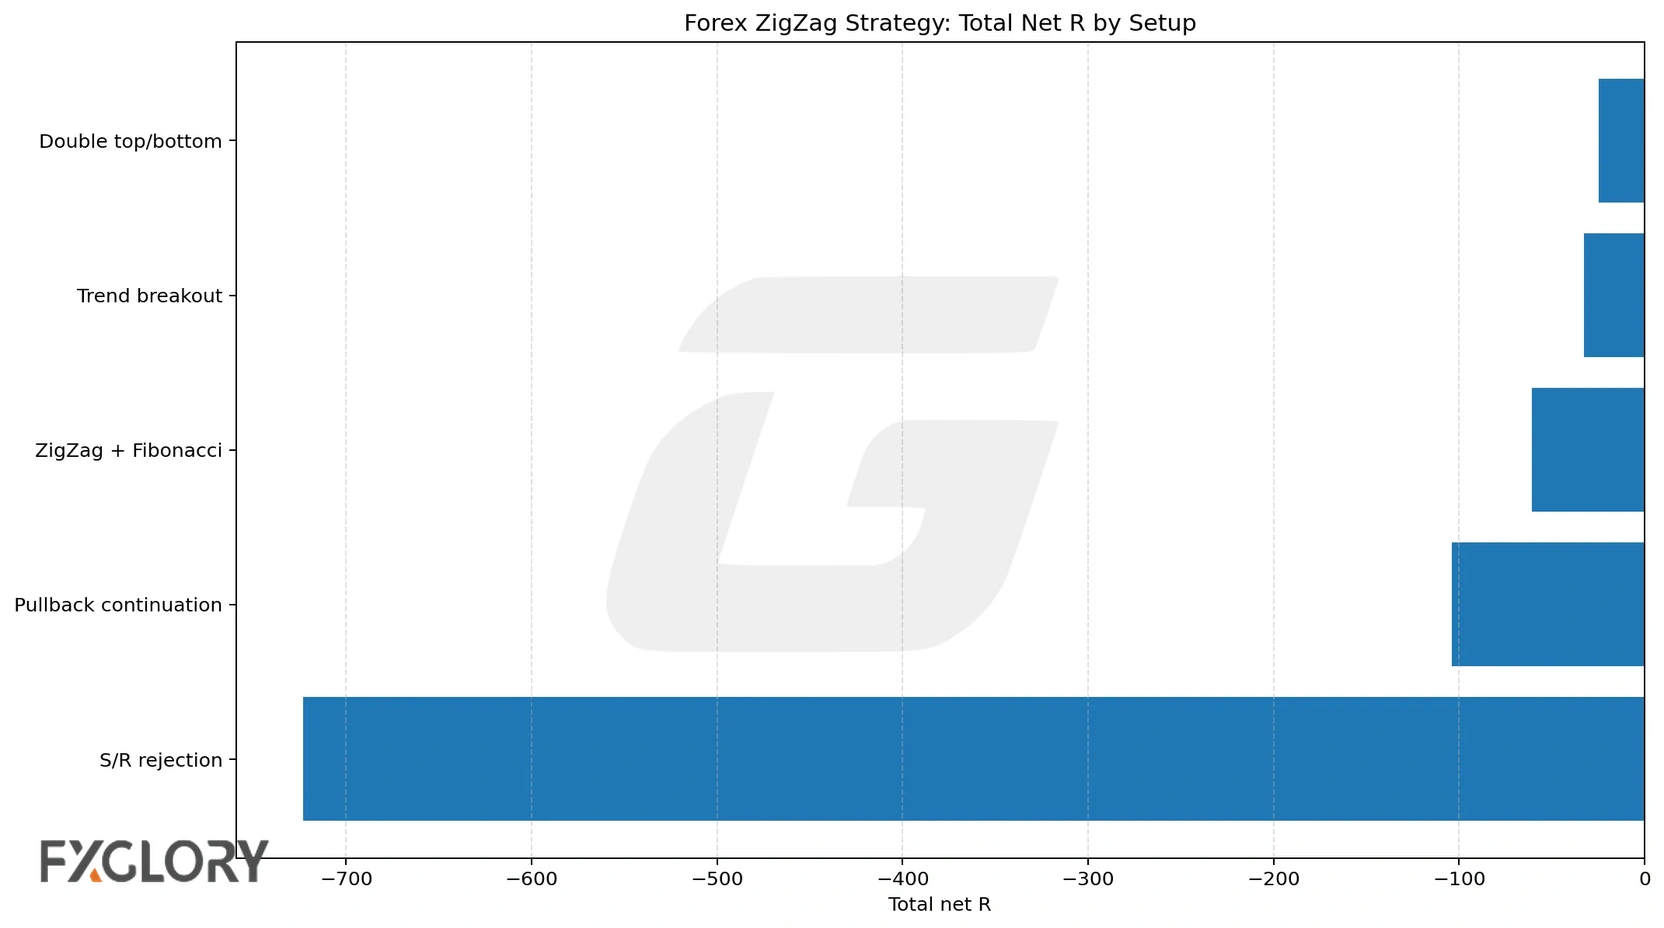
| Setup | Trades | Win Rate | Expectancy | Profit Factor | Total Net R | Max Drawdown |
|---|---|---|---|---|---|---|
| Trend-continuation breakout | 604 | 44.21% | -0.0542R | 0.8711 | -32.7635R | -40.0441R |
| Pullback continuation | 1402 | 41.16% | -0.0741R | 0.8531 | -103.8544R | -111.0845R |
| Double top/bottom reversal | 287 | 42.86% | -0.0856R | 0.8234 | -24.5549R | -28.3486R |
| ZigZag + Fibonacci retracement | 479 | 39.87% | -0.1263R | 0.7641 | -60.5131R | -66.0081R |
| Support/resistance rejection | 3492 | 41.9% | -0.2071R | 0.6939 | -723.1371R | -730.3867R |
The practical conclusion is that the ZigZag indicator worked better as a structure label than as an entry engine. The trend-breakout model was closest to breakeven, but still negative. Support/resistance rejection looked intuitive on charts but was the biggest contributor to loss.
Why ZigZag Confirmation Lag Matters
The baseline 0.35% setting did not confirm pivots instantly. For example, EURUSD averaged 8.0275 bars from pivot to confirmation, GBPUSD averaged 7.5089 bars, USDCAD averaged 10.7124 bars, and USDJPY averaged 4.8853 bars. That delay is the reason ZigZag should not be presented as a real-time reversal signal.
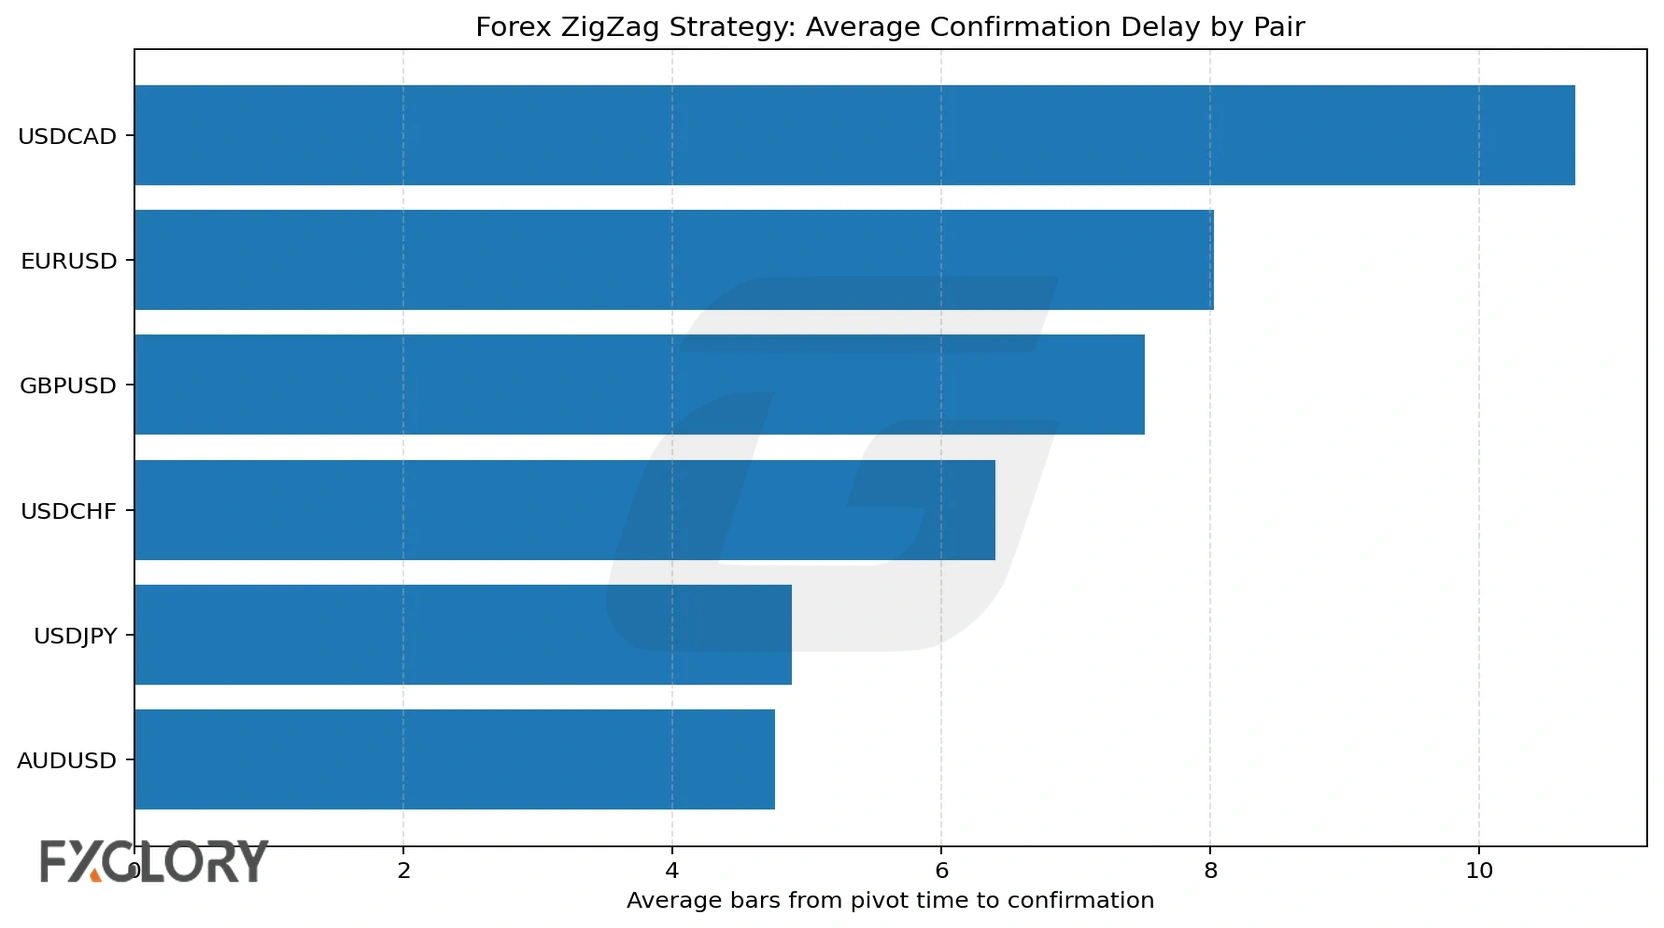
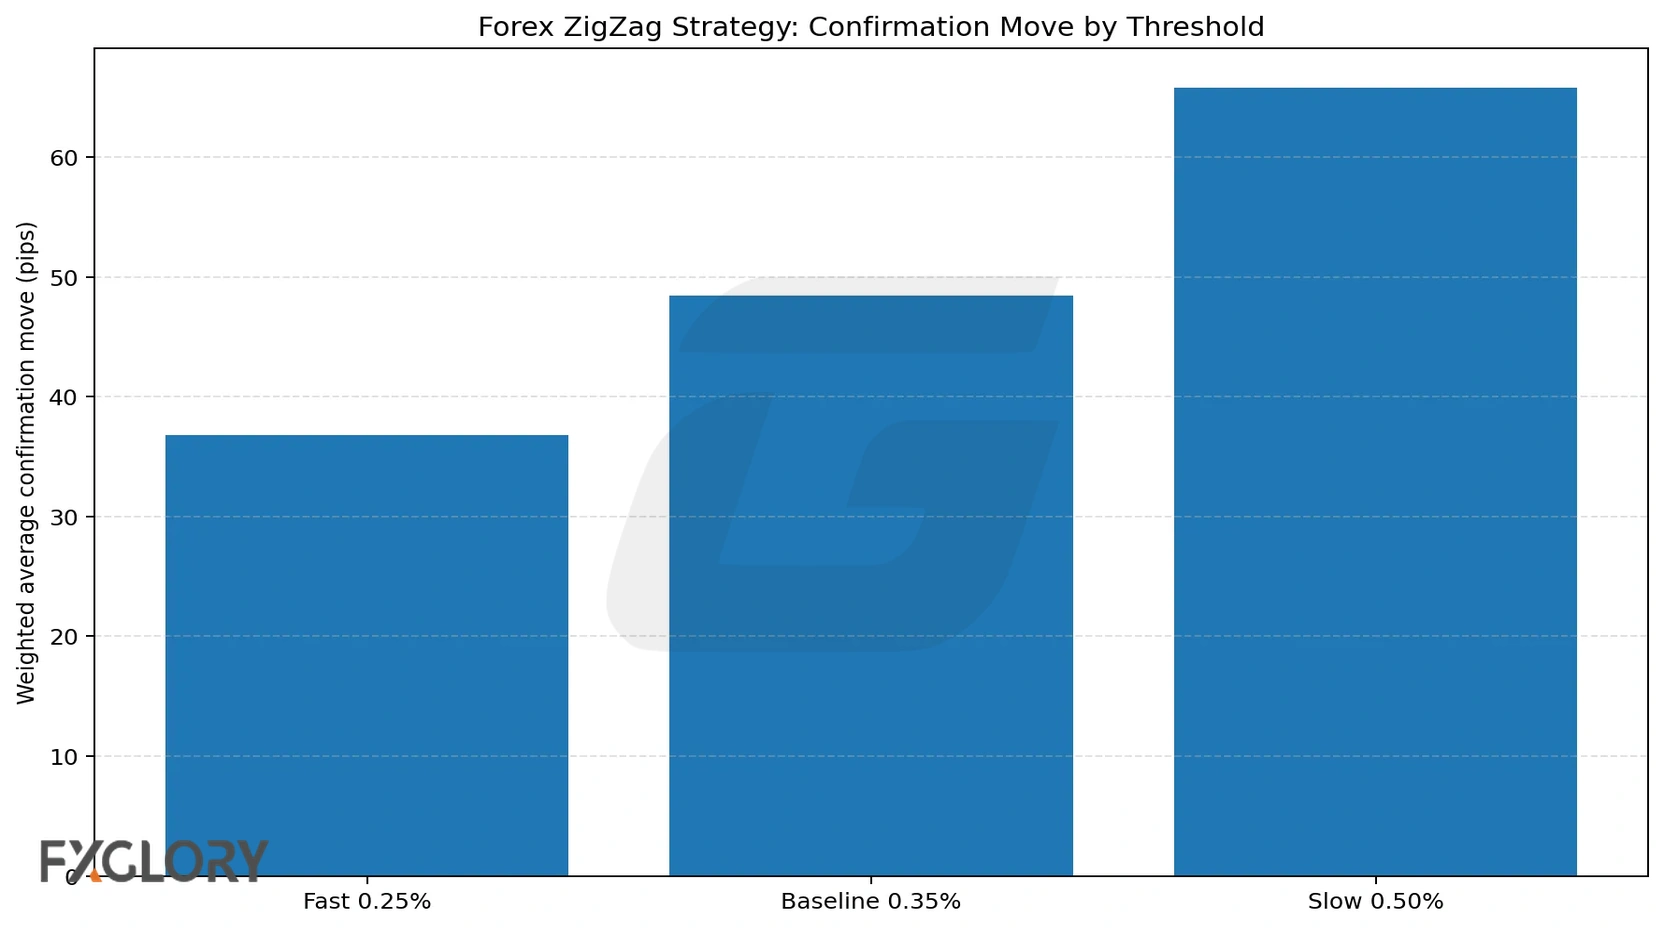
| Pair | Confirmed Baseline Pivots | Avg Delay Bars | Median Delay Bars | Max Delay Bars | Avg Confirmation Move Pips |
|---|---|---|---|---|---|
| EURUSD | 691 | 8.0275 | 5.0 | 53 | 47.9434 |
| GBPUSD | 731 | 7.5089 | 5.0 | 64 | 54.8173 |
| USDJPY | 1064 | 4.8853 | 3.0 | 72 | 69.8033 |
| AUDUSD | 1121 | 4.76 | 3.0 | 39 | 29.3845 |
| USDCAD | 466 | 10.7124 | 7.5 | 108 | 58.0427 |
| USDCHF | 877 | 6.4002 | 4.0 | 42 | 36.8204 |
A trader who buys exactly at a historical ZigZag low is usually using hindsight. A repainting-safe strategy must wait for the pivot to become confirmed, and that confirmation often arrives after a meaningful part of the reversal has already happened.
ZigZag Settings And Cost Sensitivity
The fast 0.25% threshold was least negative, but it also generated the most trades. The slow 0.50% threshold confirmed fewer, larger swings but still produced negative expectancy. The baseline 0.35% setting sat between them and was used for the main article results.
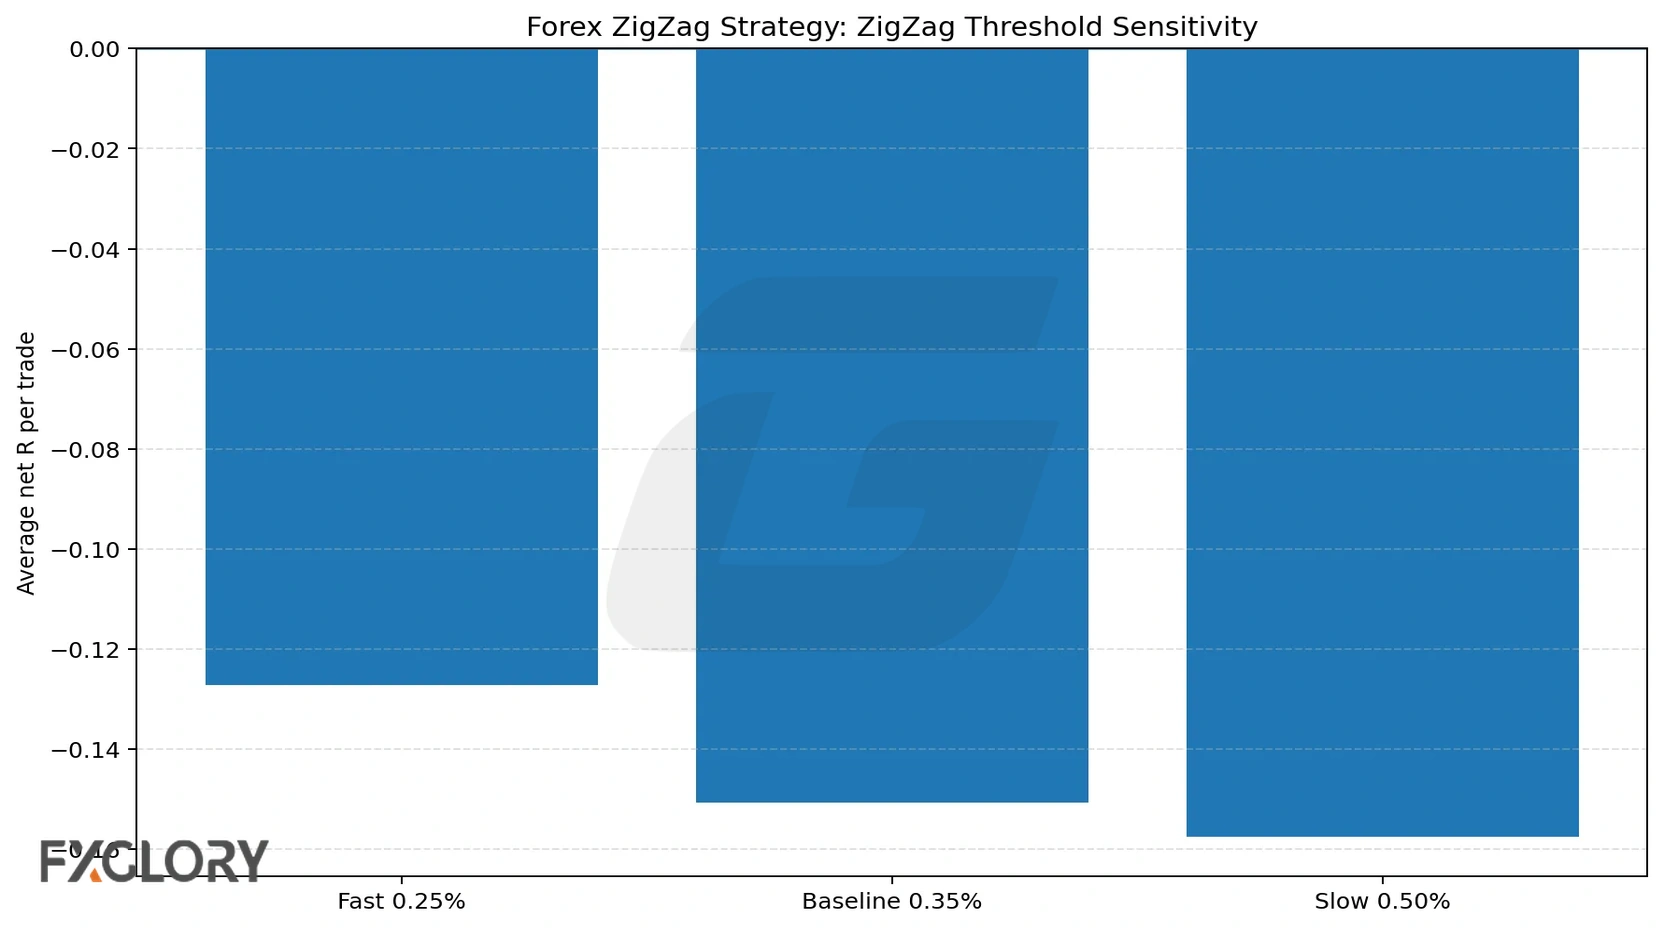
| Setting | Trades | Win Rate | Expectancy | Profit Factor | Total Net R |
|---|---|---|---|---|---|
| Fast 0.25% | 8995 | 43.01% | -0.1273R | 0.7846 | -1144.6872R |
| Baseline 0.35% | 6264 | 41.84% | -0.1508R | 0.7459 | -944.8230R |
| Slow 0.50% | 3921 | 42.31% | -0.1575R | 0.735 | -617.7280R |
Costs mattered heavily. Even the low-cost model stayed negative at -0.0557R expectancy. The high-cost model fell to -0.2830R expectancy and -1772.7866R total net R.
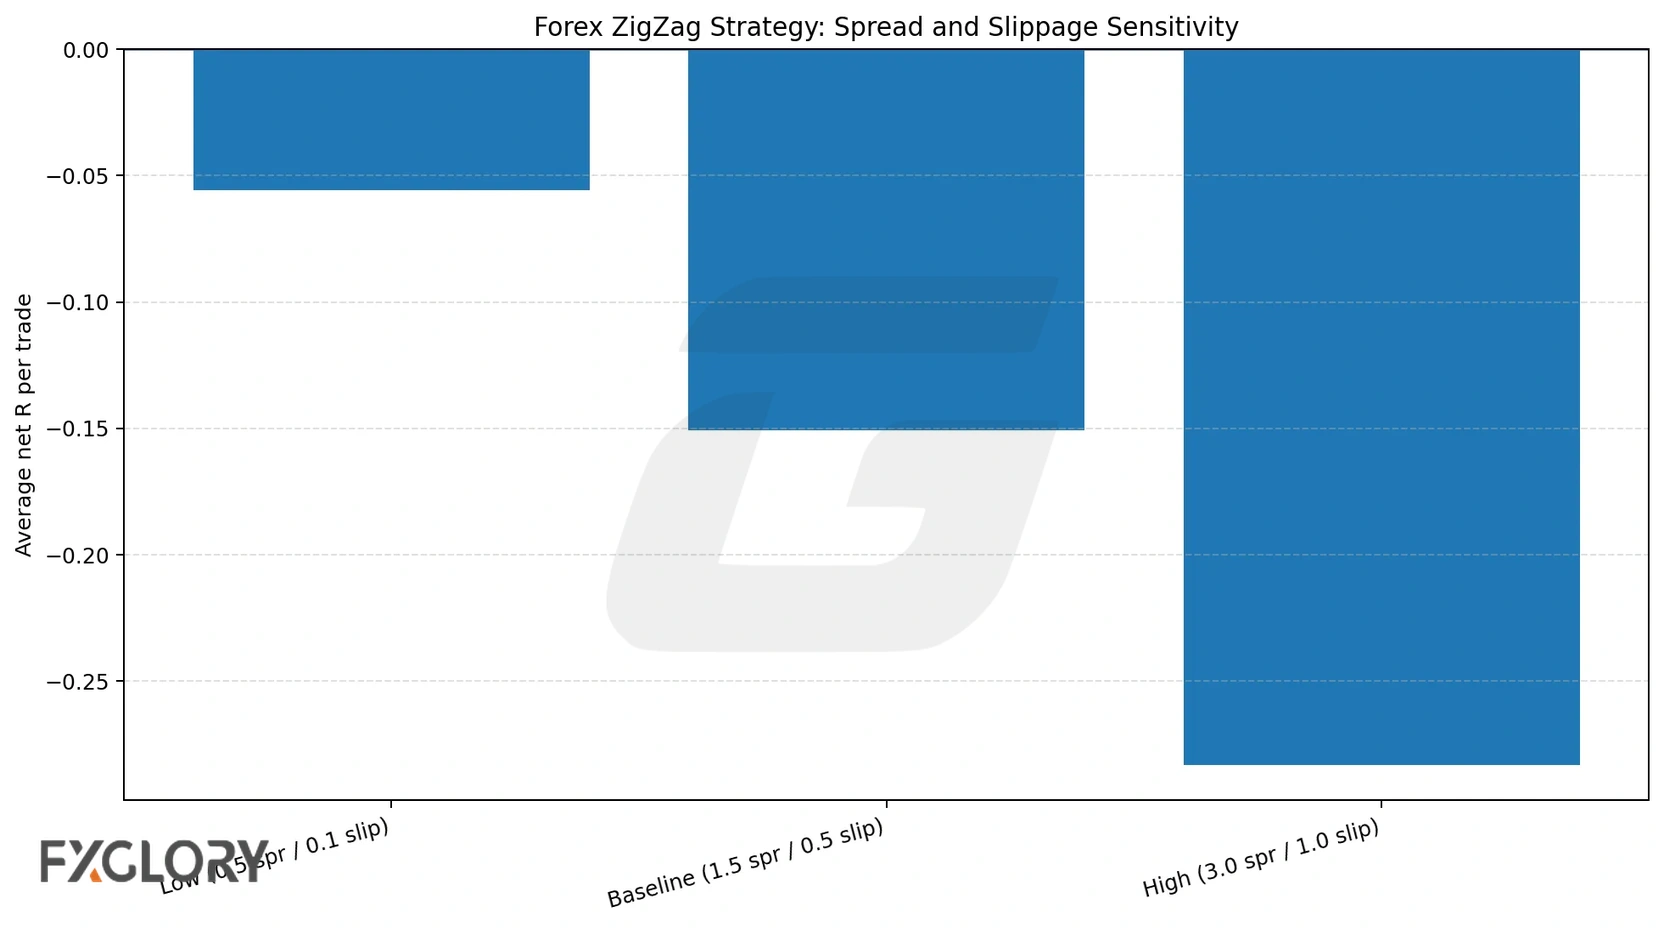
| Cost Model | Spread Pips | Slippage Per Side | Win Rate | Expectancy | Profit Factor | Total Net R |
|---|---|---|---|---|---|---|
| Low | 0.5 | 0.1 | 42.4% | -0.0557R | 0.8965 | -348.6891R |
| Baseline | 1.5 | 0.5 | 41.84% | -0.1508R | 0.7459 | -944.8230R |
| High | 3.0 | 1.0 | 41.0% | -0.2830R | 0.5786 | -1772.7866R |
Cost warning
Many ZigZag trades in the test used relatively small risk distances. When the stop distance is small, spread and slippage consume a larger share of R. That is one reason ZigZag support/resistance rejection performed especially poorly.
Pair And Session Results
Every tested pair was negative under the baseline model. EURUSD was least negative by expectancy at -0.1144R, while USDCAD was weakest at -0.2346R. Pair differences matter, but none of them rescued the tested standalone model.
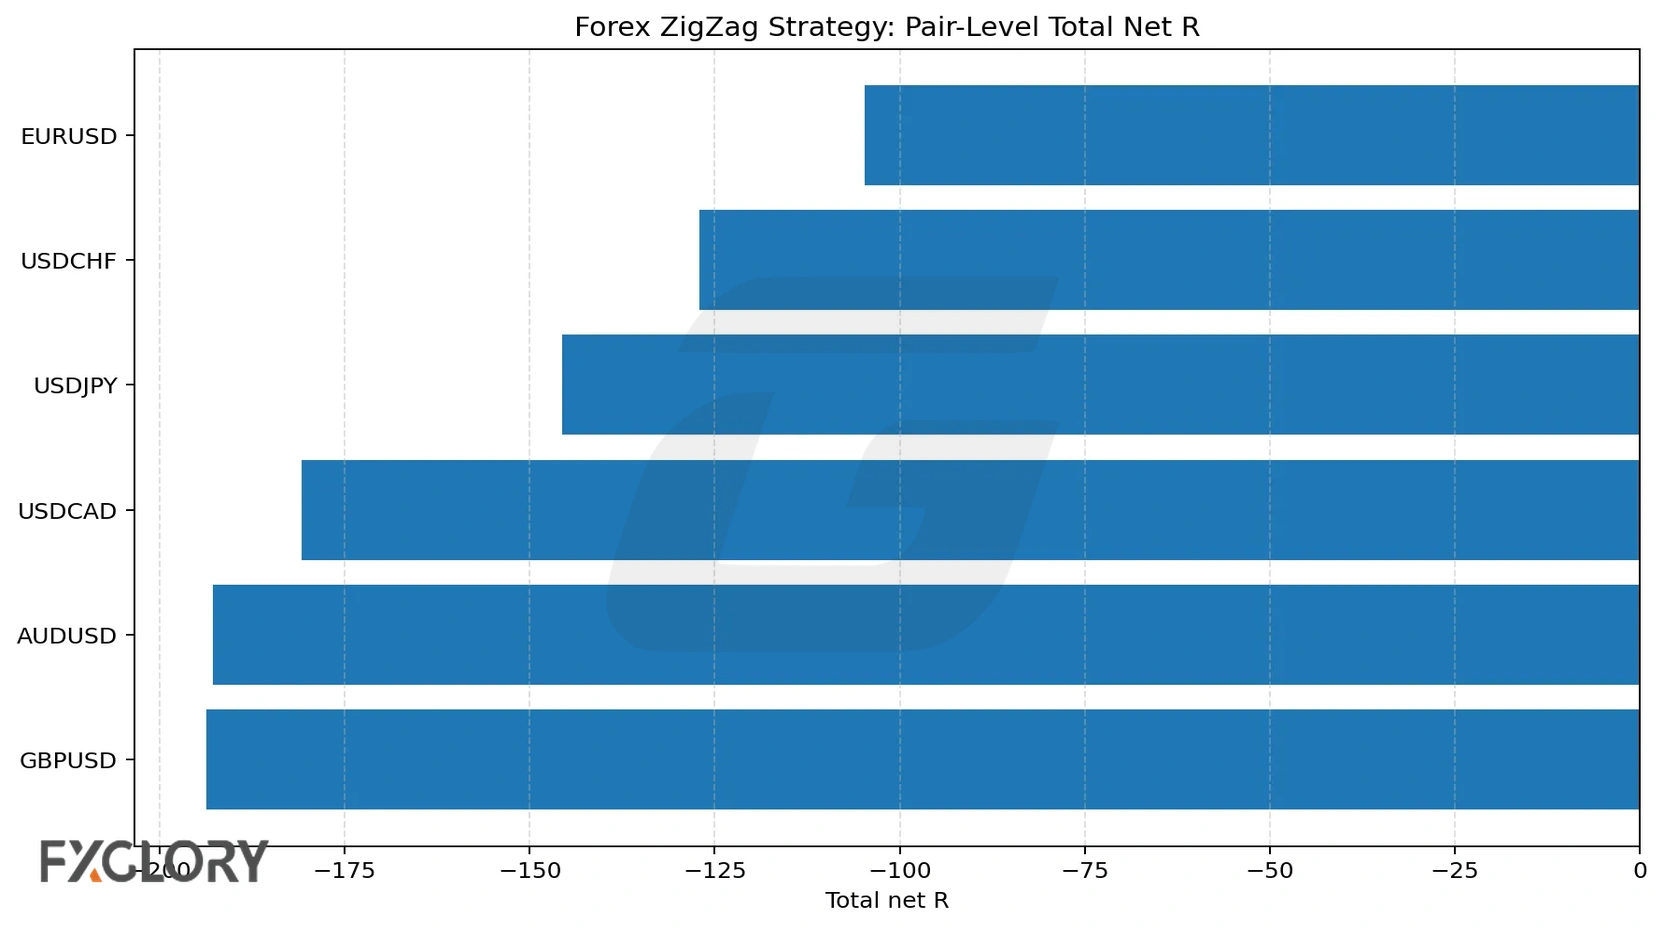
| Pair | Trades | Win Rate | Expectancy | Profit Factor | Total Net R |
|---|---|---|---|---|---|
| EURUSD | 916 | 44.0% | -0.1144R | 0.7982 | -104.7601R |
| USDJPY | 1248 | 41.27% | -0.1166R | 0.8097 | -145.5540R |
| USDCHF | 1023 | 43.5% | -0.1242R | 0.7791 | -127.0675R |
| AUDUSD | 1319 | 42.84% | -0.1462R | 0.7524 | -192.8415R |
| GBPUSD | 987 | 40.02% | -0.1963R | 0.6784 | -193.7309R |
| USDCAD | 771 | 38.65% | -0.2346R | 0.6217 | -180.8689R |
Session results were also negative across the board. Early New York afternoon was least negative at -0.1159R, while rollover/off-hours was weakest at -0.1822R.
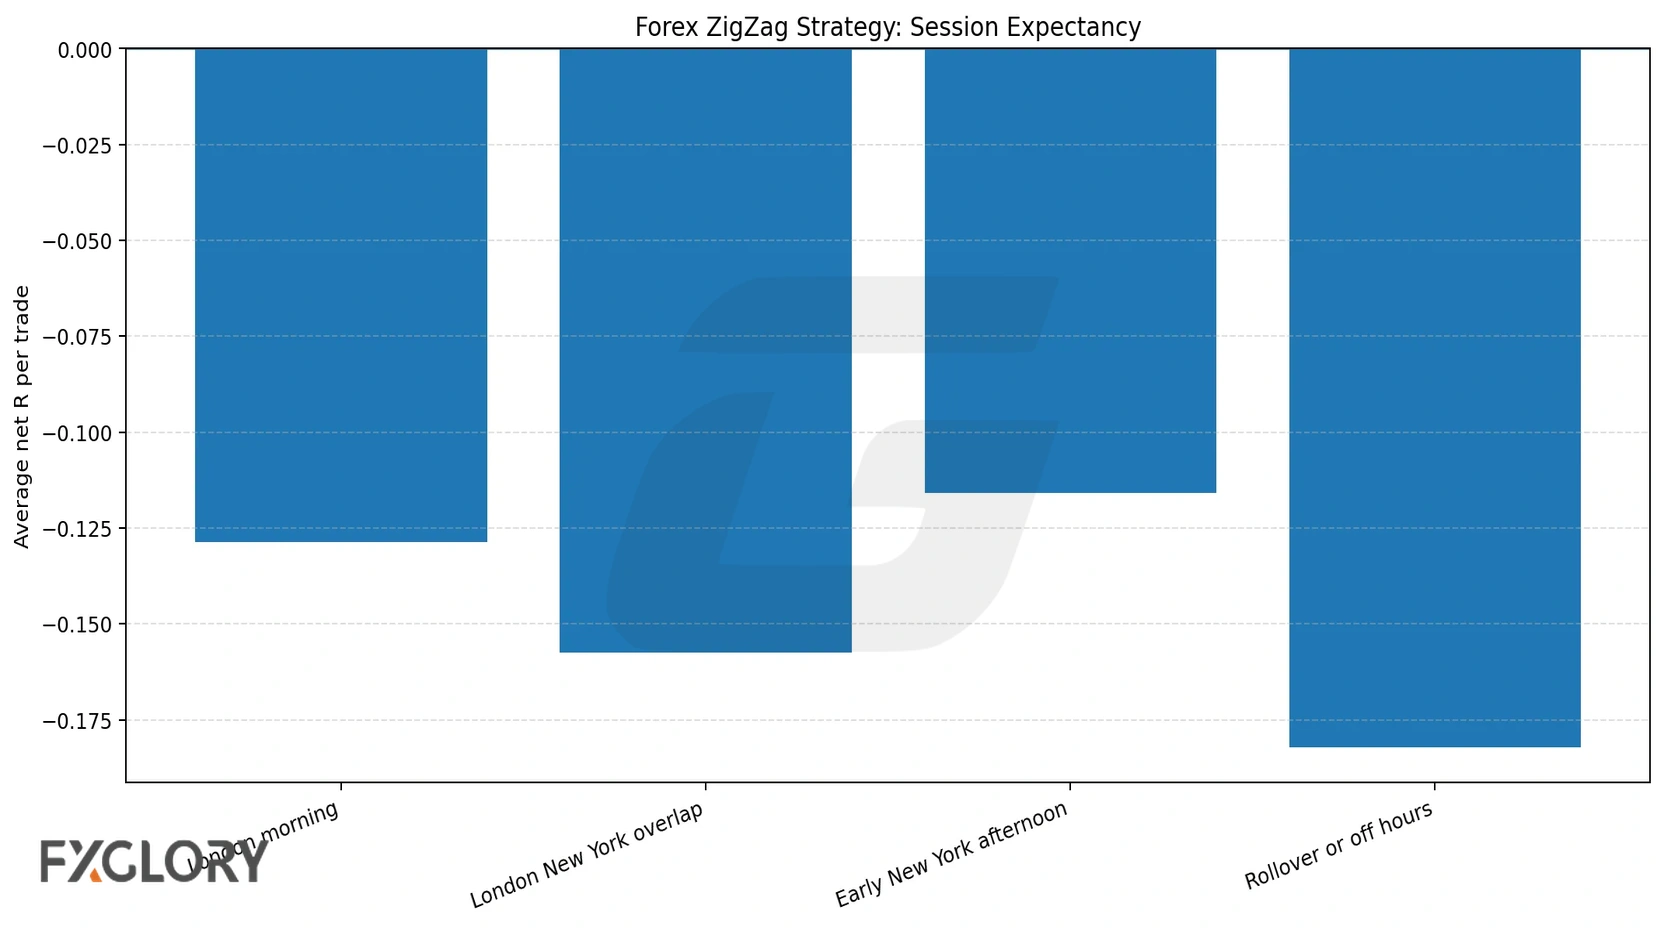
| Session | Trades | Win Rate | Expectancy | Profit Factor | Total Net R |
|---|---|---|---|---|---|
| Early New York afternoon | 1177 | 42.74% | -0.1159R | 0.7878 | -136.3986R |
| London morning | 1315 | 43.19% | -0.1286R | 0.7867 | -169.0630R |
| London/New York overlap | 1946 | 41.62% | -0.1576R | 0.7279 | -306.6568R |
| Rollover or off-hours | 1826 | 40.53% | -0.1822R | 0.7123 | -332.7046R |
Robustness Checks
The negative result was not isolated to one segment of the test. The first 70% of baseline trades produced -0.1495R expectancy, and the final 30% produced -0.1539R expectancy. The one-open-trade-per-pair diagnostic was also negative at -0.1487R expectancy.
| Diagnostic | Trades | Expectancy | Profit Factor | Total Net R |
|---|---|---|---|---|
| First 70% | 4384 | -0.1495R | 0.749 | -655.5293R |
| Final 30% | 1880 | -0.1539R | 0.7388 | -289.2936R |
| One-open-trade-per-pair diagnostic | 3498 | -0.1487R | 0.7518 | -520.1603R |
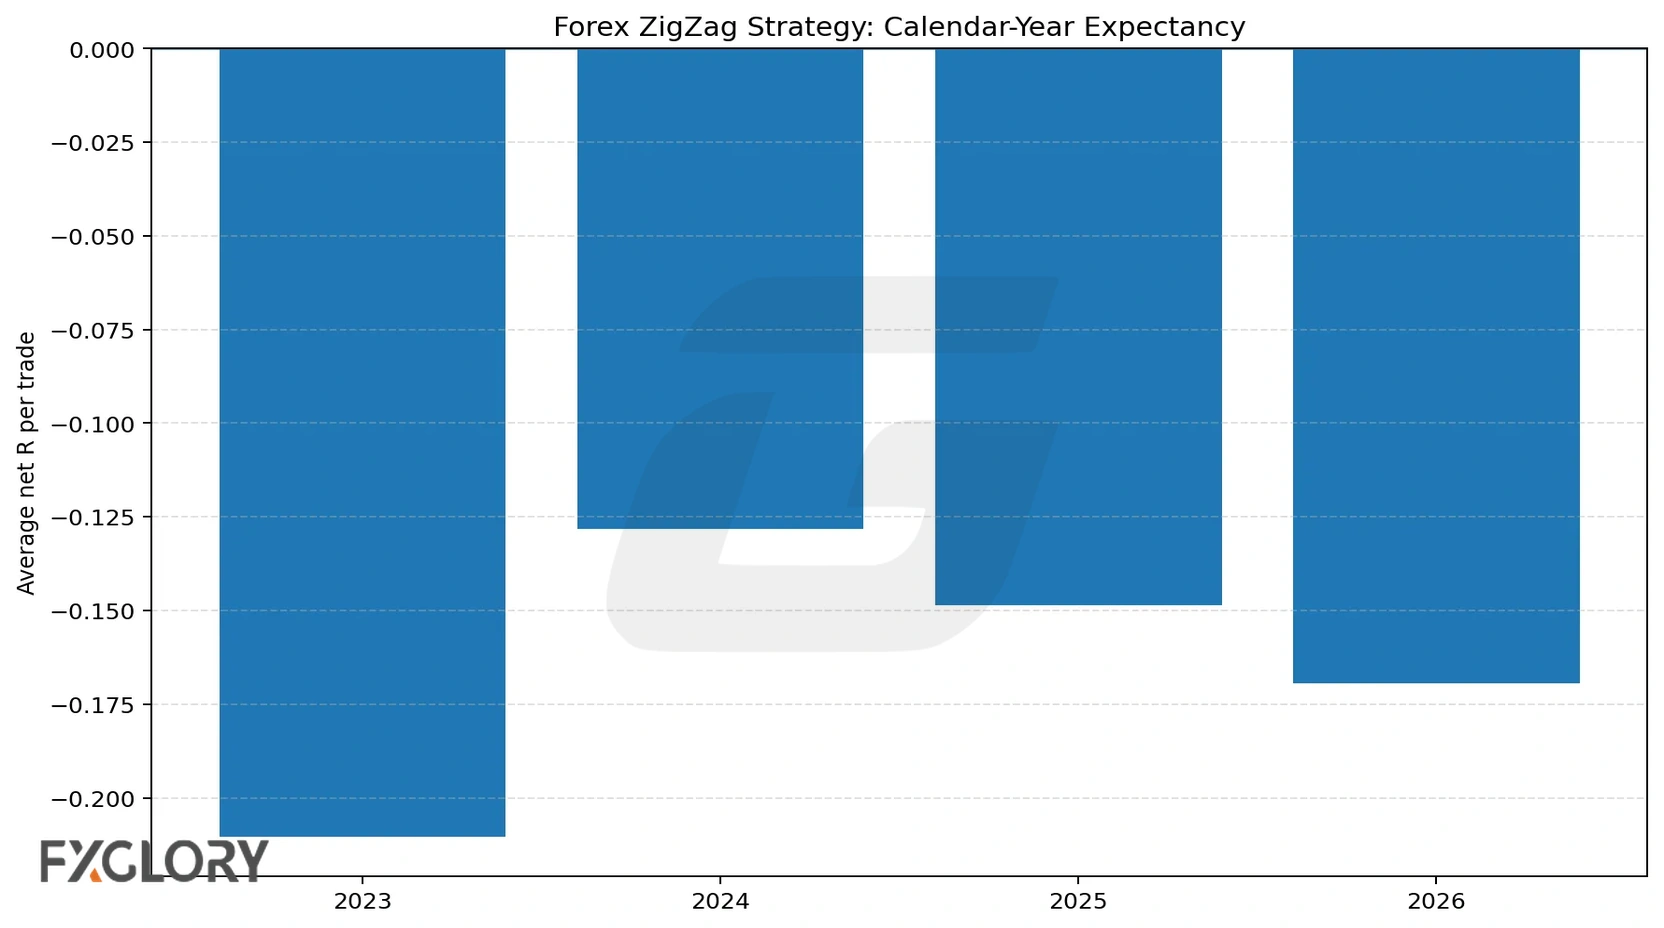
Calendar-year results were negative in every tested year, including 2023, 2024, 2025, and 2026.
| Year | Trades | Win Rate | Expectancy | Profit Factor | Total Net R |
|---|---|---|---|---|---|
| 2023 | 527 | 40.8% | -0.2103R | 0.663 | -110.8310R |
| 2024 | 2048 | 42.29% | -0.1283R | 0.7772 | -262.8548R |
| 2025 | 2570 | 42.06% | -0.1485R | 0.7529 | -381.5833R |
| 2026 | 1119 | 41.02% | -0.1694R | 0.7153 | -189.5538R |
Best ZigZag Indicator Combinations To Test
The backtest result argues against using ZigZag alone. A more defensible workflow is to use ZigZag for structure, then require a separate reason for entry, invalidation, and target selection. That does not guarantee profitability, but it avoids treating a delayed swing marker as a complete strategy.
| Combination | What It Can Help With | Main Risk |
|---|---|---|
| ZigZag + trend filter | Using confirmed swings only in the direction of broader trend structure. | Trend filters can enter late and still fail during transitions. |
| ZigZag + support/resistance | Using repeated confirmed swing highs/lows to mark zones. | The tested support/resistance rejection model was the weakest setup, so levels need independent confirmation. |
| ZigZag + Fibonacci | Using confirmed swing points as retracement or extension anchors. | Changing anchors after the fact creates hindsight bias. |
| ZigZag + RSI or MACD | Checking whether momentum supports or rejects a swing idea. | Stacking indicators can create false confidence without improving expectancy. |
| ZigZag + candlestick trigger | Waiting for a rejection candle, breakout candle, or close beyond a level after structure is confirmed. | Candle patterns can be subjective unless rules are written before testing. |
| ZigZag + Elliott Wave or harmonic patterns | Organizing swing labels for pattern review. | Pattern labels can become discretionary and easy to rewrite after price moves. |
For related structure work, compare ZigZag with Elliott Wave forex and the tested Fibonacci trading strategy forex. Those pages should handle wave and Fibonacci theory; this page should stay focused on confirmed-pivot ZigZag strategy rules.
Practical Rules For Using ZigZag In Forex
The backtest does not mean the ZigZag indicator is useless. It means the tested mechanical entries were not good enough as standalone strategies. A more realistic use is to treat ZigZag as a chart-cleaning and structure-labeling tool.
- Use ZigZag to review confirmed swing structure, not to predict the next swing.
- Wait for pivot confirmation before using a swing in any strategy rule.
- Combine ZigZag with independent evidence such as trend context, support/resistance, volatility, and risk/reward.
- Do not use the most recent unconfirmed ZigZag leg for entries.
- Be especially cautious with small stop distances because costs can dominate R.
- Backtest each pair separately before assuming a setting is transferable.
- Document the exact platform, script name, and ZigZag settings before comparing results.
If you want to turn any chart idea into a full trading plan, review forex entry and exit strategy and forex risk management strategy. ZigZag can help organize the chart, but risk rules decide whether a trade is even worth testing.
Final Takeaway
The best use of the ZigZag indicator in forex is not as a standalone buy or sell system. In this educational test, the baseline forex ZigZag strategy lost -0.1508R per trade on average, and all five setup families were negative after costs.
That makes the page's conclusion clear: ZigZag can be useful for reviewing confirmed structure, swing anchors, support/resistance zones, Fibonacci anchors, and pattern context. But if a strategy enters from ZigZag alone, it needs independent confirmation, realistic costs, and a repainting-safe test before it deserves any confidence.