

What Is A Moving Average Forex Strategy?
A moving average forex strategy defines how one or more averages contribute to trade decisions: for example, a slower average may classify hourly trend context while a faster average marks a 15-minute pullback area. Averages are calculated from past prices, so their signals must be interpreted within the selected timeframe.
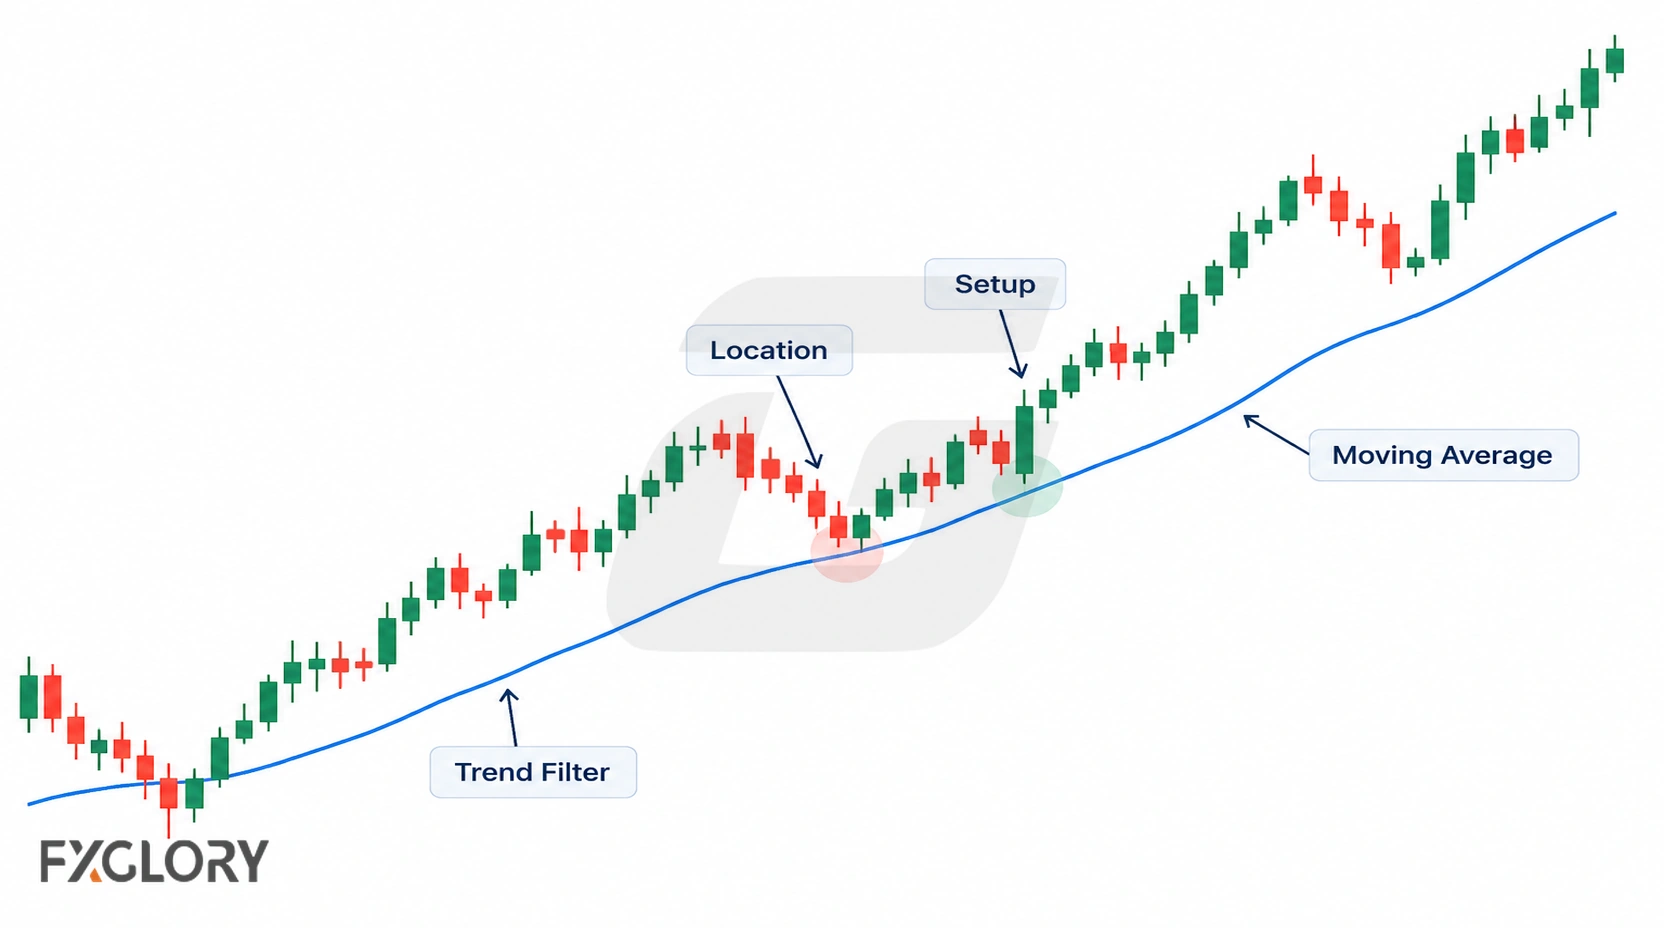
For an executable rule, specify separately the price event that qualifies an entry and the level or condition that invalidates it. Trading costs and acceptable account risk are checked before entry; an average touch or crossover alone defines neither.
For the broader structure behind indicator-based methods, start with the forex indicator strategies framework.
How Moving Averages Work In Forex
A moving average summarizes an applied price series over a chosen period. For example, an SMA(20) gives equal weight to the latest 20 observations; an EMA gives more weight to recent observations and also retains a decaying influence from earlier values. The plotted line changes as new prices enter the calculation.
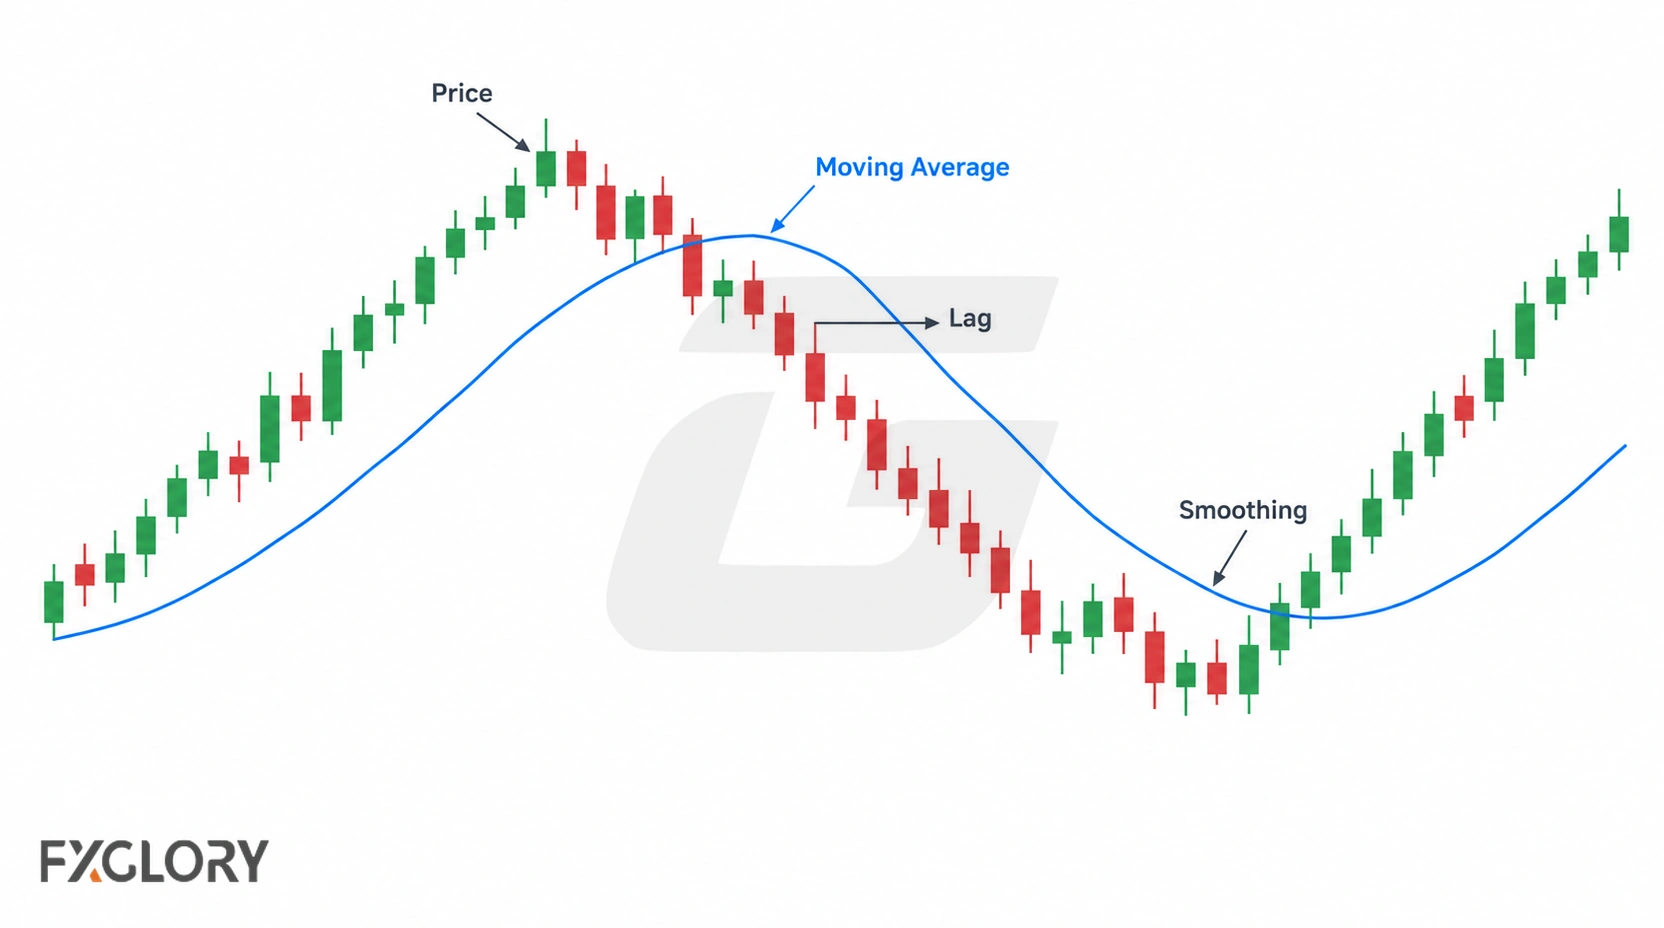
The same setting means different things on different charts. A 50-period moving average on a 1H chart averages the last 50 hourly candles. A 50-period moving average on a 15M chart averages the last 50 fifteen-minute candles. The indicator must be read in the context of the chart where it is applied.
The calculation uses past observations and therefore cannot anticipate future price turns. Responsiveness changes with the averaging method and period; compare the actual signals produced rather than assuming a universally superior balance between speed and smoothness.
SMA Vs EMA In Forex
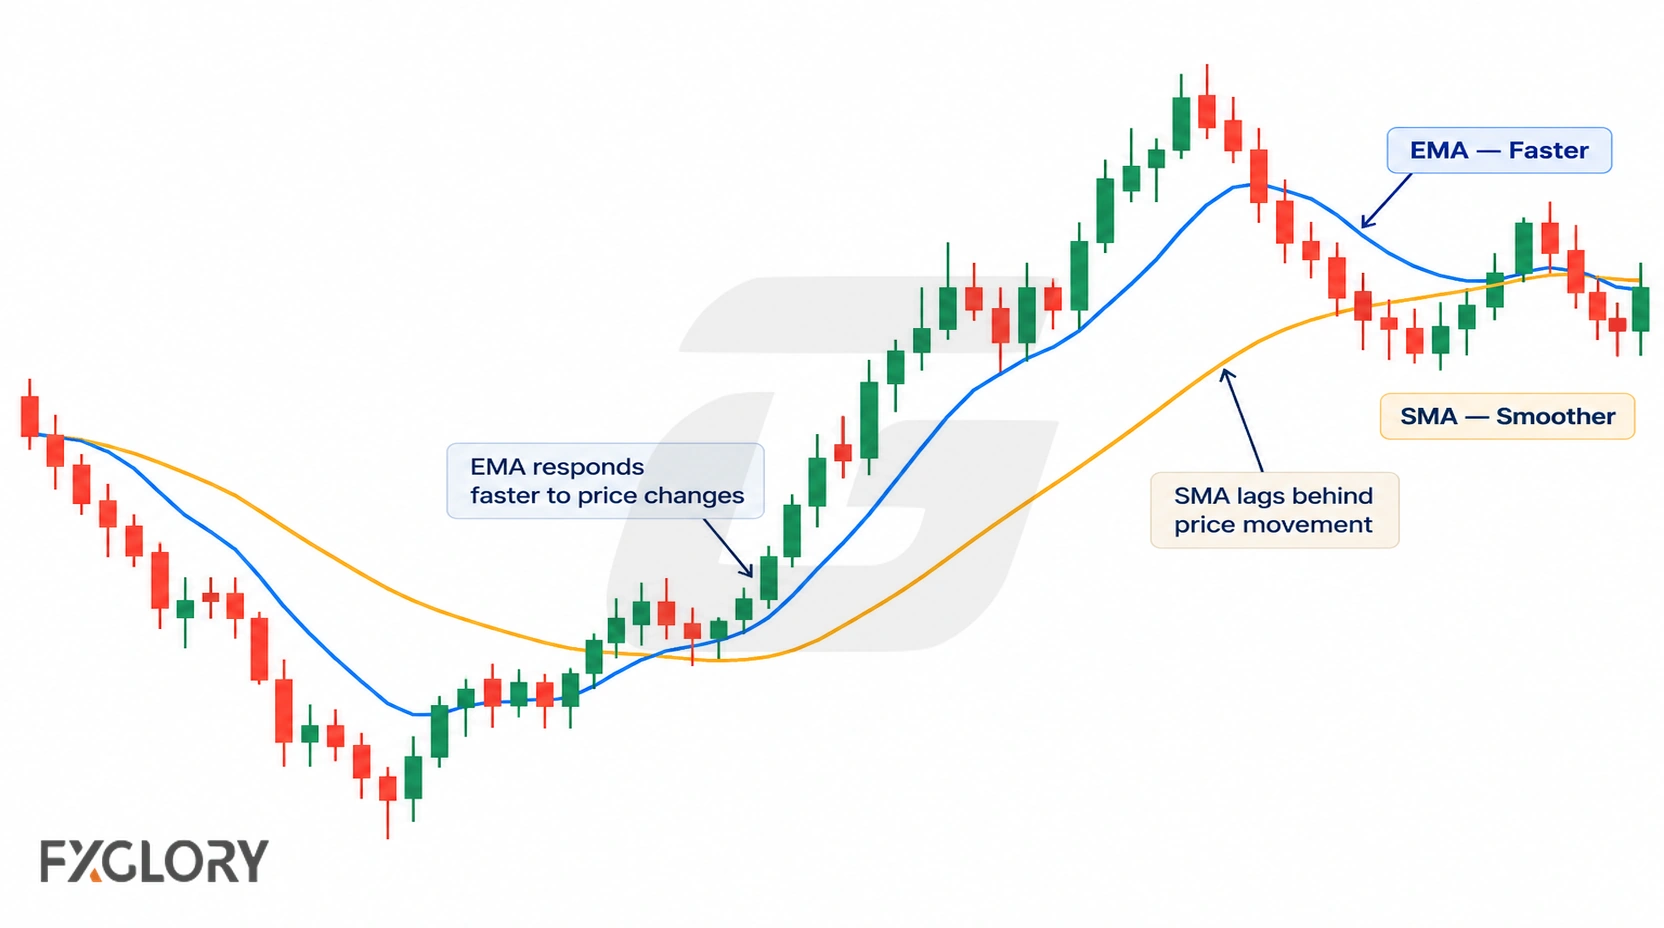
SMA and EMA use different weighting. Within its window SMA gives observations equal weight, whereas EMA assigns greater weight to recent observations and declines exponentially for older prices.
| Type | How it behaves | Useful when | Main caution |
|---|---|---|---|
| SMA | Equal-weight average of the selected lookback; often less responsive to recent changes than an equal-period EMA | The trader wants a cleaner trend or location filter | It can react late after price has already moved |
| EMA | Weights recent prices more heavily, so it commonly responds sooner to new changes | The trader wants a more responsive average for shorter-term movement | It can react to more short-term noise |
Other weighting methods exist. For a strategy comparison, keep the MA type, period, applied price, and timeframe explicit; an earlier EMA response is not necessarily a more reliable trade signal.
Four Ways To Use Moving Averages In Forex
Four useful roles are shown below. Assign each use a distinct rule rather than allowing one average reading to count as trend evidence, an entry, and independent confirmation at the same time. A strategy may deliberately use different averages on different timeframes for complementary roles.
| Moving-average role | What it answers | What it should not replace |
|---|---|---|
| Trend filter | Is price generally trading above, below, or around the average? | Setup, trigger, stop, and exit rules |
| Location filter | Is price pulling back toward an area traders may watch? | Price structure and invalidation |
| Trigger support | Does the entry trigger agree with the planned direction? | The setup chart and risk check |
| Exit context | Is price losing structure around the average or moving away from the plan? | A written exit rule |
For example, an hourly fast/slow pair may classify trend context while the 15-minute fast average marks pullback location; this is the combination used by the educational model below. Keep the functions and timing fixed during testing. The multiple-timeframe analysis guide explains how to separate context, setup, and trigger charts before adding an indicator.
Moving Average Pullback Strategy
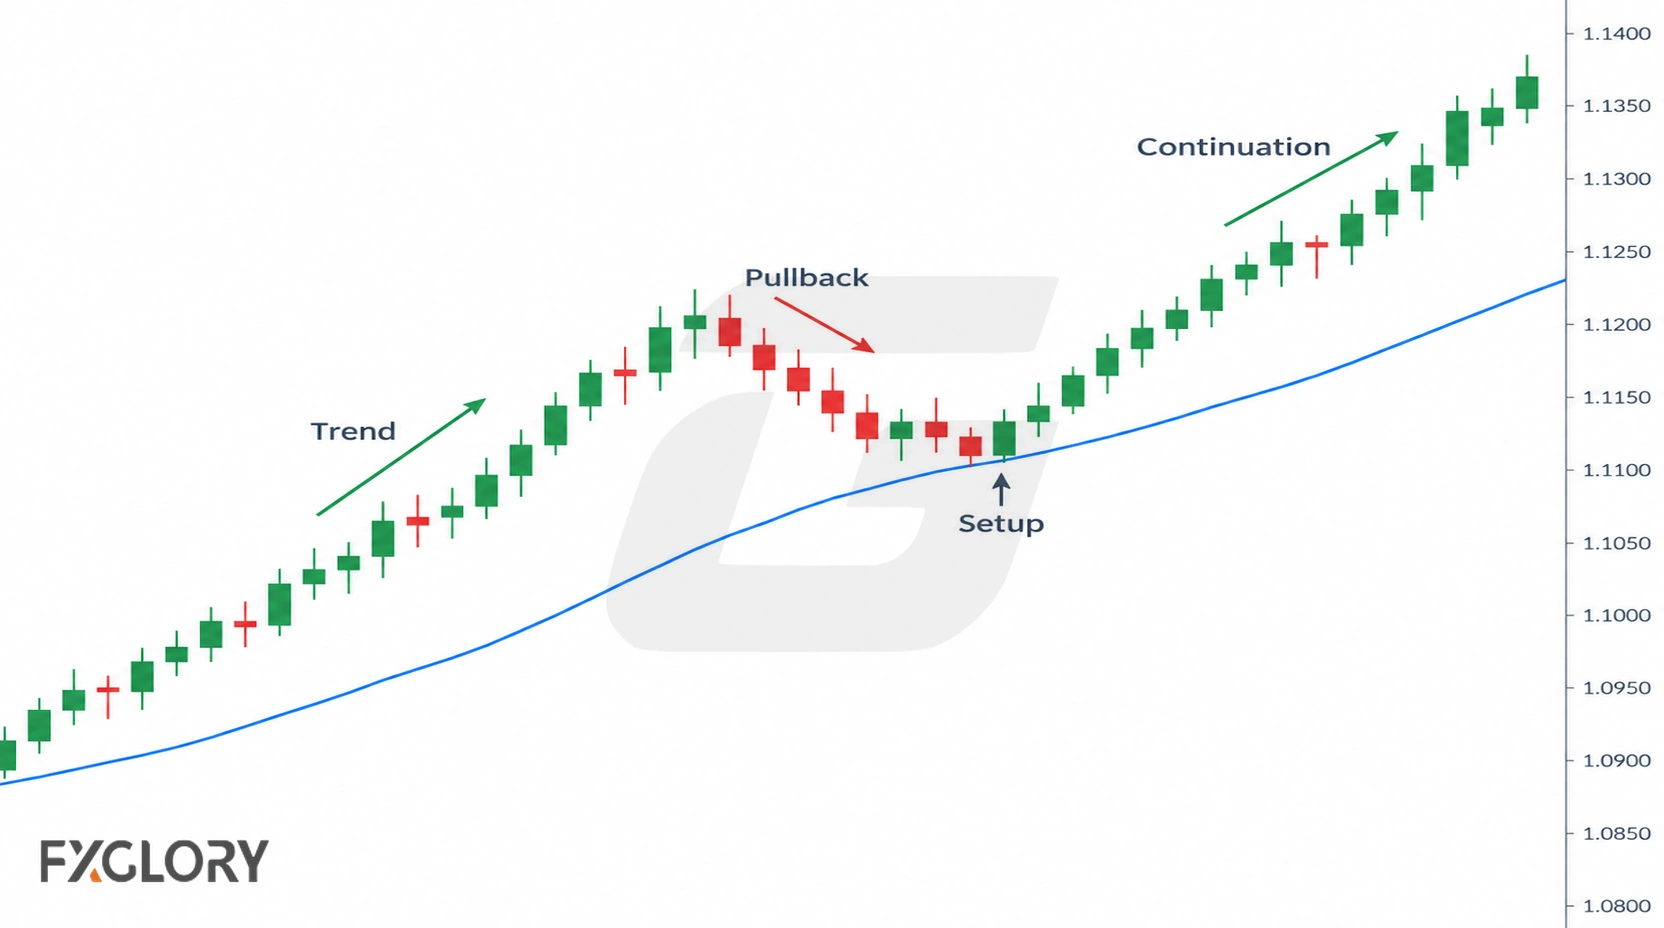
A pullback method first defines directional context, then a zone around the average where a setup could develop. The zone may be specified by price distance or ATR; the entry requires a separate observable candle or structure condition, not merely a touch.
| Step | Example rule | Skip condition |
|---|---|---|
| Trend filter | Price is above a selected average for long-side planning or below it for short-side planning | Price crosses it repeatedly within the specified review window and the chosen directional filter is not met |
| Pullback area | Price returns toward the average or a nearby structure zone | Price does not enter the defined distance from the average or marked structure |
| Setup | The setup chart shows a reaction, rejection, or structure that can define invalidation | No predeclared structural failure level can be identified |
| Trigger | The lower chart improves timing after the setup already exists | The lower chart is being used to invent a trade |
| Risk check | Spread, stop distance, news timing, and exit rule are checked before entry | The expected move is too small after costs or news risk is immediate |
For intraday execution, connect the pullback plan with the forex day trading strategy guide instead of treating the moving average as a standalone signal.
Moving Average Crossover Strategy
A moving average crossover strategy uses a faster average and a slower average. When the faster average crosses above the slower one, traders may read it as a shift toward upward momentum. When it crosses below, they may read it as a shift toward downward momentum.
A crossover is recorded when the fast and slow averages change their relative order on the chosen completed bar. Since both use earlier price data, a crossover can occur after part of a move. Multiple crosses in a specified interval show repeated changes in that classification, not proof that the wider market is sideways.
| Crossover use | What it may show | Main risk |
|---|---|---|
| Fast MA above slow MA | Shorter-term price is stronger than the slower average | The cross may appear late after a large move |
| Fast MA below slow MA | Shorter-term price is weaker than the slower average | The cross may fail in a range |
| Repeated crosses | The fast and slow averages changed order several times over the selected review window | Repeated entries may be costly if each cross is traded |
For a dedicated crossover-rule framework, review Forex Moving Average Crossover Strategy.
Moving Averages As Dynamic Support And Resistance
A moving average supplies a moving price reference. To assess whether price reacts around it, define what counts as approaching, touching, crossing, or closing away from the line; these observations alone do not make it proven support or resistance.
If the average lies near a previously marked swing high, low, or support and resistance zone, there are two visible price references to monitor. This does not establish a higher probability of a bounce. Record how price closes relative to each reference and avoid redrawing the level after the outcome is known.
Slope needs a time interval: a positive slope means the calculated average increased over the selected bars, and a negative slope means it decreased. For an N-period SMA based on closes, its one-bar change equals (current close minus the close N bars earlier) divided by N. A near-zero change does not rule out substantial price movement within the window.
Other Moving-Average-Based Tools
Envelopes, ribbons, GMMA-style groups, and MACD use moving-average calculations differently. Specify which feature of each tool is actually being measured.
| Tool | How it relates to moving averages | How to keep it controlled |
|---|---|---|
| Moving average envelopes | Plot bands around a moving average to show distance from the average | Specify the percentage or distance offset and record when price reaches or closes beyond the envelope |
| Moving average ribbons or GMMA-style tools | Use groups of averages to show compression, expansion, or trend alignment | Define the periods and whether the rule tests ordering, number of crosses, or separation between the short- and long-period groups |
| MACD | Uses moving-average relationships to show momentum shifts | Specify whether the observation concerns MACD line versus signal line, the zero line, or histogram change |
If several tools use closely related input prices, apparent agreement may duplicate information rather than provide independent confirmation.
When a moving average is paired with trend-strength review, use ADX and Moving Average Strategy. For broader pairing logic, use forex indicator combinations.
Best Moving Average Settings For Forex
A period defines the number of chart observations in the calculation, not a universal short-, medium-, or long-term horizon. The categories below are conventions; their real duration changes with the timeframe.
| Period | Common use | Main caution |
|---|---|---|
| 20 | Short-term trend or pullback reference | Can react quickly and produce more noise |
| 50 | Medium-term trend or structure filter | May still whipsaw in sideways markets |
| 100 | Slower trend filter between medium and long averages | Can react late on fast intraday moves |
| 200 | Longer trend or location filter | Can lag and should not be used as a full strategy |
Select the period and applied price before evaluation. Changing settings after seeing the outcome introduces selection bias; compare settings using consistent instruments, session filters, costs, and exits. Review FXGlory trading platforms when building a chart workspace for indicator testing.
Where The 200 SMA Fits
The 200 SMA summarizes 200 chart observations and can be assigned to a longer-horizon direction or location test. Its elapsed lookback depends on timeframe: 200 fifteen-minute candles and 200 daily candles cover very different periods.
Use the 200 SMA forex day trading strategy when the plan is specifically built around the 200-period simple moving average. This page stays broader and compares moving-average roles, types, and risks.
When Not To Use Moving Averages
The following observations can make particular MA-based rules harder to apply or trade. They are skip conditions only when the strategy explicitly defines them; they do not prove a market regime by themselves.
- Flat moving averages: The average changes little over a specified interval; inspect price swings separately before deciding whether the market lacks direction.
- Repeated average crossovers: The chosen averages reverse their ordering several times within the review window, potentially increasing crossover entries without establishing a market regime.
- Overlapping price ranges: If successive swing highs and lows remain inside a marked range, trend-continuation rules may not qualify.
- Immediate news risk: Scheduled releases can overpower technical filters.
- Wide spread: Short-target trades may become impractical after costs.
- No invalidation: The moving average should not be used to force a trade when the setup cannot define where it is wrong.
- Late timeframe switching: Do not change the chart after entry to find a moving average that supports the trade.
Spread, News, Stop, And Exit Rules
Before entry, evaluate the strategy’s separate execution and risk conditions. A price-based invalidation level helps determine stop distance; position size then determines the planned amount at risk. Margin requirements are a separate constraint.
- Spread check: Is the expected move still practical after spread?
- Stop-distance check: Does the stop come from structure instead of a random distance from the moving average?
- News check: Is a major release scheduled for the pair or related currency?
- Session check: Is the market active enough for the planned setup?
- Exit check: Is the target, invalidation exit, or time-based close rule defined before entry?
Use FXGlory spread information when testing short-target moving-average setups, and use the margin calculator to check margin requirements before comparing stop distance and position size. Start with one documented instrument from the currency-pair list to debug the rules. Once that test is reproducible, run the same fixed rules separately on other pairs and compare their results.
Practice One Moving Average Routine Before Trading Live
Begin with one defined pair, session, timeframe combination, MA rule set, and review method. Record rejected as well as accepted examples before comparing the unchanged routine with other instruments.
- Before the session: Choose the pair, session, timeframe, MA type, MA period, and key news events.
- During the session: Record price distance from the average, completed-bar crossovers, and whether the predeclared context and setup rules were satisfied.
- Before entry: Check setup quality, spread, stop distance, news timing, and invalidation.
- After exit: Record whether the MA filter was satisfied before the entry decision, whether the planned exits were followed, and any rule deviations.
- After several sessions: Group outcomes by market structure, signal type, execution costs, news exposure, and rule adherence without assuming which factor caused an individual loss.
Use the demo account information to practice one moving-average routine before applying it to live trading conditions.
Moving-Average Role Test Notes For Moving Average Forex Strategy
This hypothetical educational moving-average role test used two complementary moving-average functions: SMA or EMA pairs classified 1H trend context, while the faster 15M average marked a pullback-location reference. The separately defined 15M price trigger supplied entry timing. It compares SMA 20/50, SMA 50/100, SMA 100/200, EMA 20/50, EMA 50/100, and EMA 100/200 under the same setup, trigger, stop, target, session, and cost assumptions. It does not test every moving-average method, crossover method, dynamic support/resistance method, MACD method, ribbon method, GMMA-style method, discretionary routine, or complete trading plan.
The model reviewed EURUSD, GBPUSD, USDJPY, AUDUSD, USDCAD, and USDCHF using public yfinance 15-minute OHLC data where available. The 1H candles are resampled from the same 15-minute data so that the context chart and setup chart use a fixed relationship.
| Rule Area | Educational Model Rule |
|---|---|
| Compared variants | SMA 20/50, SMA 50/100, SMA 100/200, EMA 20/50, EMA 50/100, and EMA 100/200 |
| Context chart | 1H fast and slow moving averages define long or short context |
| Setup chart | 15M pullback toward the fast moving average with candle confirmation |
| Trigger chart | 15M break of the previous 6-candle trigger range |
| Long context | 1H close above the slow moving average, fast average above slow average, and slow-average slope positive |
| Short context | 1H close below the slow moving average, fast average below slow average, and slow-average slope negative |
| Long setup | 15M pullback near the fast average, bullish close, upper 40% close location, and limited extension from the fast average |
| Short setup | 15M pullback near the fast average, bearish close, lower 40% close location, and limited extension from the fast average |
| Session grouping | London morning, London/New York overlap, early New York afternoon, and a separately reported rollover/off-hours group |
| Entry | Next 15M open after the completed trigger candle |
| Stop | 15M setup candle extreme with a 0.25 ATR(14) buffer |
| Target comparison | Fixed 1.3R target from entry |
| Invalidation exit | 15M close beyond the setup candle extreme against the trade |
| Same-day exit | Forced close at the last available 15M close at or before 20:45 UTC |
| Cost Input | Assumptions Used |
|---|---|
| Spread | 0.5, 1.5, and 3.0 pips |
| Slippage | 0.1, 0.5, and 1.0 pips per side |
| Baseline comparison | 1.5-pip spread and 0.5-pip slippage per side |
| Swap and rollover | Not included because trades are forced flat before the same-day cutoff |
The review records setup candidates, triggered trades, accepted trades, rejected candidates, rejection reasons, trade count, win rate, average win in R, average loss in R, expectancy in R, profit factor, maximum drawdown in R, worst losing streak, holding time, same-day cutoff exits, variant-level behavior, moving-average type behavior, period-pair behavior, session-level behavior, pair-level behavior, direction-level behavior, exit reasons, and spread/slippage sensitivity.
Educational Moving-Average Role Test Results
The baseline run was negative: -0.3353R expectancy and -340.6266R total net result across 1,016 trades. The test used a 1.5-pip spread and 0.5-pip slippage per side. These figures are hypothetical historical results from one educational moving-average role-comparison model, not proof of future live-trading performance.
| Metric | Baseline Result |
|---|---|
| Setup candidates | 14,066 |
| Triggered trades before overlap filter | 1,774 |
| Accepted trades | 1,016 |
| Rejected candidates | 13,050 |
| Pre-overlap trigger acceptance rate | 12.61% |
| Setup rejection rate | 92.78% |
| Win rate | 36.32% |
| Average win | 0.8065R |
| Average loss | -0.9864R |
| Expectancy | -0.3353R |
| Profit factor | 0.4663 |
| Maximum drawdown | -349.5344R |
| Worst losing streak | 34 |
| Average holding period | 186.25 minutes |
| Same-day cutoff exit rate | 13.19% |
| Invalidation exit rate | 4.53% |
Acceptance-rate stages: The stored 12.61% trigger acceptance rate equals 1,774 preliminary triggered trades divided by 14,066 setup candidates. After the overlap and other rejection gates, 1,016 of 14,066 candidates became accepted trades (7.22%). Both values are derived from existing counts; the original research objects are unchanged.
| Rejected Condition | Count |
|---|---|
| setup invalidated before trigger | 2999 |
| no valid 15M trigger | 7418 |
| outside operating window or Friday cutoff | 1850 |
| invalid trade after trigger or risk gate | 25 |
| same pair variant overlap | 758 |
Variant-Level Baseline Results
| Variant | Trades | Win Rate | Expectancy | Total Net Result | Max Drawdown | Worst Losing Streak |
|---|---|---|---|---|---|---|
| EMA 100/200 | 130 | 36.15% | -0.3380R | -43.9361R | -44.4395R | 11 |
| EMA 20/50 | 271 | 34.69% | -0.3516R | -95.2965R | -98.8735R | 11 |
| EMA 50/100 | 190 | 40.53% | -0.2514R | -47.7667R | -51.5495R | 9 |
| SMA 100/200 | 101 | 30.69% | -0.4052R | -40.9290R | -40.5550R | 14 |
| SMA 20/50 | 195 | 35.90% | -0.3659R | -71.3482R | -70.9108R | 11 |
| SMA 50/100 | 129 | 38.76% | -0.3205R | -41.3501R | -43.6669R | 10 |
Moving-Average Type Baseline Results
| MA Type | Trades | Win Rate | Expectancy | Total Net Result | Max Drawdown | Worst Losing Streak |
|---|---|---|---|---|---|---|
| EMA | 591 | 36.89% | -0.3164R | -186.9993R | -193.3825R | 21 |
| SMA | 425 | 35.53% | -0.3615R | -153.6272R | -154.9113R | 19 |
Period-Pair Baseline Results
| Period Pair | Trades | Win Rate | Expectancy | Total Net Result | Max Drawdown | Worst Losing Streak |
|---|---|---|---|---|---|---|
| 20/50 | 466 | 35.19% | -0.3576R | -166.6447R | -171.0249R | 18 |
| 50/100 | 319 | 39.81% | -0.2794R | -89.1168R | -94.6762R | 14 |
| 100/200 | 231 | 33.77% | -0.3674R | -84.8651R | -85.6199R | 21 |
Entry-Session Baseline Results
| Entry Session | Trades | Win Rate | Expectancy | Total Net Result | Same-Day Cutoff Exit Rate |
|---|---|---|---|---|---|
| Early New York afternoon | 121 | 33.88% | -0.3327R | -40.2558R | 63.64% |
| London/New York overlap | 430 | 37.21% | -0.3145R | -135.2453R | 7.21% |
| London morning | 437 | 38.22% | -0.3457R | -151.0716R | 1.14% |
| Rollover/off-hours | 28 | 3.57% | -0.5019R | -14.0538R | 75.00% |
Selected Spread And Slippage Sensitivity
| Spread | Slippage | Trades | Weighted Win Rate | Weighted Expectancy | Total Net Result |
|---|---|---|---|---|---|
| 0.5 pips | 0.1 pips per side | 1016 | 39.66% | -0.1882R | -191.2239R |
| 1.5 pips | 0.5 pips per side | 1016 | 36.32% | -0.3353R | -340.6266R |
| 3.0 pips | 1.0 pips per side | 1016 | 32.58% | -0.5395R | -548.1302R |
| Exit Reason | Count |
|---|---|
| invalidation 15M close beyond setup extreme | 46 |
| same day cutoff exit | 134 |
| stop first same bar | 4 |
| stop loss | 426 |
| target 1.3R | 230 |
| time exit | 176 |
What This Moving-Average Role Test Shows
All six SMA/EMA variants had negative baseline expectancy in this hypothetical sample. The detailed results above include 1,016 accepted trades across the six variants and preserve the separate instrument, session, MA-type, period-pair, and exit breakdowns.
EMA 50/100 had the least-negative reported variant expectancy (-0.2514R); the pooled 50/100 period pair had -0.2794R. These are results for this model and sample, not independent evidence of a generally superior setting. All variant results remain negative.
The study can be used to ask whether a predefined MA context and pullback filter changes the number of qualifying setups and their net R outcomes under stated execution costs. The aggregates cannot independently establish causality, and the original data do not identify precise usable-bar dates for each pair; source logs would be required to verify those dates and completed-hour resampling timing.