
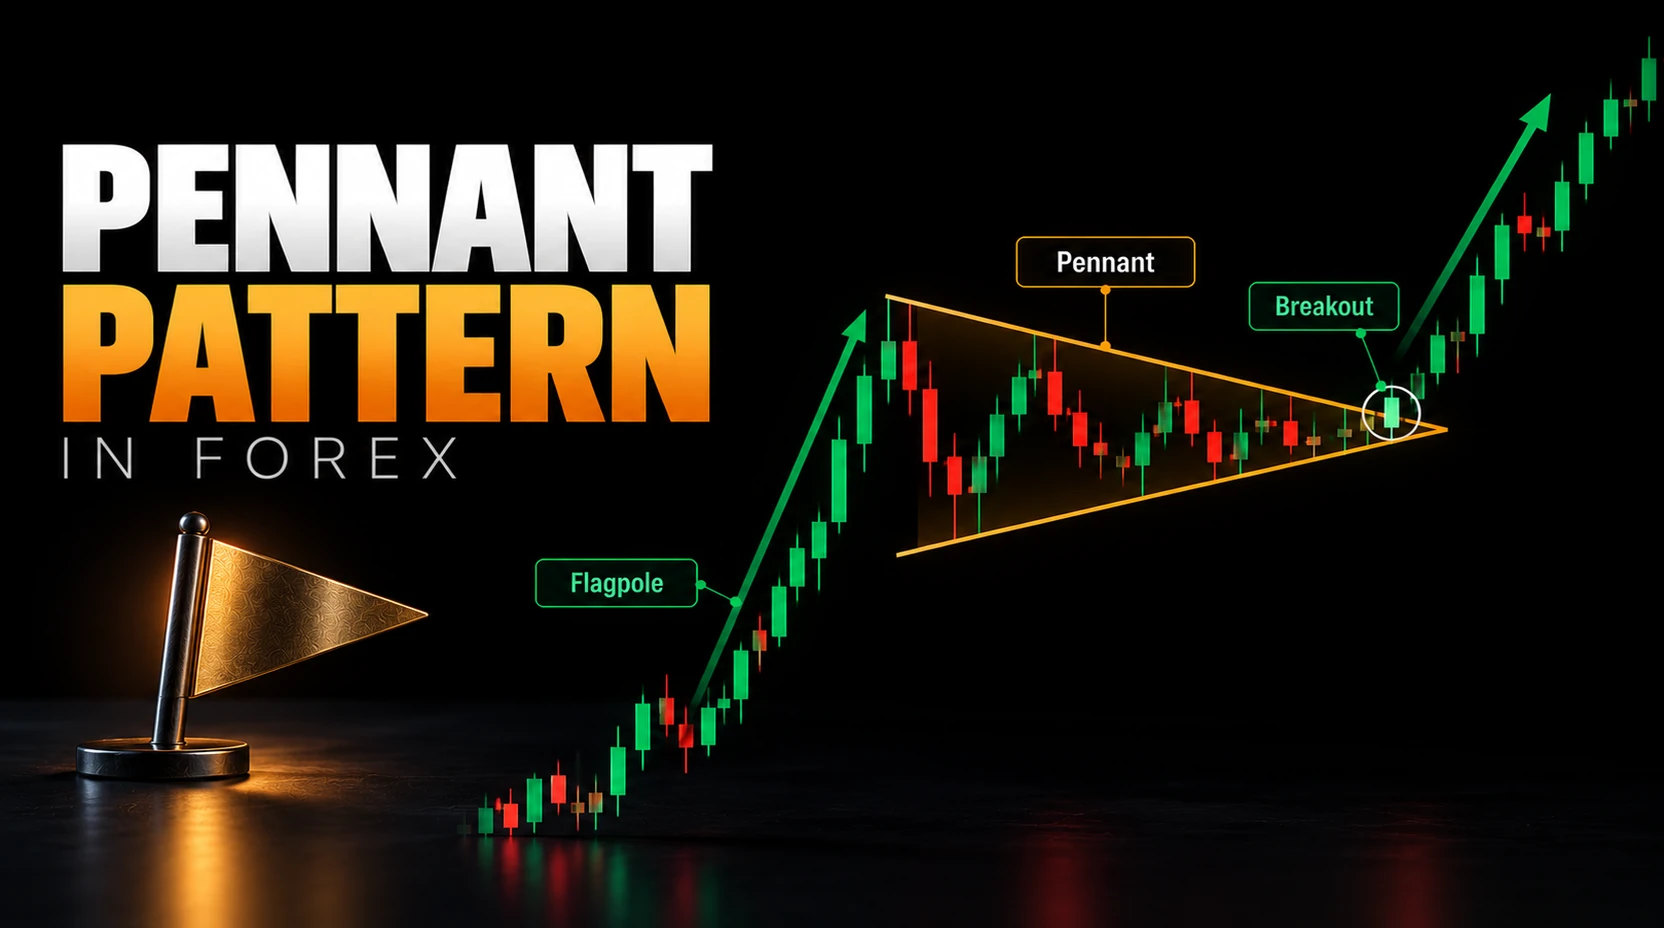
What Is a Pennant Pattern in Forex?
A pennant pattern in forex is a compact chart structure that may form after a sharp directional move. A short consolidation develops between converging boundaries; traders then observe whether price resumes the earlier move or breaks in another direction.
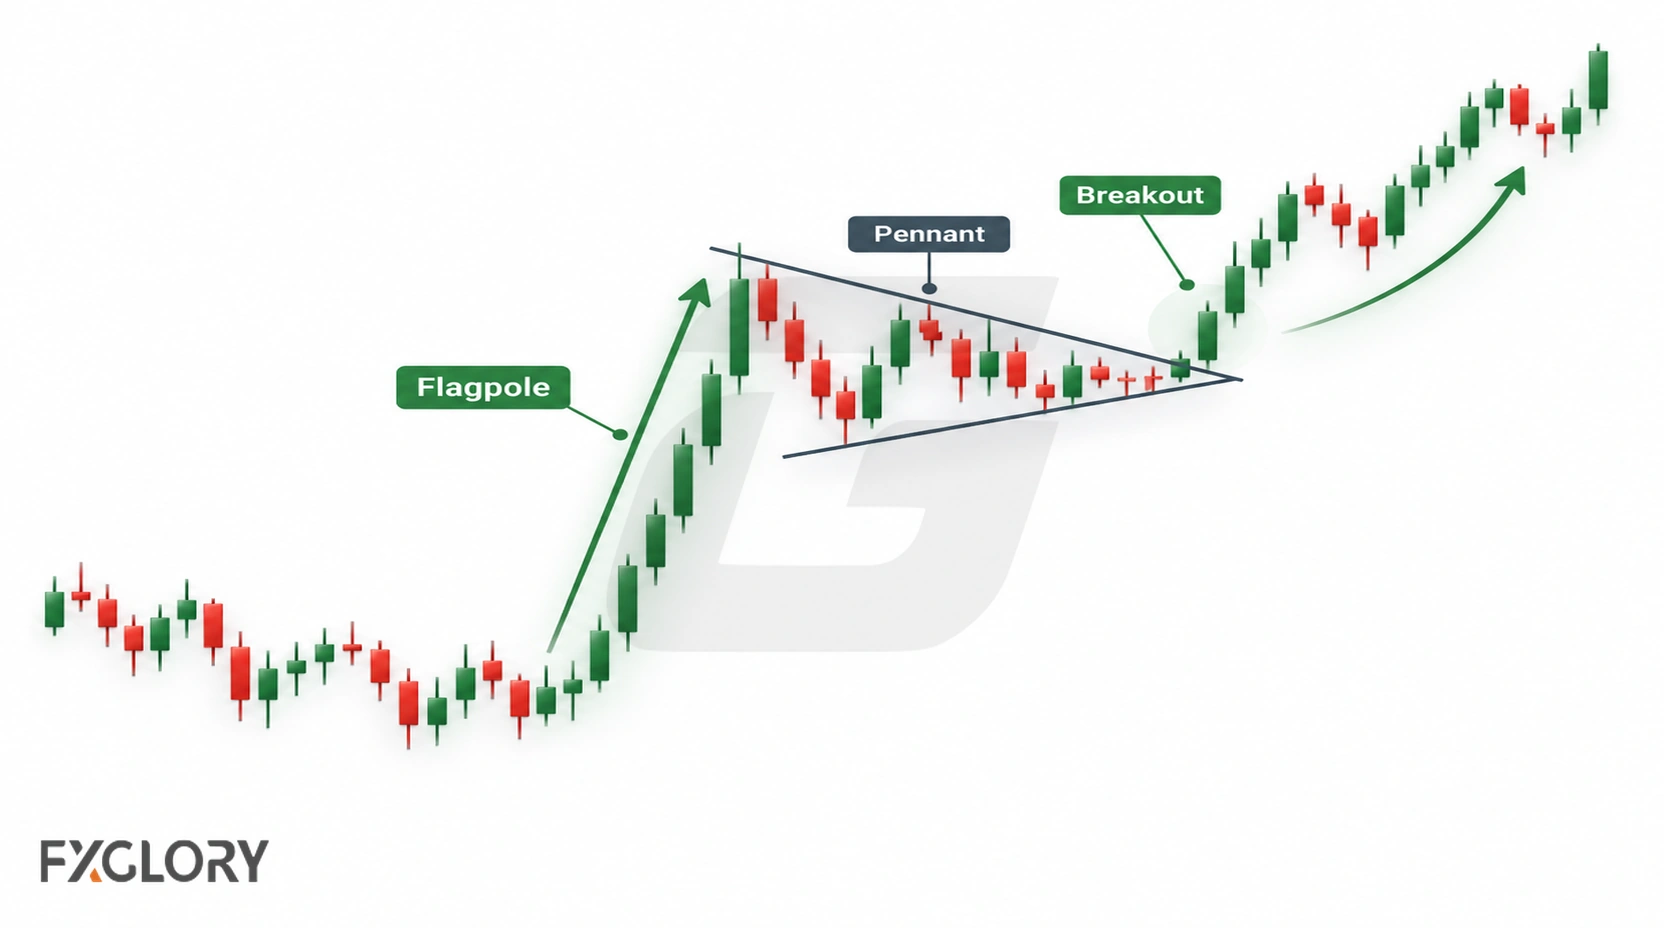
The initial impulse is the flagpole, and the narrowing pause is the pennant body. Pennants are classified as potential continuation patterns, not independent buy or sell signals. See the trend-pause pattern guide for the broader category.
How Pennant Patterns Form in Forex
A pennant begins with a comparatively fast upward or downward price move, followed by smaller swings that narrow as buyers and sellers reassess the move. Profit-taking, changing order flow, and reduced short-term volatility are possible explanations, but the chart alone cannot establish which caused the pause.
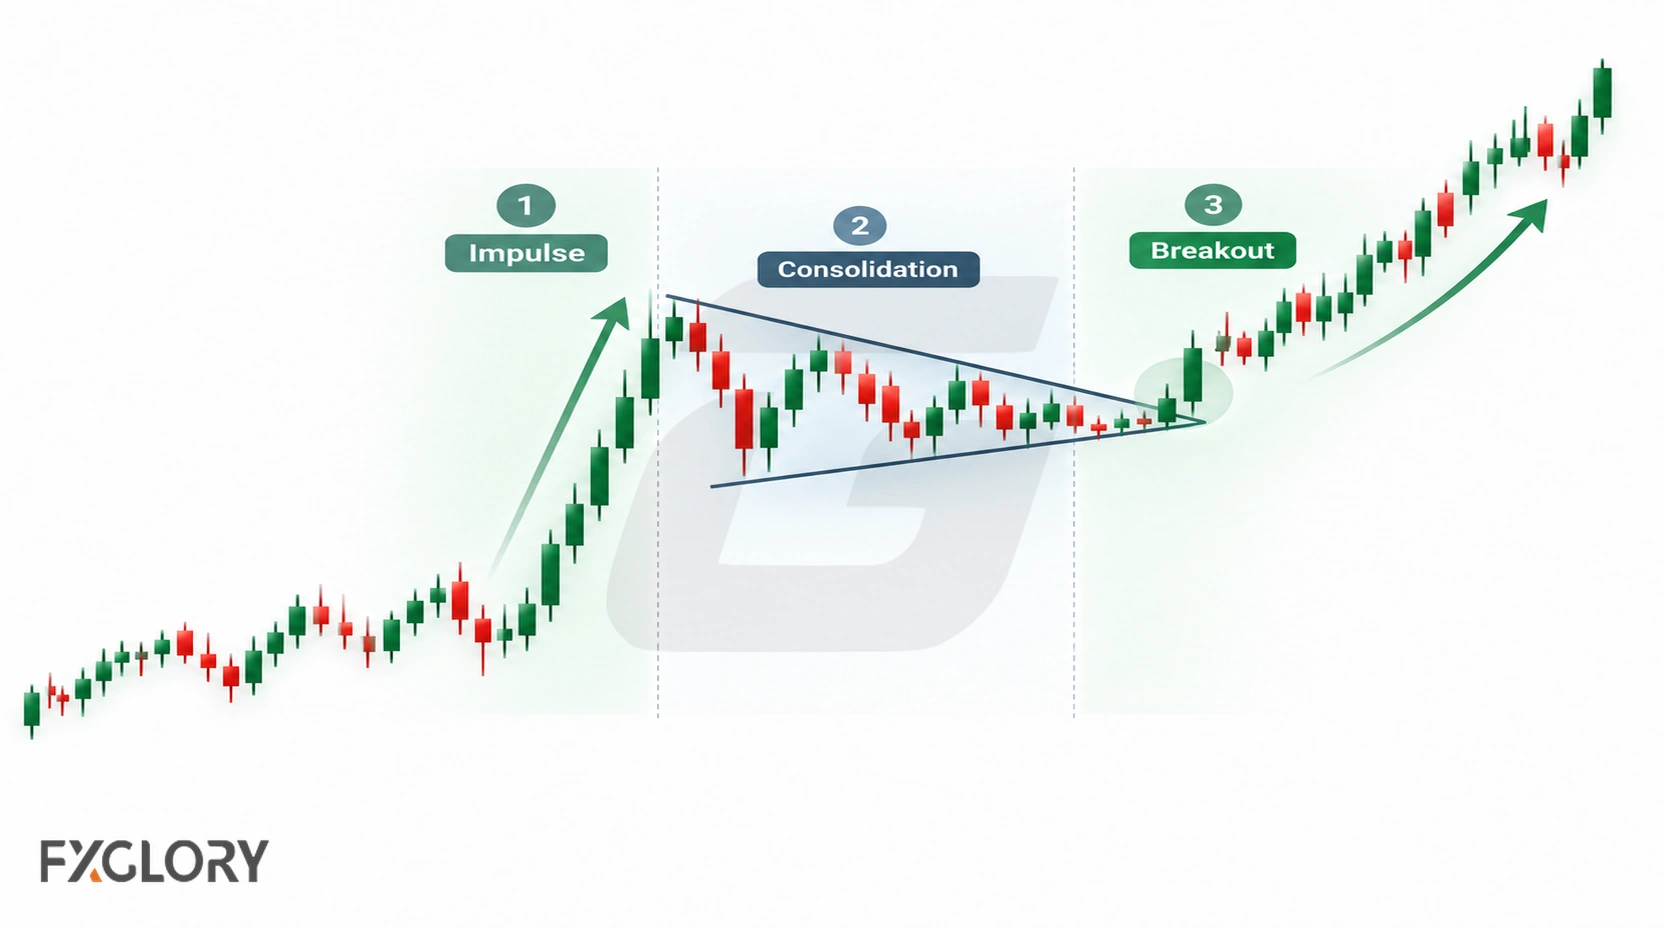
The consolidation should remain short and small relative to the flagpole on the timeframe being examined. Its boundaries are drawn from identifiable swing reactions, not adjusted repeatedly to make the chart fit. Once the flagpole and compact converging body can be identified, the pennant structure is recognizable even before a breakout. Whether price confirms continuation is a separate question; it may also break against the flagpole or remain in consolidation.
Pennant Pattern Anatomy
Use the chart and table to identify the structural parts before evaluating what price does at a boundary.
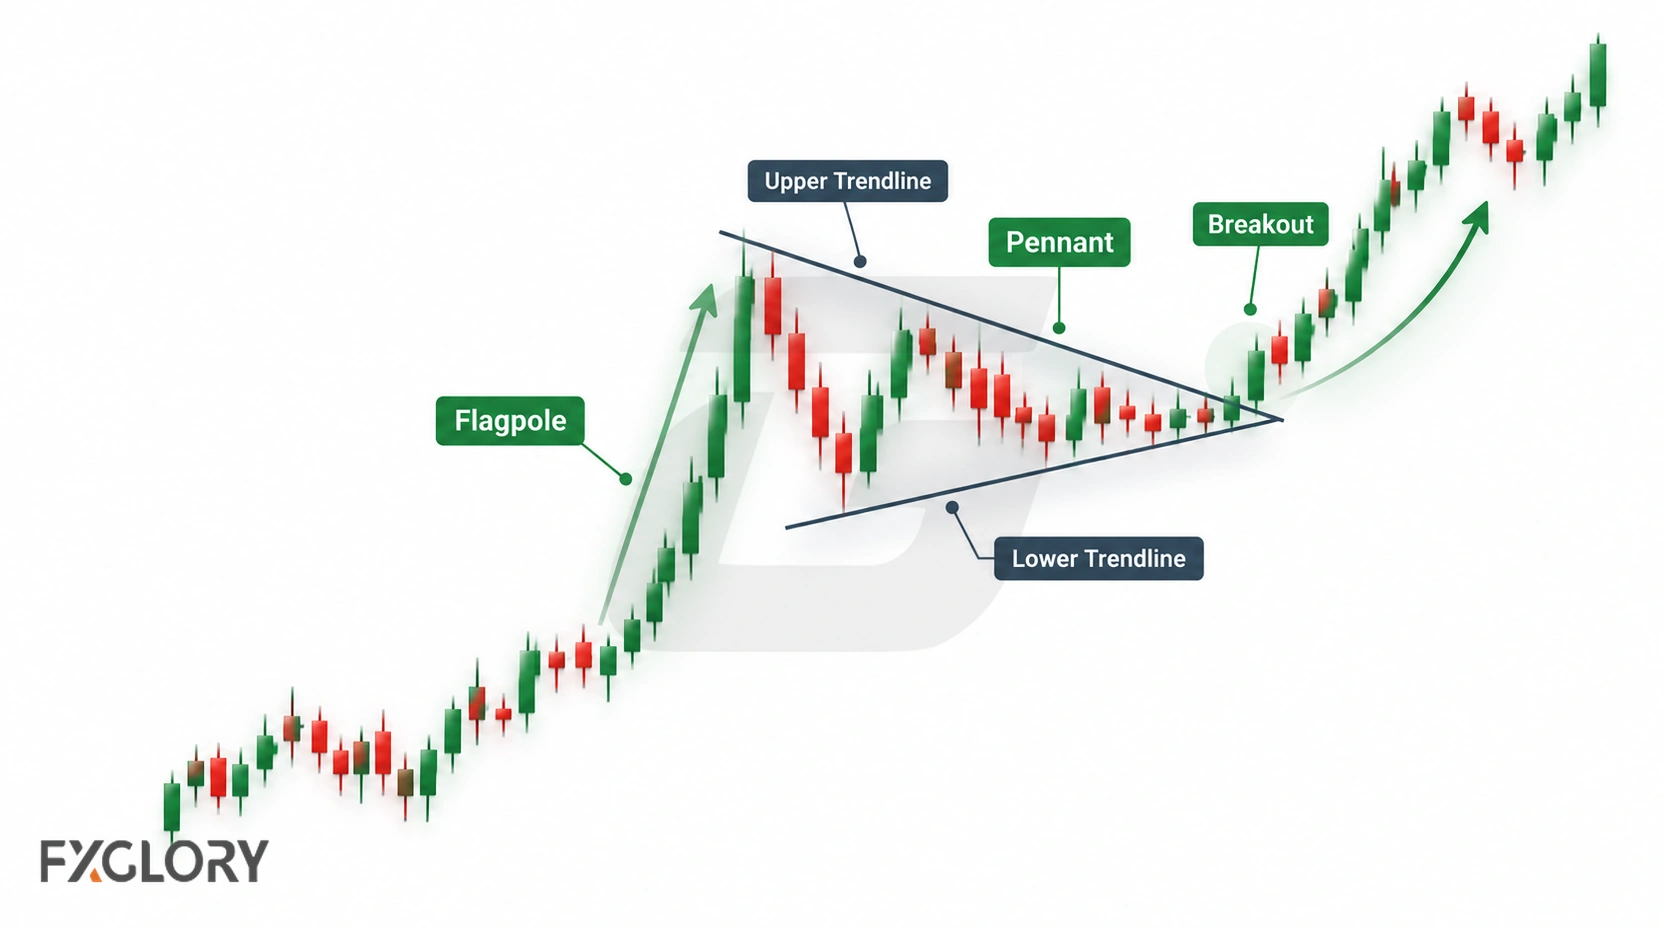
| Element | What to identify | Interpretation |
|---|---|---|
| Flagpole | A distinct, rapid move preceding the pause | Establishes the directional context for a potential continuation |
| Pennant body | A brief cluster of contracting swings | Shows consolidation proportionate to the initial move |
| Upper and lower boundaries | Converging lines based on visible price reactions | Mark areas where a break or rejection can be assessed |
| Breakout | Price moves outside a boundary | Begins a possible continuation or counter-move scenario; a spike alone may fail |
| Retest | Price revisits a broken boundary | May show acceptance or rejection of the breakout, but is not required |
Bullish Pennant Pattern in Forex
A bullish pennant follows an upward flagpole. Its short converging pause attracts attention because a break above the upper boundary could extend that move.
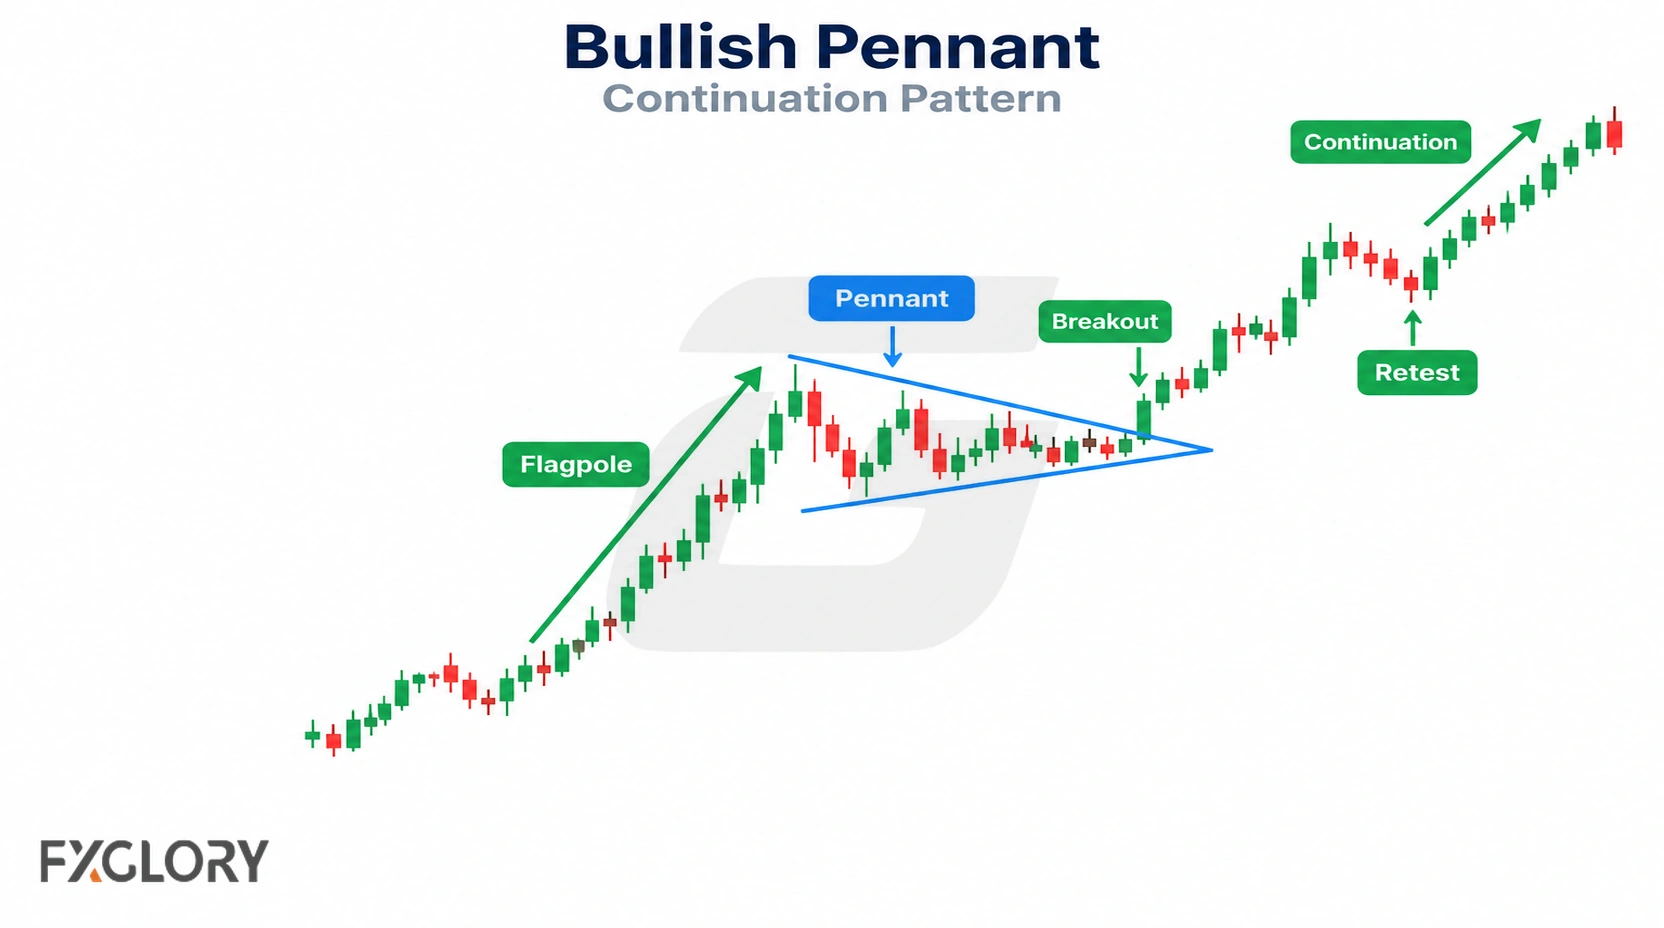
First identify the impulse high, the swing points enclosing the pause, and the upper boundary. An upside close outside that boundary provides different evidence from a momentary wick through it. Further movement outside the range can support the interpretation, while a sustained return inside challenges the breakout scenario. A downward break can invalidate the expected bullish continuation.
Bearish Pennant Pattern in Forex
A bearish pennant follows a downward flagpole. Traders examine the narrowing pause for a possible break beneath its lower boundary.
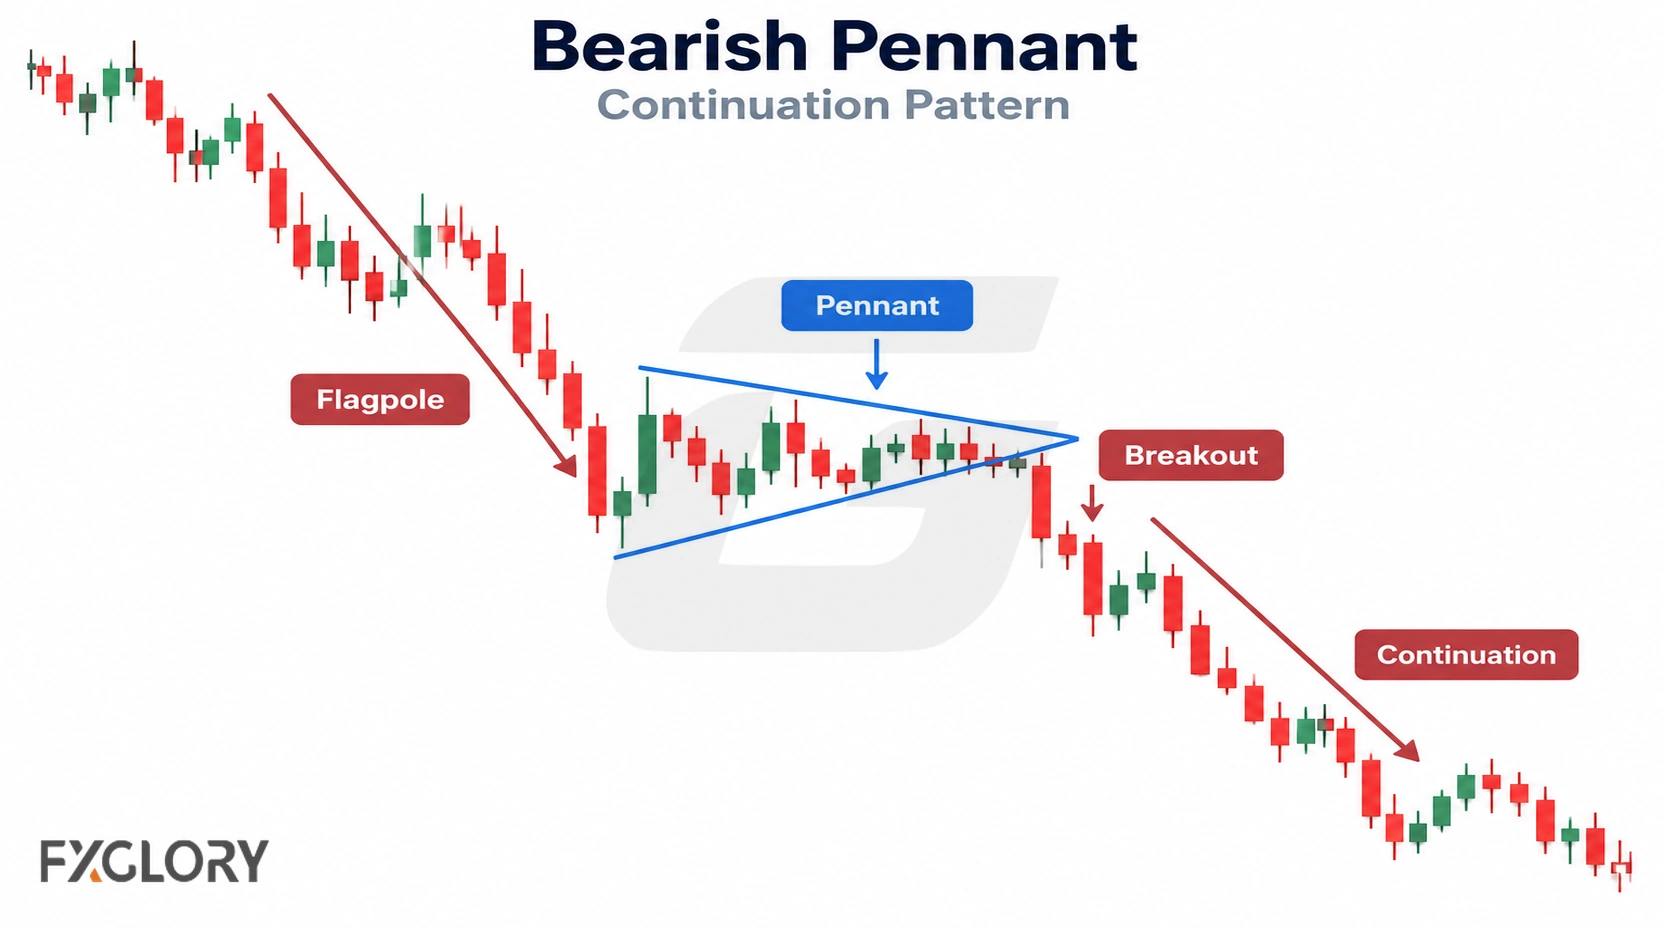
Identify the impulse low and the converging swings before assessing the downside boundary. A close beneath it can be the initial breakout observation; continued trading below or a subsequent retest supplies additional, not mandatory, evidence. A sustained move back inside the range or an upside break undermines the expected bearish continuation.
Pennant vs Flag vs Triangle vs Wedge
These structures can resemble one another, so compare the boundaries and the move preceding the consolidation rather than using the name alone.
| Structure | Quick Clue | Careful Reading |
|---|---|---|
| Pennant | Compact converging pause after a sharp move | Usually tied closely to a prior impulse move |
| Flag | Short channel-like pause after a sharp move | Often has more parallel boundaries than a pennant |
| Triangle | Broader compression between converging or partly converging boundaries | Can be continuation, neutral, or reversal-like depending on context |
| Wedge | Narrowing structure that usually slopes upward or downward | Read slope, location, trend context, and boundary behavior together |
A flag pattern in forex typically has more parallel, channel-like boundaries. For broader compression without a distinct short flagpole, compare triangle patterns; for pronounced sloping convergence, see wedge patterns.
Strong vs Weak Forex Pennant Patterns
Pattern quality concerns how convincingly the chart fits the definition; it does not establish a probability of success. Compare identifiable features rather than assuming that a neat formation must produce a profitable breakout.
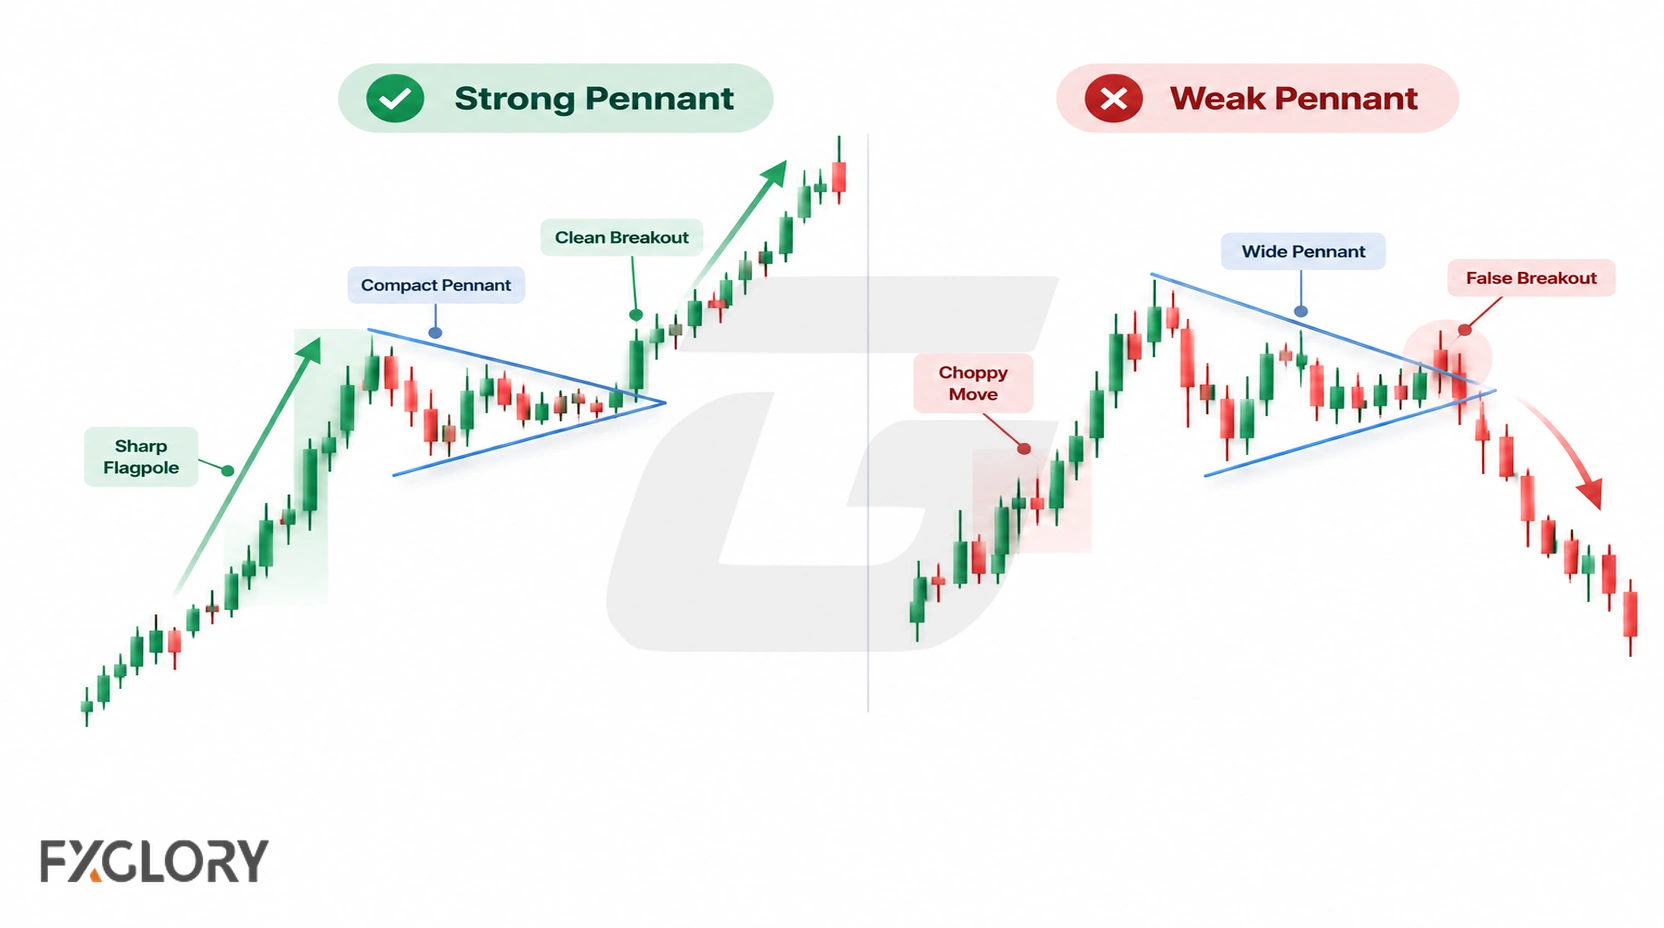
| Factor | More convincing structure | Less convincing structure |
|---|---|---|
| Flagpole | Rapid and clearly directional | Choppy or barely distinguishable |
| Body relative to flagpole | Compact and brief | Broad, prolonged, or expanding |
| Boundaries | Supported by visible swing reactions | Require repeatedly redrawn lines or a single isolated wick |
| Convergence | Swings noticeably narrow | Swings remain wide or irregular |
Breakout success is a separate question from formation quality. Even a well-defined pennant can fail after price leaves its boundaries.
How to Identify and Confirm a Forex Pennant
Identification describes the shape; confirmation concerns the subsequent price action. A practical sequence is:
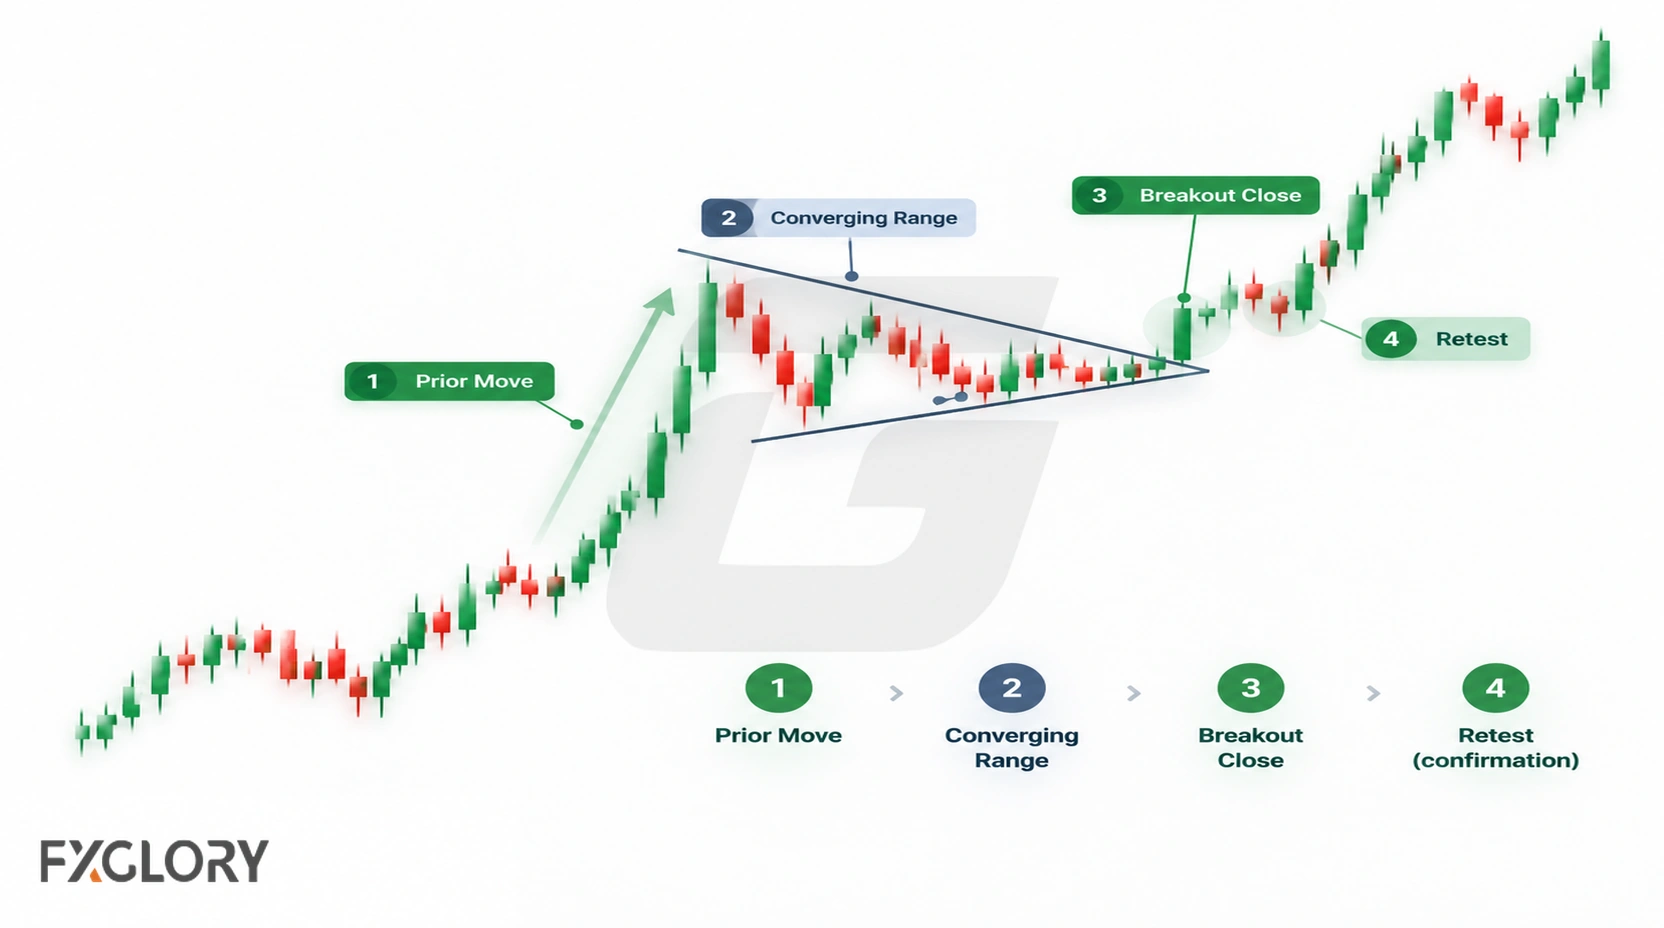
- Locate the impulse: Find a clear move and determine its direction.
- Draw the consolidation: Check that the pause is brief, proportionate, and bounded by converging swing lines.
- Check nearby context: Mark higher-timeframe support or resistance and upcoming major economic releases.
- Observe the initial break: Note which line is crossed and whether a candle closes outside, rather than relying only on a wick.
- Evaluate follow-through: Subsequent closes outside may strengthen the breakout interpretation. A retest, if it occurs, can provide separate evidence of acceptance or rejection; it is not a required step.
- Set a scenario-specific invalidation: Define the price behavior that would negate the interpretation before considering a trade.
Neither a closing breakout candle nor a successful retest guarantees continuation. Detailed execution rules belong in a forex breakout strategy, rather than in the definition of the chart pattern.
Invalidation: When a Pennant Scenario Fails
Separate pattern disqualification from breakout invalidation. A missing flagpole, widely separated swings, or repeatedly forced boundaries mean the structure was not a convincing pennant in the first place. After a plausible breakout, a sustained move back within the consolidation or through the opposite side may invalidate that particular continuation interpretation.
Where invalidation belongs depends on the stated setup: one trader might require a close back inside the pennant, while another may use a particular swing beyond the opposite boundary. Neither is a universal stop-loss location. Stops reflect the chosen strategy and price structure; position size depends on stop distance, contract or pip value, and the predetermined account-risk limit.
A traditional measured-move projection takes the flagpole's price distance and projects it from a defined breakout level in the breakout direction. It is a geometric reference, not an observed success rate or a guaranteed target; the worked calculation appears in the GBP/USD example.
Forex Context: Sessions, News, Spread, Slippage, and Volume
Currency pairs trade across global sessions, and the same-looking formation can meet very different trading conditions.
- Sessions and liquidity: Activity and available liquidity vary, affecting the behavior of breaks and retests.
- News: Economic releases can cause rapid repricing that overwhelms chart boundaries.
- Spreads and slippage: Entry and exit prices can differ from the level displayed on a chart, especially during fast or thin trading.
- Higher timeframes: A lower-timeframe breakout may run into a nearby larger support or resistance area.
- Currency-pair differences: Volatility, trading hours, and costs vary by instrument and broker.
- Volume limitations: Spot forex has no unified exchange-wide volume figure. Broker tick-volume readings reflect quote changes from that feed, not total market transactions.
Using Indicators and Candles With Pennant Patterns
Secondary tools answer different questions; none independently verifies that a pennant will continue.
| Tool Type | What It Can Help Read | Careful Use |
|---|---|---|
| Momentum indicators | Whether pressure supports or weakens the continuation idea | Momentum can shift before or after the breakout and still needs context |
| Trend indicators | Whether the broader trend supports continuation | They may lag after a sharp move or during compression |
| Volatility indicators | Whether movement contracts during the pause or expands around the break | High volatility can increase execution risk around breakouts |
| Candlestick reactions | Short-term rejection or hesitation near a pennant boundary | One candle is not the same as a full pennant structure |
| Tick activity | Activity around a boundary break or retest | It is supporting context, not centralized market volume |
An ATR reading can describe recent movement size but not breakout direction. Candlestick patterns may clarify the short-term reaction at a boundary. Avoid treating several correlated indicators as independent proof of a breakout.
Hypothetical GBP/USD Pennant Example
Suppose GBP/USD rises from 1.2500 to 1.2580, producing an 80-pip flagpole. Price then forms a short converging pause with illustrative upper reactions at 1.2575 and 1.2568 and lower reactions at 1.2545 and 1.2552. Those swing levels are invented to explain the shape; they are not historical observations or live quotes.
| Subsequent price action | What it suggests |
|---|---|
| A candle closes above the current upper pennant boundary and later prices remain above it | An upside continuation scenario has initial and follow-through evidence |
| Price briefly crosses the upper line but closes back within the pennant | A possible false break; a wick alone did not establish continuation |
| Price closes below the lower boundary and remains beneath it | The bullish continuation expectation is challenged |
| Price keeps trading sideways as the body broadens | The expanding or prolonged consolidation may no longer fit a compact pennant and may need reclassification |
If an illustrative breakout occurs at 1.2580, projecting the 80-pip flagpole from that level gives 1.2660. The projection says nothing about the probability of reaching that price. A trading decision would additionally require a defined invalidation level, trading-cost assumptions, and position sizing consistent with the trader's risk limit.
Common Mistakes With Forex Pennant Patterns
- Fitting lines after the fact: Repeatedly changing boundaries to include every wick makes the identification subjective.
- Confusing a spike with a breakout: A transient crossing may reverse before the candle closes.
- Assuming a retest is mandatory: Some breaks continue without revisiting a boundary; others retest and fail.
- Ignoring execution costs: A chart-based entry level may not be available at the expected spread or fill price.
- Using a measured-move target as a promise: The flagpole projection is a conventional estimate, not an observed success rate.
Putting Pennant Patterns in Context
A pennant identifies a brief converging pause after an impulse. The distinction between a well-formed shape and a confirmed break matters more than the bullish or bearish label. Compare the structure with flags, triangles, and wedges; then assess the actual breakout, relevant market conditions, and the selected scenario's invalidation before making a trading decision.