
Backtest Overview: 6,518 Trades Across Six Pairs
The Holy Grail is a trend-following pullback concept associated with Linda Bradford Raschke. The original concept uses ADX to identify a strong trend and an exponential moving average as the pullback reference. The historical model tested on this page is a modified forex implementation that uses a 20-period Simple Moving Average (SMA), breakout confirmation, and ATR-based trade management.
To evaluate the modified rule set consistently, the test encoded explicit entry, stop, trailing-stop, and exit conditions and applied them across six major forex pairs over the stated 2014-2024 period.
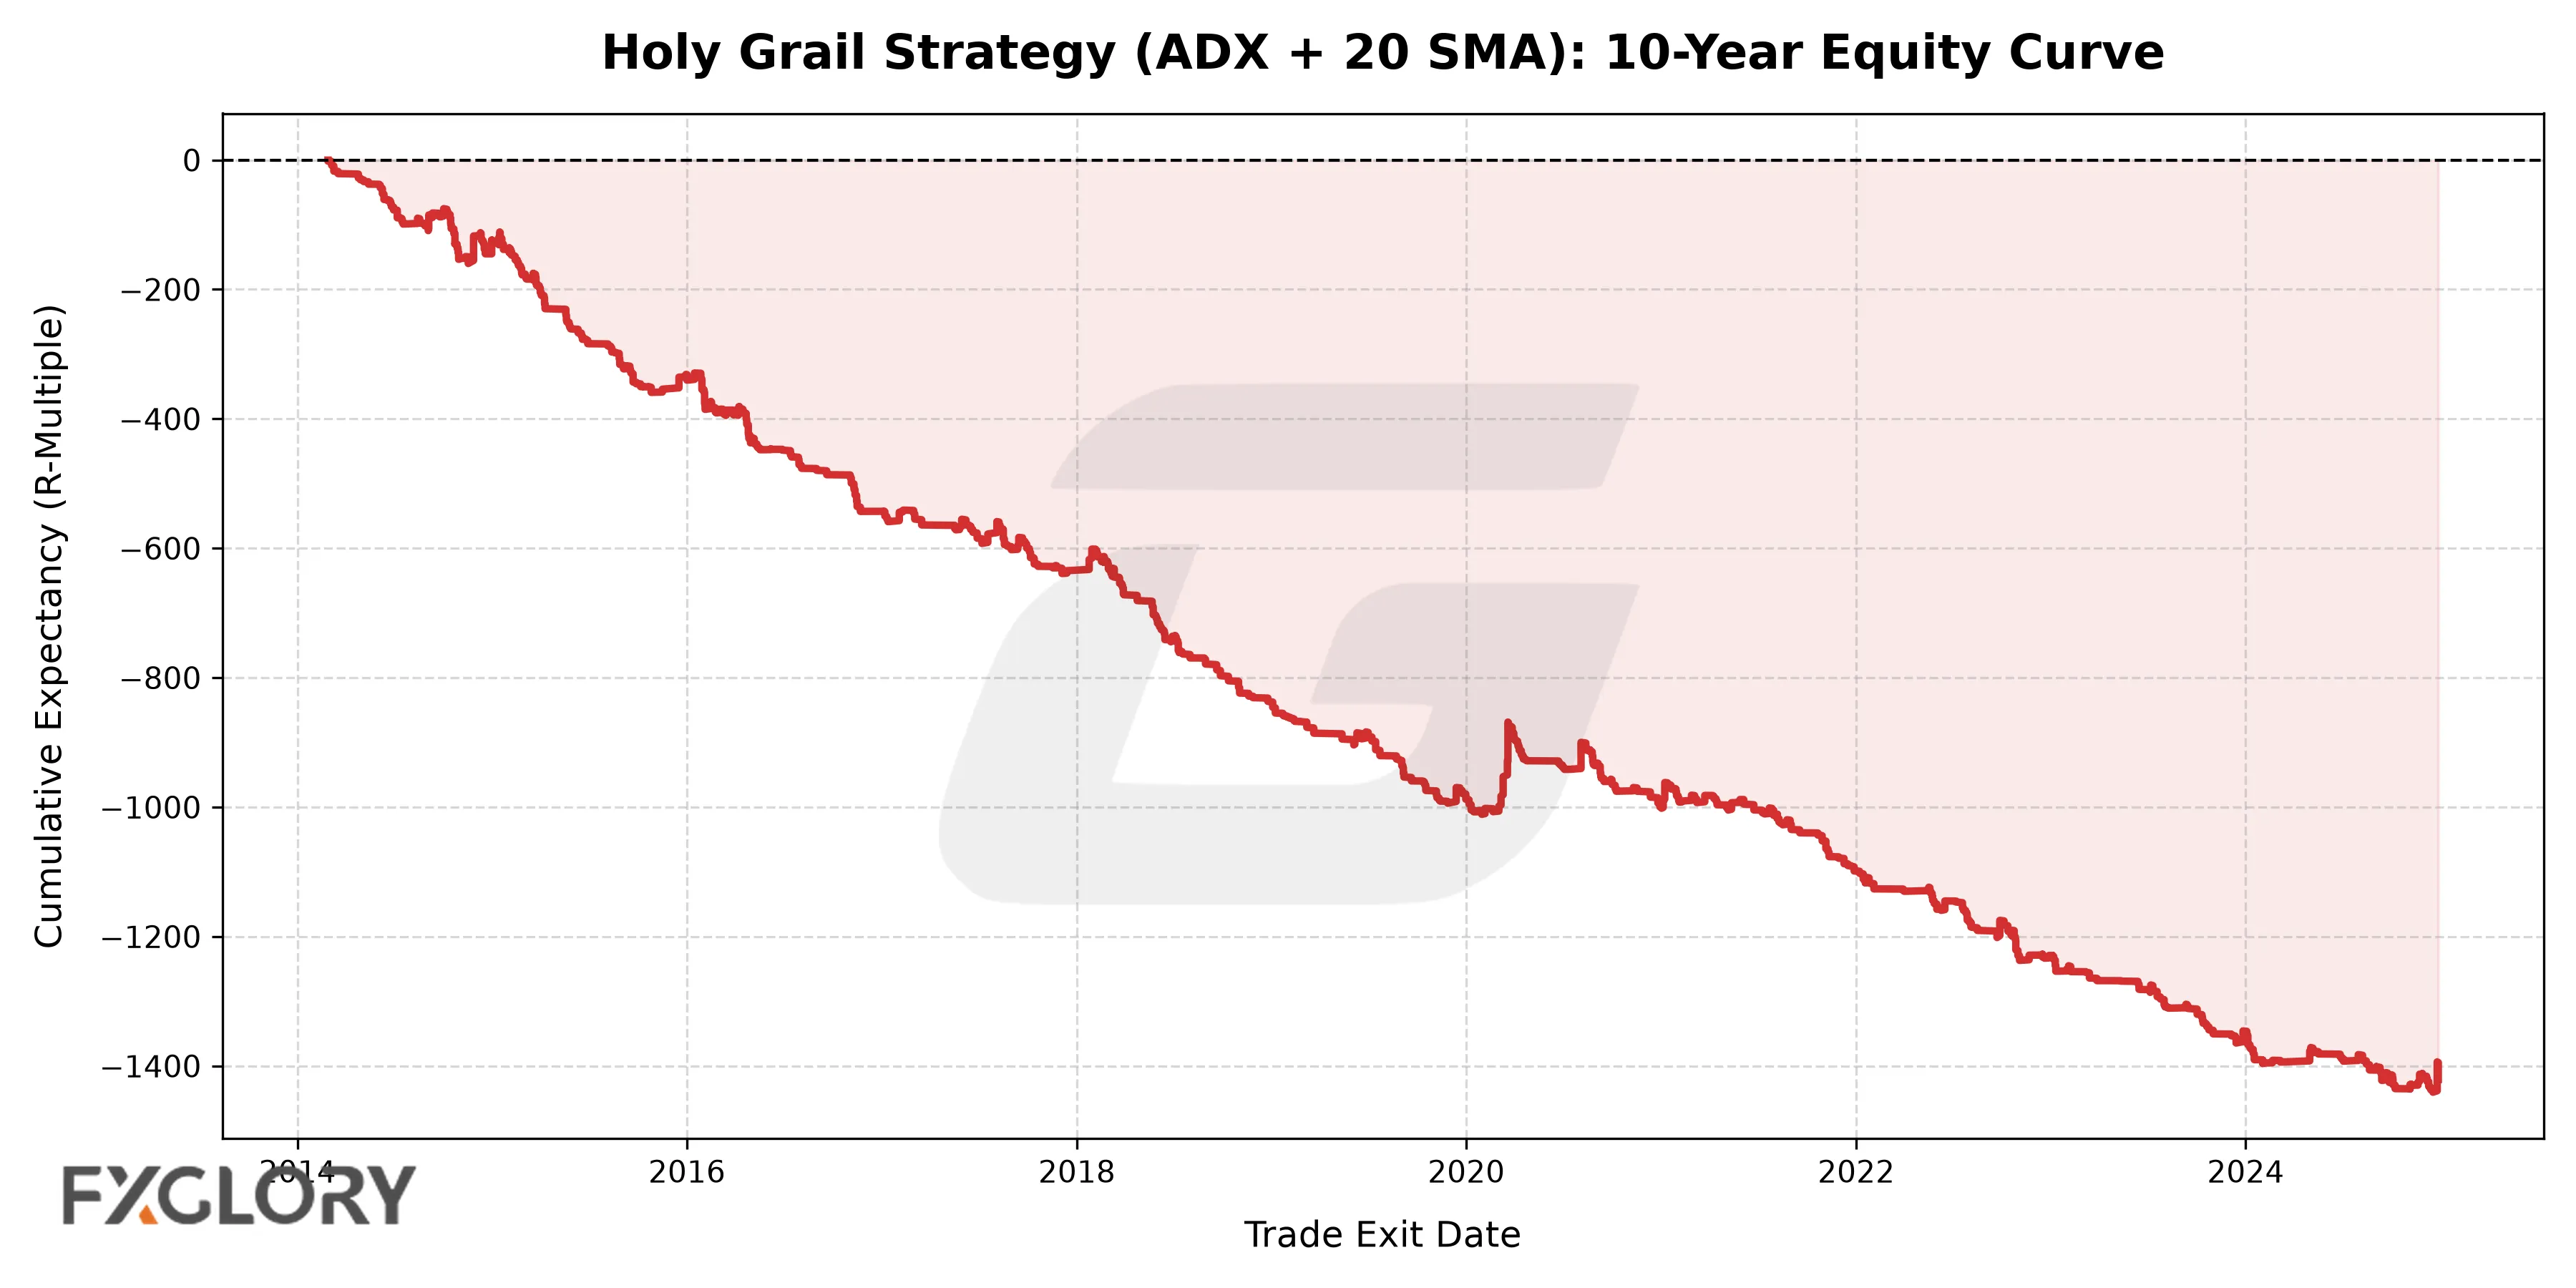
The tested model produced negative historical expectancy.
Across 6,518 trades, the model generated a 20.3% win rate, -0.218R expectancy, a 0.45 profit factor, and a combined maximum drawdown of -1,421.56R. The drawdown is reported in R, a risk-unit measure. It cannot be converted directly into a percentage account drawdown without an explicit position-sizing, compounding, and equity model.
The Holy Grail Concept: ADX + Moving Average Pullback
Distinguishing the Strategy from Custom Indicators
The Holy Grail name is also used by unrelated custom indicators and automated tools. Those products should not be assumed to implement Raschke's published pullback concept. This article uses the term only for the ADX-and-moving-average framework described below.
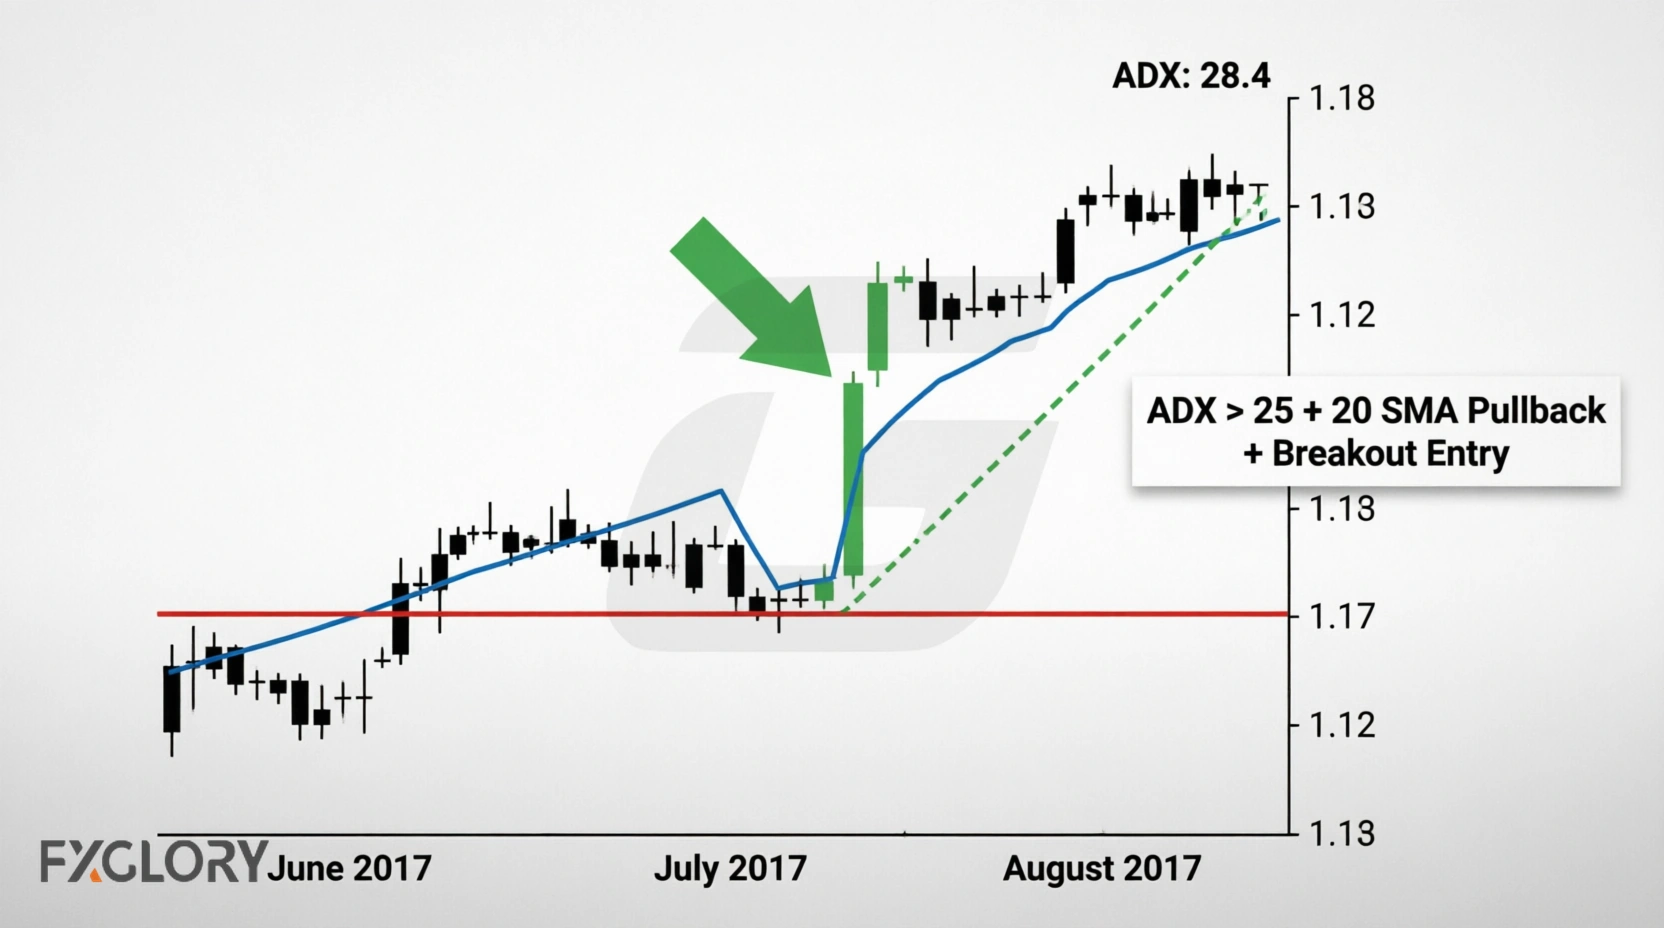
The actual Holy Grail setup is based on a logical premise: use the ADX (Average Directional Index) to confirm that a strong trend exists, and use the 20 SMA as a dynamic value area to enter on pullbacks.
A simplified description of the original concept is:
- Wait for the ADX to rise above 30 (indicating a strong, established trend).
- Wait for the price to pull back and touch the 20 SMA.
- Enter in the direction of the trend when price breaks the high/low of the signal bar.
The performance of any such rule set can change across markets, periods, execution assumptions, and implementation details. The backtest below therefore evaluates one explicit forex adaptation rather than assuming that historical results from other asset classes transfer directly to currency markets.
Linda Raschke's Original Holy Grail Rules (1994)
To understand why the strategy fails in modern forex, we must look at Linda Bradford Raschke's original rules, published in her 1994 book Street Smarts. Raschke did not design this for retail forex traders; she designed it for professional commodity and treasury bond traders.
Her exact original parameters were:
- Trend Filter: ADX(14) strictly > 30.
- Pullback Reference: 20-period Exponential Moving Average (EMA), not the SMA commonly used by retail traders today.
- Entry Trigger: A resting limit order placed exactly at the 20 EMA, rather than a breakout order.
- Market Context: The setup was designed for macro-driven, highly directional markets like the S&P 500 and T-Bonds in the 1980s and early 90s, where trends lasted for months without deep retracements.
Why the distinction matters: the original EMA-based, discretionary setup and the modified SMA-based programmatic test are not identical. Differences in entry type, moving-average definition, stop management, and market selection mean that results from the backtest below should be attributed to the tested implementation rather than automatically to the original setup.
The Mechanical Rules We Backtested
To ensure our backtest was fair and programmatic, we adapted Raschke's logic into a standardized, volatility-adjusted mechanical framework suitable for modern forex:
- Trend Filter: ADX(14) must be > 25, and the +DI/-DI must confirm the trend direction.
- Pullback Zone: Price must touch or cross the 20 SMA within the last 5 daily bars.
- Entry Trigger: Enter on the break of the previous daily candle's high (for longs) or low (for shorts).
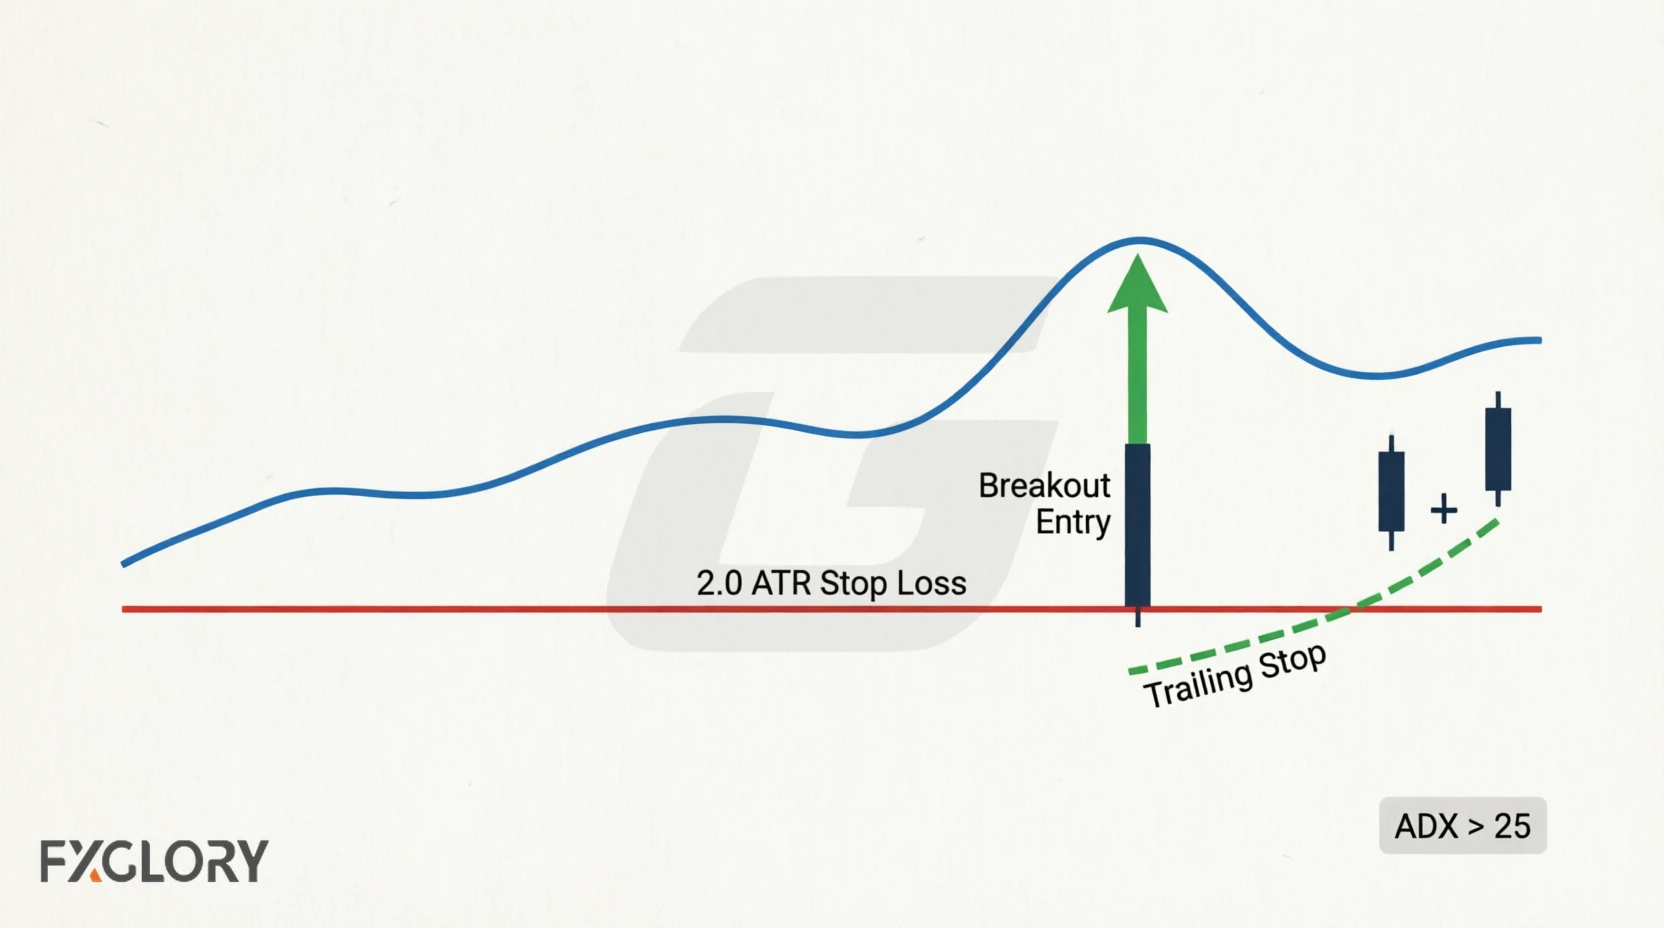
- Initial Stop Loss: 2.0 ATR (Average True Range) from entry, adapting to current market volatility.
- Trailing Stop: Once the trade reaches +1.0R profit, the stop moves to breakeven. It then trails by 1.5 ATR behind the highest high/lowest low.
- Structural Exit: If the daily candle closes beyond the 20 SMA, the trend structure is broken, and the trade is closed immediately.
Discretionary Signal Bars vs. Programmatic Proxies
In her original writings and popularized by sites like Trading Setups Review, Raschke did not blindly buy any breakout. She looked for a specific Signal Bar—often an inside bar or a distinct reversal candlestick pattern—forming exactly at the 20 EMA before entering. Our V3 programmatic backtest used a standardized proxy: entering on the break of the previous daily candle's high or low. While our proxy captures the mechanical essence of a breakout, it lacks the discretionary nuance of filtering out 'ugly' signal bars. This highlights the fundamental gap between manual price-action trading and rigid algorithmic backtesting.
Daily Charts, Timeframes, and Position Sizing
The reported test uses daily data only. Shorter timeframes can have different noise, spread, and execution characteristics, but this dataset does not establish whether H4, H1, or intraday versions would perform better or worse. The results therefore support conclusions about the tested daily implementation, not every possible timeframe.
Trade Frequency and Losing Streaks
The daily test recorded a 20.3% win rate and a worst losing streak of 28 trades. That sequence illustrates why losing-streak tolerance and position sizing matter when evaluating a strategy, but it does not by itself establish how every trader would respond psychologically.
Price Action and Indicator Rules
A candlestick pattern at a moving average is a different entry model from the one tested here. Any price-action variation would need its own entry, invalidation, and cost assumptions before its performance could be compared with this ADX-based rule set.
Position Sizing on Wider Stops
Daily-chart stops can be wider in price terms than intraday stops, depending on the pair and volatility regime. The stop level and resulting stop distance should be determined first; position size can then be calculated from the account risk limit. Minimum trade size, spread, commission, and margin constraints can make some risk targets impractical on smaller accounts, but they do not mathematically guarantee negative expectancy by themselves.
Interpreting Why This Tested Model Underperformed
The 6,518-trade test produced -0.218R expectancy. Several features of the rule set may help explain that result, but the backtest did not run isolated component tests for each one. The points below should therefore be read as plausible interpretations rather than proven causal findings.
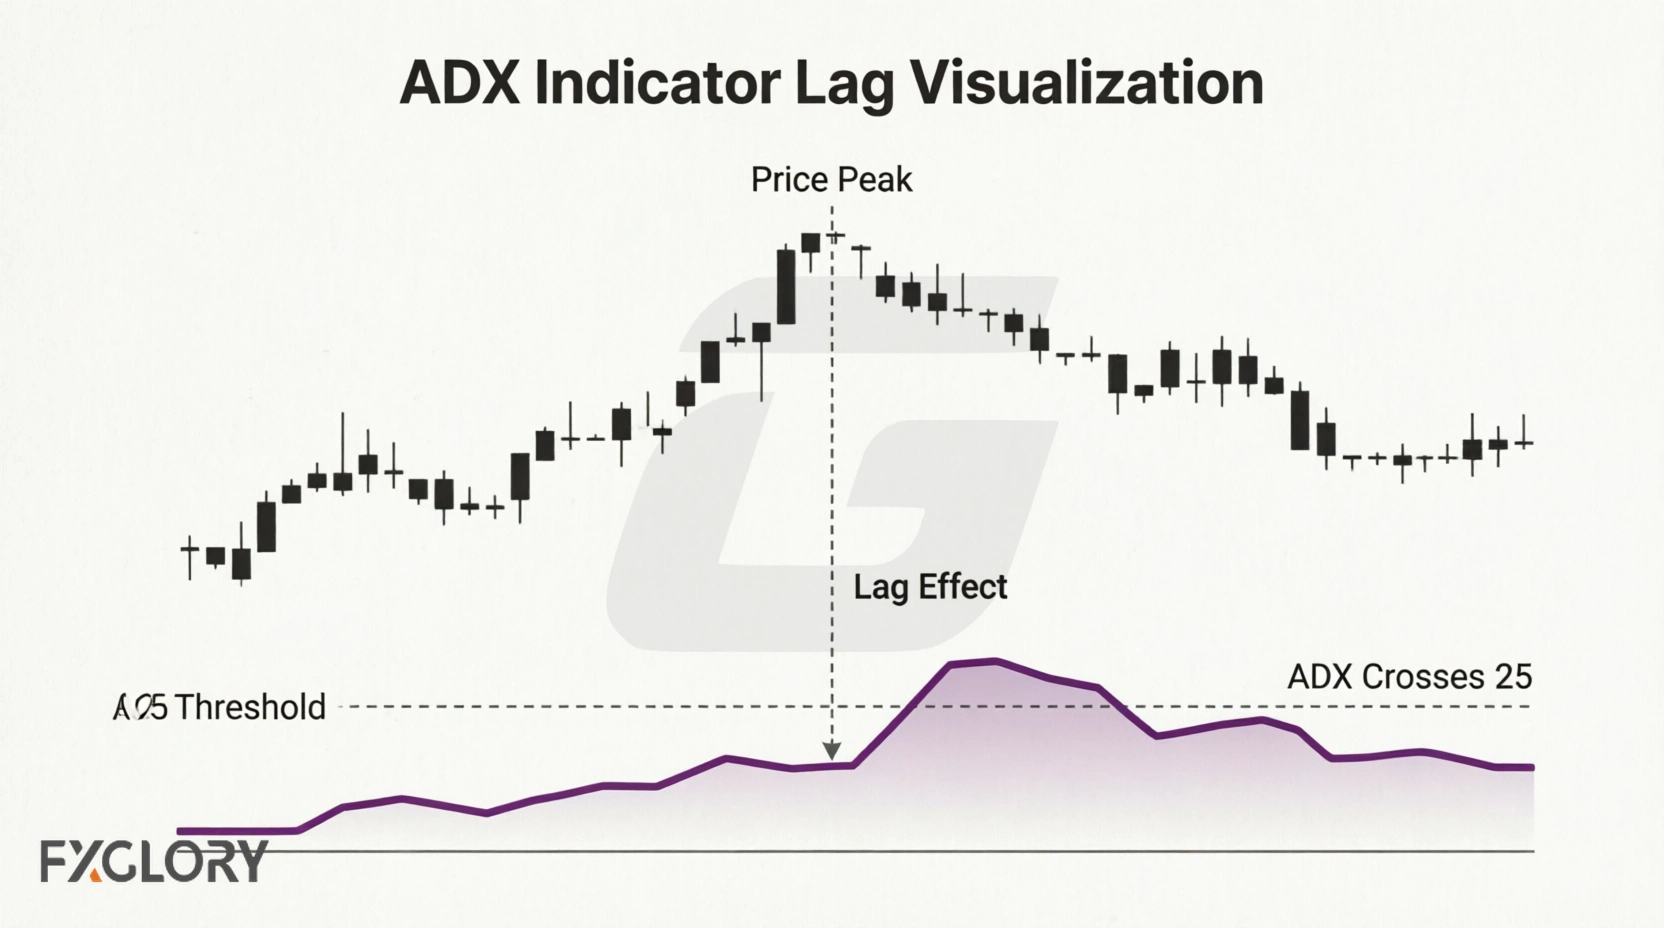
1. ADX Confirmation Can Arrive After a Move Has Started
ADX measures trend strength rather than direction and uses smoothed historical price information. A threshold such as 25 or 30 can therefore be reached after part of a directional move has already occurred. Whether that delay materially harms expectancy depends on the entry rule and market context.
2. The 20 SMA Exit May Shorten Trades
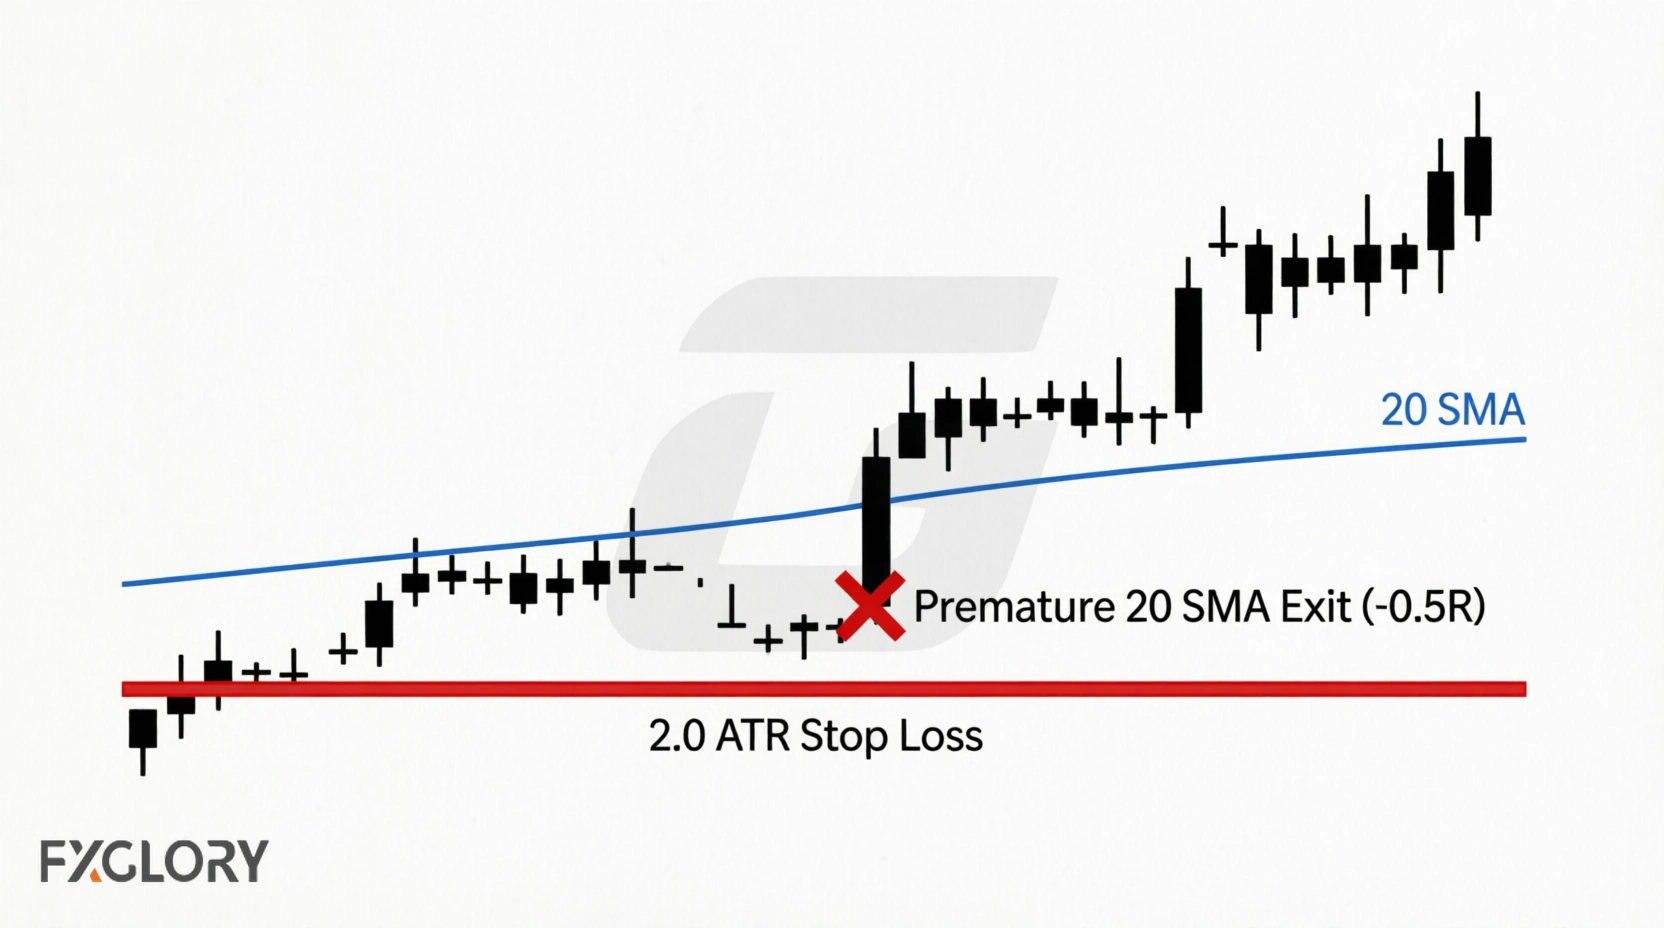
The model uses the 20 SMA both as a pullback reference and as one exit condition. The average loss was -0.50R despite a 2 ATR initial stop, which is consistent with many trades being closed before the full initial risk was realized. However, that statistic alone does not prove that the SMA exit specifically removed otherwise profitable trades.
3. The Observed Win/Loss Distribution Was Unfavorable
The test recorded an average win of +0.87R, an average loss of -0.50R, and a 20.3% win rate. Together those observed values produced negative expectancy. The exact breakeven win rate depends on the realized average win and loss, trading costs, and implementation.
4. The Programmatic Trade Management Differs from a Discretionary Version
The tested model uses explicit ATR and moving-average exit rules so that trades can be reproduced mechanically. A discretionary trader could manage stalled or weak trades differently. Because that discretionary process is not represented in the test, the results should not be used to infer how a manually managed version would have performed.
The Parameter Trap: Does Tweaking Settings Fix the Edge?
A common question in trading forums is whether the strategy can be 'fixed' by tweaking the parameters. Traders often ask: 'What if I use ADX 20 instead of 25?' or 'What if I use the 10 SMA instead of 20?'
The development notes include three variations of the logic:
- V1 (Strict): ADX > 30, rising, and price within 15 pips of SMA. Result: 0% win rate (too few trades, over-filtered).
- V2 (Loose): ADX > 25, exit on ADX < 20. Result: -0.22R expectancy (stopped out by lagging exit).
- V3 (Professional): ADX > 25, ATR trailing stops, exit on SMA break. Result: -0.218R expectancy.
These variations did not produce a positive expectancy in the supplied development notes. That is evidence about the tested variants, not proof that every possible parameter set must fail. Additional optimization also creates overfitting risk, so any revised rules would need out-of-sample validation.
Common Strategy Modifications
Traders often modify moving-average periods, ADX thresholds, entry triggers, and stop rules when adapting trend-following systems. Those changes create different strategies and should be evaluated with their own test data rather than assumed to improve the original model.
Parameter Optimization and Overfitting
Changing the moving-average period or ADX threshold can improve an in-sample result while increasing the risk of curve fitting. Any optimized version should therefore be evaluated on data that was not used to select the parameters. The forex risk management strategy also provides context for sizing and drawdown control while testing revised models.
Market Context
ADX can remain elevated during volatile price movement even when the broader chart is not a clean one-direction trend. This is one reason a trend-strength threshold may need additional structural context rather than being treated as a complete entry signal by itself.
Using ADX as a Filter Instead of a Trigger
One alternative design is to use ADX only as a trend-strength filter while a separate price-based rule supplies the entry trigger. That is a materially different strategy and requires separate testing; the negative result of the model on this page does not establish whether such a variation would succeed.
Comparison With ADX + Moving Average Crossovers
A separate ADX + moving-average crossover model provides a useful comparison because it combines the same trend-strength concept with a different entry trigger.
The separate ADX + Moving Average strategy reports a baseline expectancy of -0.33R and a profit factor of 0.51 under its own rules. That comparison shows another negative historical result, but it does not establish a universal rule about all combinations of lagging indicators.
Portfolio Context and Negative Expectancy
Portfolio diversification can reduce dependence on a single market or strategy, but diversification does not automatically turn a negative-expectancy component into a positive one.
The Mathematics of Negative Expectancy
In this historical test, the model had -0.218R expectancy. Whether including such a component in a portfolio is appropriate depends on its true future expectancy, correlation with other components, sizing, costs, and portfolio objective; the backtest alone cannot determine those future values.
A strategy with persistently negative true expectancy would reduce expected portfolio return if all else were equal. Historical expectancy, however, is only an estimate, so portfolio decisions should also consider uncertainty, correlation, costs, and out-of-sample evidence.
Diversifying Strategy Types
One way to reduce reliance on a single market regime is to evaluate strategies with different return drivers:
- Trend following: Seeks to participate in sustained directional moves.
- Mean reversion: Looks for movement back toward a reference value after an extreme; see the RSI strategy for one example framework.
- Volatility breakouts: Looks for expansion after a defined compression or range condition.
ADX can be tested as a filter, an input to an entry rule, or part of another trend-following model. The appropriate role depends on the complete rule set and its validation.
Case Studies: Anatomy of a Win vs. a Loss
To understand exactly how the V3 backtest logic plays out in real market conditions, let's examine the text-based anatomy of a winning setup and a losing setup from our 6,518-trade log.
The Winning Setup (The 20%): EURUSD Daily
The Context: EURUSD has been in a strong macro uptrend for three weeks. The ADX is at 35, and the +DI is firmly above the -DI.
The Pullback: Price corrects for four days, finally touching the 20 SMA on Tuesday. The ADX remains above 25, confirming the underlying trend strength hasn't broken.
The Entry: Wednesday prints a bullish reversal candle. Thursday breaks the high of Wednesday's candle. The system enters Long. The initial stop is placed 2.0 ATR below entry.
The Exit: The trend resumes. After 6 days, the example trade is up +1.5R. The trailing stop moves to breakeven, then trails 1.5 ATR behind the daily lows. The trade eventually hits the trailing stop 8 days later, locking in a +1.2R example profit. This illustrates one path by which the tested rules can capture a continuation.
The Losing Setup (The 80%): USDJPY Daily
The Context: USDJPY spikes higher on a news event. The ADX rapidly crosses above 25 due to the violent impulse.
The Pullback: Price drifts sideways for three days, barely tapping the 20 SMA. The ADX is still > 25, but the momentum is clearly stalling.
The Entry: A minor bullish candle forms. The next day breaks its high. The system enters Long.
The Exit: The next day, price moves lower and the daily candle closes 2 pips below the 20 SMA. Under the example rules, that close triggers the structural exit at -0.5R. Price then resumes upward the following week, illustrating how this exit condition can sometimes close a trade before a later continuation.
Structural and Indicator-Based Filters
No single indicator result establishes a universal trading edge. The tests in this article and the related strategy pages instead show how materially results can change when the entry, exit, filter, market, and cost assumptions change.
A separate Alligator strategy test reports +0.575R expectancy and a 2.09 profit factor for USDCHF under a different rule set. Because the rules differ materially, that result is a comparison point rather than evidence that one indicator or strategy is inherently superior.
One important difference between the two tested models is the entry trigger:
- The modified Holy Grail model uses ADX and directional indicators as filters, then a previous-bar breakout after a 20 SMA pullback as the entry condition.
- The separate Alligator model uses a fractal breakout with Alligator and Awesome Oscillator filters.
The comparison reinforces the need to test complete rule sets rather than attributing results to a single indicator. Volatility-based methods such as the ATR and ADX strategy provide another framework that can be evaluated separately.
Backtesting the Holy Grail Strategy
Backtesting manually is prone to hindsight bias. Traders subconsciously ignore the setups that failed and remember the ones that worked. To measure the Holy Grail accurately, the rules must be strictly programmatic.
Educational Backtest: Holy Grail Across Six Pairs (2014–2024)
The following results were generated from yfinance public research data using the mechanical rules described above. The data source was public research data, not FXGlory broker execution data.
Combined Metrics — All Pairs, All Sensitivity Runs
| Metric | Holy Grail ADX + 20 SMA |
|---|---|
| Trades (all sensitivity runs) | 6,518 |
| Win rate | 20.33% |
| Average win | +0.87R |
| Average loss | -0.50R |
| Expectancy | -0.218R |
| Profit factor | 0.45 |
| Max drawdown | -1,421.56R |
| Worst losing streak | 28 trades |
| Avg holding period | 5.19 days |
Pair-Level Comparison
| Pair | Trades | Win Rate | Expectancy | Profit Factor |
|---|---|---|---|---|
| EURUSD | 1,188 | 19.02% | -0.213R | 0.41 |
| GBPUSD | 945 | 20.21% | -0.208R | 0.47 |
| USDJPY | 1,197 | 22.31% | -0.284R | 0.38 |
| AUDUSD | 1,125 | 21.87% | -0.135R | 0.63 |
| USDCAD | 1,080 | 20.00% | -0.163R | 0.55 |
| USDCHF | 983 | 18.21% | -0.309R | 0.28 |
Three findings from the historical test stand out:
1. All six tested pairs had negative expectancy. AUDUSD was the least negative at -0.135R, while USDCHF was the most negative at -0.309R. That conclusion applies to these six pairs under this specific historical model and does not establish performance for other markets or rule variations.
2. Many losses ended before the full initial stop distance. The average loss was -0.50R despite a 2 ATR initial stop. That is consistent with the model's breakeven, trailing-stop, and 20 SMA exit rules closing trades before a full 1R loss, but the aggregate metric does not isolate which exit condition was responsible.
3. The reported drawdown is extremely large in risk-unit terms. The combined maximum drawdown was -1,421.56R and the worst losing streak was 28 trades. Translating that R-based drawdown into account equity requires a defined sizing and compounding model. The forex risk management strategy explains how position sizing changes account-level outcomes.