Current weekly forecast: This outlook covers 11–17 October 2026 and remains valid until 17 October 2026, unless its stated invalidation condition is triggered earlier.
In brief
The weekly bias is Bearish, supported by D1 structure and moving-average pressure, although bullish H4 momentum keeps recovery risk active around 0.80049.
The D1 timeframe controls the weekly assessment: the trend state is bearish, the close sequence is mixed, and the reference close at 0.79692 is below the EMA20 at 0.80152, EMA50 at 0.80697 and SMA200 at 0.80968. That alignment places the broader structure under pressure, while the mixed close sequence prevents the bearish case from being treated as one-directional.
H4 presents the main countertrend influence. Its bullish tactical state is accompanied by an H4 close of 0.80017, RSI at 59.64 and positive MACD histogram, placing short-term recovery pressure near the H4 resistance at 0.80054 and D1 resistance at 0.80049. A failure to sustain that recovery would leave the D1 structure in control; a completed D1 close above 0.80267 would materially change the formal weekly boundary.
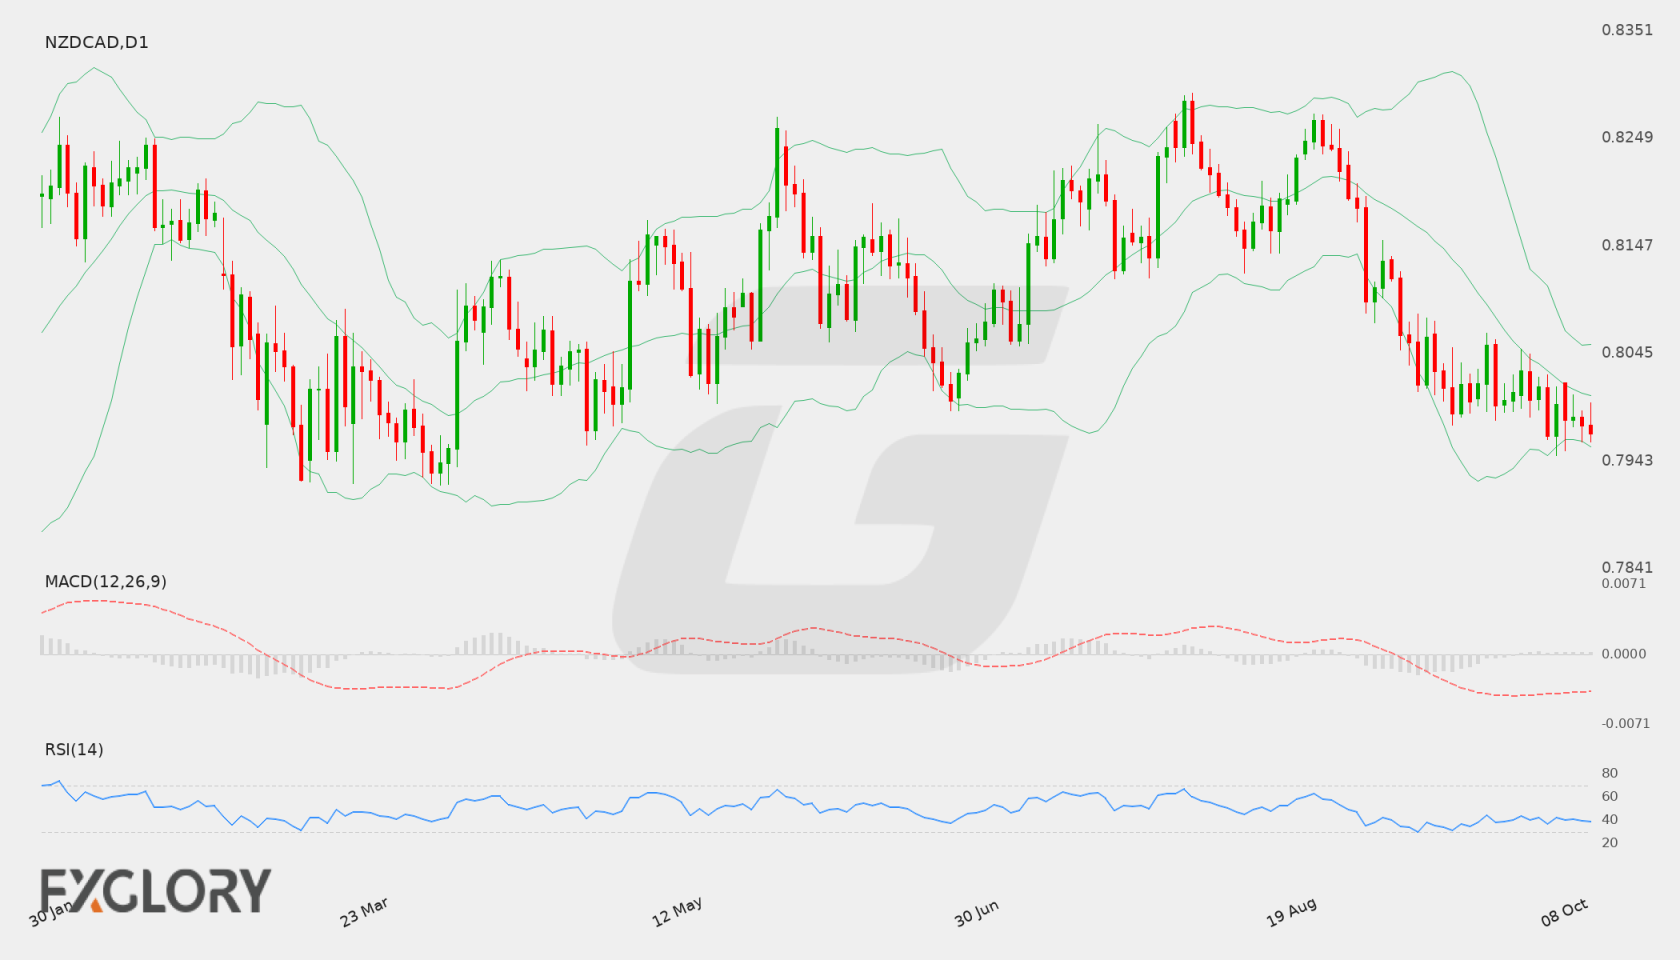
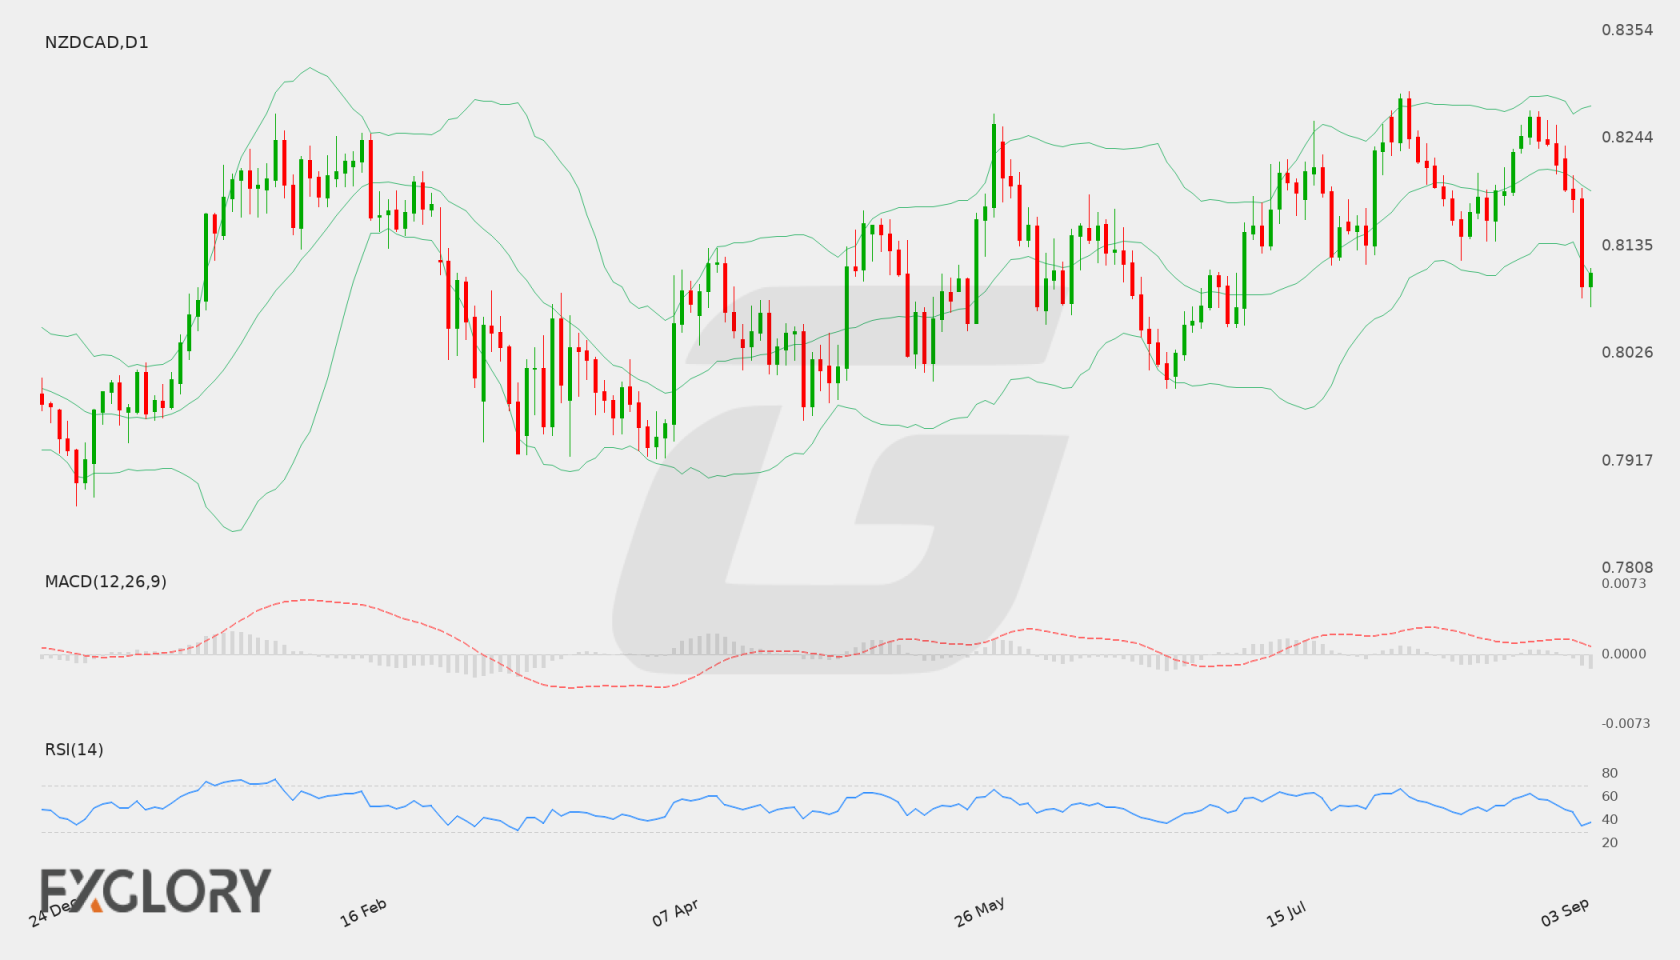
NZD/CAD D1 technical-analysis context for the weekly forecast. Chart data captured 11 October 2026.
The NZD/CAD currency pair faces key macroeconomic drivers this week centered around incoming economic data from Canada. Market participants are monitoring shifts in Canadian business activity alongside comprehensive employment metrics, which could influence the performance of the Canadian Dollar relative to the New Zealand Dollar.
Price Action:
On the Daily (D1) timeframe, NZD/CAD has experienced sustained downward pressure, closing the latest session at 0.79669 after reaching a daily low of 0.79629. The pair continues to trend lower after declining from levels above 0.82000 in recent weeks, showing strong seller presence near the lower boundary of its recent range.
Key Technical Indicators:
Bollinger Bands: The Bollinger Bands on the D1 chart show the middle band at 0.80285, the upper band at 0.81087, and the lower band at 0.79483. Trading at 0.79669, NZD/CAD is positioned well below the 20-period middle band and is gravitating toward the lower band, reflecting strong bearish pressure.
RSI: The 14-day Relative Strength Index (RSI) is currently reading 36.64, which indicates bearish momentum as the oscillator trends toward the oversold threshold without yet signaling an immediate exhaustion.
MACD: The Daily MACD indicator stands at -0.00390, remaining in negative territory and reflecting persistent downward momentum for the NZD/CAD pair.
Support and Resistance:
Key technical levels identified on the Daily chart place immediate support at 0.79629, while substantial resistance is located at 0.82919.
News to Watch for NZDCAD This Week:
Ivey PMI: Reflects Canadian purchasing managers activity and economic sentiment that can impact Canadian Dollar valuation.
Unemployment Rate: Provides insight into Canadian labor market conditions that may alter central bank policy expectations.
Employment Change: Measures net job creation in Canada and can trigger significant volatility across Canadian Dollar currency pairs.
Weekly Outlook and Consideration:
The weekly outlook for NZD/CAD (NZDCAD) points to an ongoing bearish structure on the Daily chart. Price action is pressing against the primary support level at 0.79629, with the last close at 0.79669 remaining beneath the Bollinger middle band of 0.80285. While momentum indicators such as the MACD (-0.00390) and RSI (36.64) show seller dominance, the proximity of the lower Bollinger band at 0.79483 suggests that downside extensions could encounter stabilization if support holds. Major overhead resistance stands at 0.82919, while upcoming Canadian economic data may introduce heightened volatility.
Disclaimer: The analysis provided for NZD/CAD is for informational purposes only and does not constitute investment advice. Traders are encouraged to perform their own analysis and research before making any trading decisions. Market conditions can change quickly, so staying informed with the latest data is essential.
The NZD/CAD pair continues to reflect shifting risk sentiment and economic performance between New Zealand and Canada. Market participants remain attentive to broader economic momentum and upcoming Canadian output data, which could influence short-term currency valuation and direction for NZD/CAD.
Price Action:
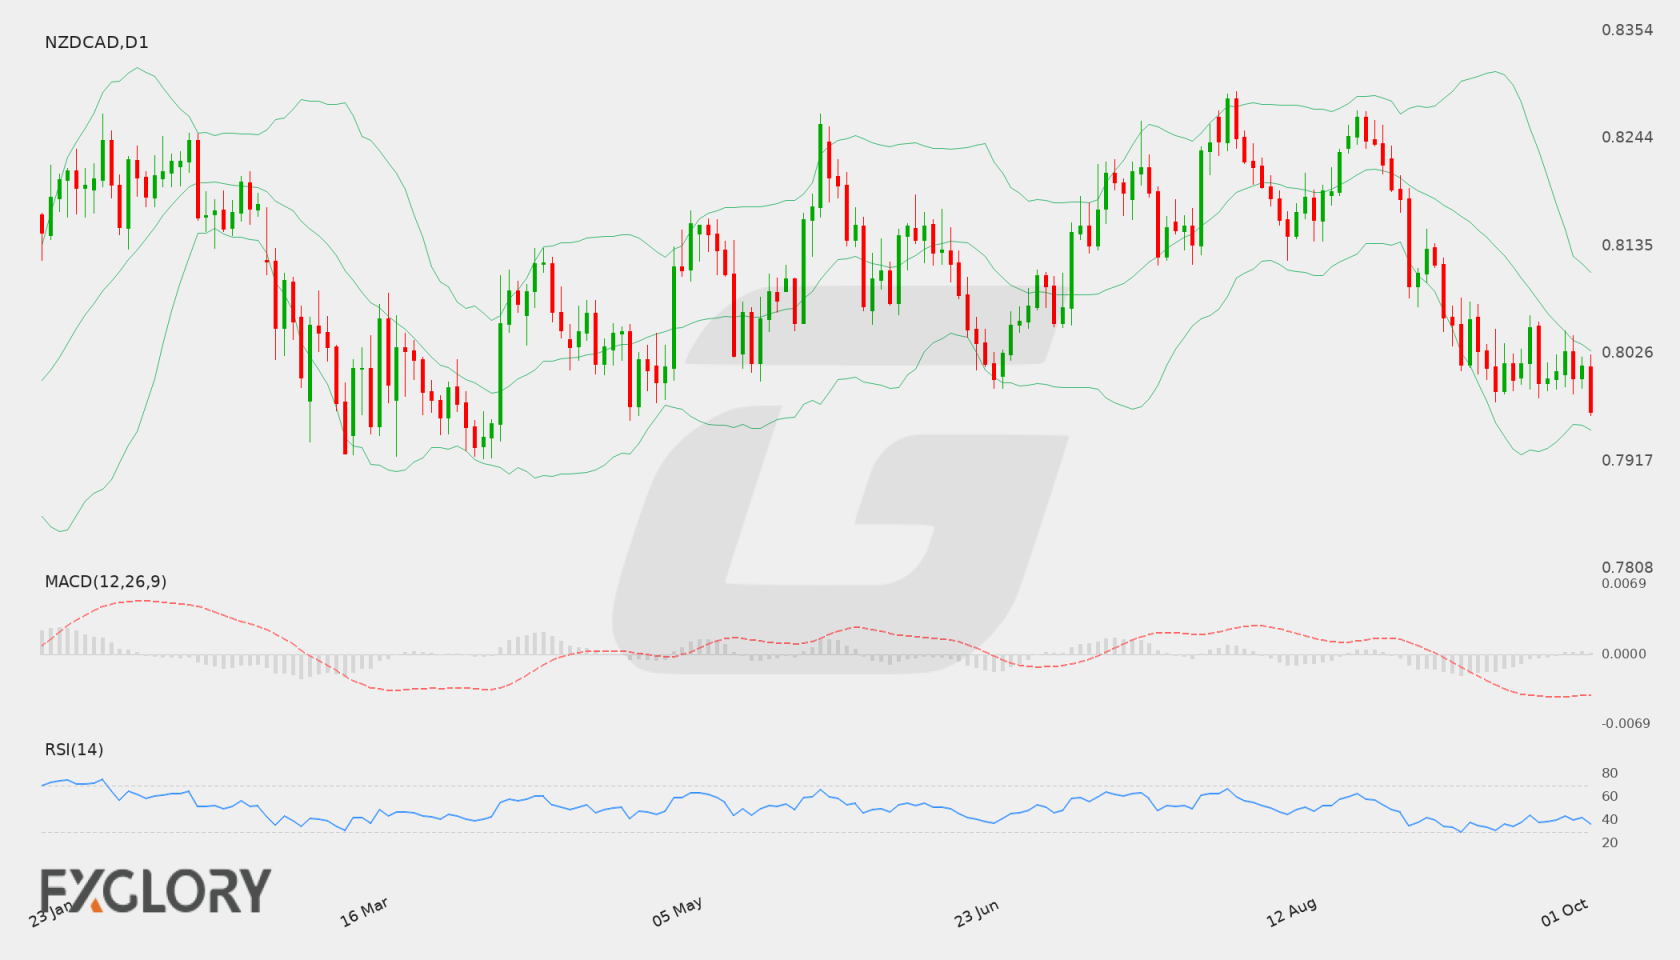
On the Daily (D1) timeframe, NZD/CAD has displayed a clear corrective trajectory after reaching recent peaks near 0.8266. The exchange rate recently closed at 0.80158, stabilizing slightly above key local lows after experiencing consecutive daily declines.
Key Technical Indicators:
Bollinger Bands: The Bollinger Bands on the D1 chart show the middle baseline sitting at 0.81254, with the upper band at 0.83088 and lower band at 0.79420. Trading below the middle band signals lingering bearish pressure as price action leans closer to the lower volatility boundary.
RSI: The 14-day Relative Strength Index (RSI) is positioned at 36.42. Holding below the neutral 50 level, the reading highlights persistent bearish sentiment while staying slightly above oversold conditions.
MACD: The MACD indicator registers at -0.00479, holding in negative territory. This negative value reflects sustained downward momentum and suggests that sellers currently maintain control over short-term price movements.
Support and Resistance:
Key technical levels for NZD/CAD include primary support at 0.79769 and major resistance at 0.82919.
News to Watch for NZDCAD This Week:
GDP m/m: This monthly release measures Canadian economic output and could spark volatility across Canadian Dollar currency pairs.
Weekly Outlook and Consideration:
The technical outlook for NZD/CAD remains titled to the downside based on Daily chart signals. With price trading under the middle Bollinger Band at 0.81254, negative MACD histogram momentum, and an RSI of 36.42, downside pressure persists. A breach below support at 0.79769 could extend lower tests toward the lower Bollinger Band at 0.79420. Alternatively, any bullish recovery would need to overcome resistance at 0.82919 to alter the current technical structure.
Disclaimer: The analysis provided for NZD/CAD is for informational purposes only and does not constitute investment advice. Traders are encouraged to perform their own analysis and research before making any trading decisions. Market conditions can change quickly, so staying informed with the latest data is essential.
The fundamental backdrop for NZD/CAD is influenced by shifting economic conditions in New Zealand and Canada. Foreign exchange traders are closely evaluating relative interest rate expectations, commodity price fluctuations, and key macroeconomic releases from both nations. Incoming Canadian inflation data alongside New Zealand growth figures are expected to drive market sentiment across the pair.
Price Action:
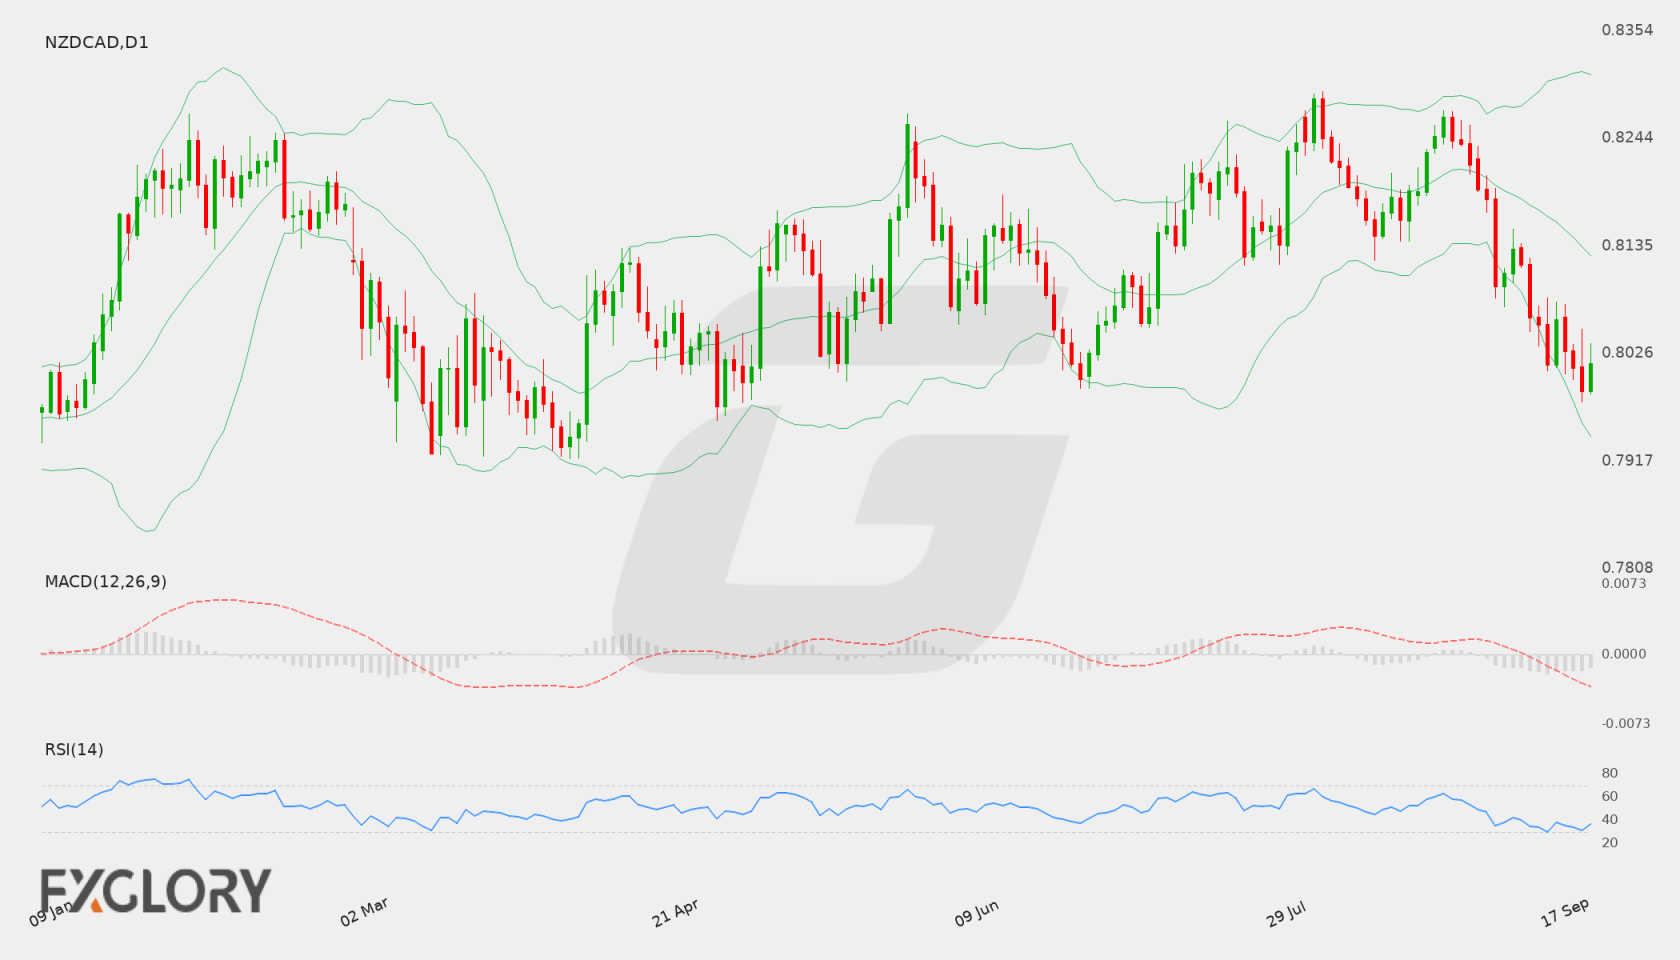
On the Daily (D1) timeframe, NZD/CAD has experienced sustained downward price action, dropping from recent highs above 0.8260 down to a last close of 0.80154. The series of lower daily closes illustrates established selling pressure, bringing the pair closer to major technical floors.
Key Technical Indicators:
Bollinger Bands: The daily Bollinger Bands exhibit a middle line at 0.81651, an upper band at 0.83028, and a lower band at 0.80274. NZD/CAD closed at 0.80154, trading below the lower Bollinger Band. This location outside the lower envelope underscores heightened downside volatility and strong selling momentum.
RSI: The 14-period Relative Strength Index (RSI) stands at 29.88, dipping into oversold territory below the 30 mark. While an oversold RSI confirms aggressive selling pressure, it also raises the possibility of potential short-term consolidation or corrective relief.
MACD: The MACD indicator registers a value of -0.00337, holding below the zero line. This negative reading signals that bearish momentum continues to dominate on the daily chart, reinforcing the current downtrend.
Support and Resistance:
Key technical support for NZD/CAD is located at 0.79904, serving as a critical level for buyers to defend. On the upside, primary technical resistance is positioned at 0.82919, which aligns near the upper Bollinger Band.
News to Watch for NZDCAD This Week:
Trimmed CPI y/y: This key inflation measure influences Canadian monetary policy expectations and currency volatility.
Median CPI y/y: Tracking median price changes provides deeper insight into underlying Canadian inflation trends.
Common CPI y/y: Broad core inflation data helps traders assess broader economic conditions in Canada.
GDP q/q: Quarterly economic growth figures offer vital guidance on the health of the New Zealand economy.
Weekly Outlook and Consideration:
NZD/CAD maintains a bearish daily outlook as price action rests at 0.80154, beneath the lower Bollinger Band of 0.80274. Negative MACD values at -0.00337 confirm prevailing downside momentum, though an RSI of 29.88 signals oversold conditions. A sustained break beneath key support at 0.79904 could extend the downtrend, whereas a rebound from current levels may push price back toward the 0.81651 middle Bollinger Band and resistance at 0.82919. Upcoming Canadian CPI releases and New Zealand GDP data will likely act as key catalysts.
Disclaimer: The analysis provided for NZD/CAD is for informational purposes only and does not constitute investment advice. Traders are encouraged to perform their own analysis and research before making any trading decisions. Market conditions can change quickly, so staying informed with the latest data is essential.
The NZD/CAD pair remains influenced by macroeconomic sentiment and commodity market trends. Traders monitor fiscal developments and broader market sentiment for clues on potential directional momentum without guaranteed outcomes.
Price Action:
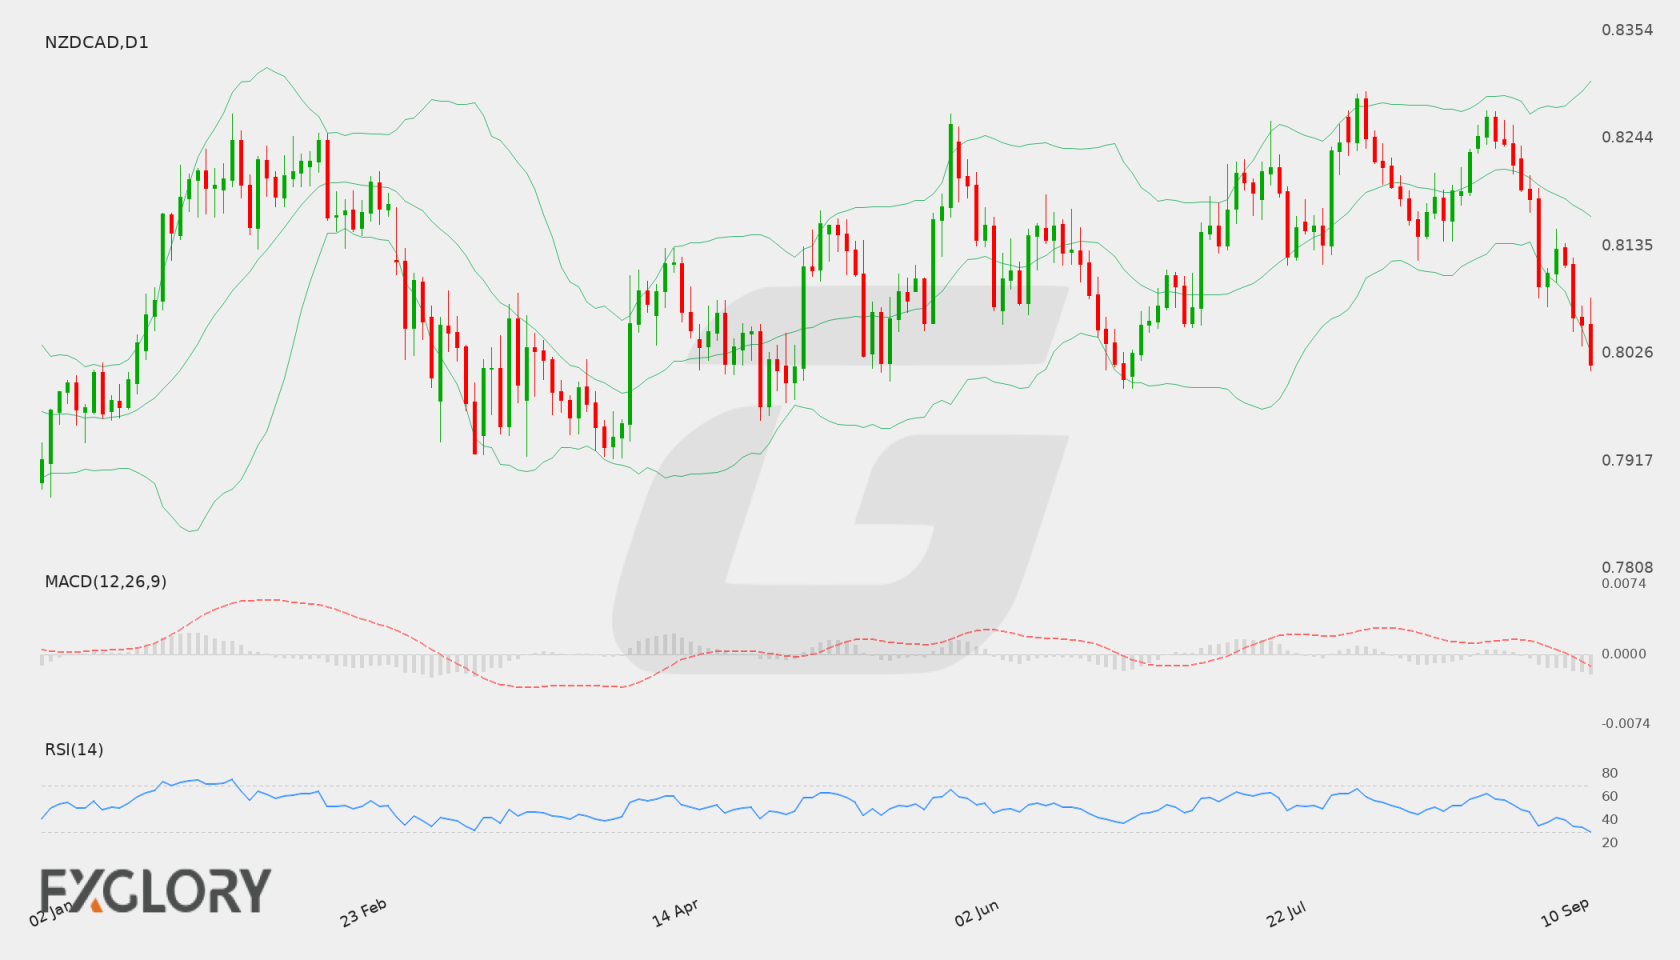
On the Daily (D1) timeframe, NZD/CAD recently retreated from highs around 0.82661, pushing lower toward the 0.80948 level before settling near the latest close of 0.81078. The overall structure reflects persistent selling interest across recent daily sessions.
Key Technical Indicators:
Bollinger Bands: The D1 Bollinger Bands show the middle band at 0.81911, upper band at 0.82773, and lower band at 0.81049. With the last close at 0.81078 hovering near the lower band, price action indicates elevated downside pressure within the current volatility channel.
RSI: The 14-period Relative Strength Index (RSI) on the daily timeframe reads 37.84, suggesting weak buyers momentum and approaching oversold territory without indicating an immediate trend reversal.
MACD: The MACD indicator on the D1 chart stands at -0.000622, holding below the signal line and zero line to reflect ongoing bearish momentum in the pair.
Support and Resistance:
Key daily technical levels for NZD/CAD include primary support at 0.79904 and immediate upper resistance at 0.82919.
News to Watch for NZDCAD This Week:
Annual Budget Release: Government fiscal plans and spending details can alter economic expectations and influence market dynamics.
Weekly Outlook and Consideration:
NZD/CAD enters the week under downward pressure, closing at 0.81078 near its lower D1 Bollinger Band of 0.81049. Negative MACD values (-0.000622) and an RSI of 37.84 highlight subdued momentum. If support near 0.79904 holds, price action could attempt a recovery back toward the middle Bollinger Band at 0.81911; otherwise, persistent selling could keep the pair pinned near multi-session lows.
Disclaimer: The analysis provided for NZD/CAD is for informational purposes only and does not constitute investment advice. Traders are encouraged to perform their own analysis and research before making any trading decisions. Market conditions can change quickly, so staying informed with the latest data is essential.