NZDCAD Forecast

NZD iconCAD icon
NZD/CAD

New Zealand Dollar vs Canadian Dollar

NZD/CAD Live Price

0.81386
-0.22%

NZD/CAD Forecast — 19 June 2024

Time Zone: GMT +3

Time Frame: 4 Hours (H4)

Fundamental Analysis:

The NZD/CAD news analysis today highlights the impact of various economic factors and central bank policies. The Reserve Bank of New Zealand (RBNZ) has recently adopted a more dovish stance due to concerns over economic growth, while the Bank of Canada (BoC) is focusing on inflation control, supported by recent positive economic data. These divergent approaches are key to understanding the NZD/CAD dynamics. The RBNZ’s dovish tone could weaken the NZD, whereas the BoC’s hawkish policies might strengthen the CAD.

Price Action:

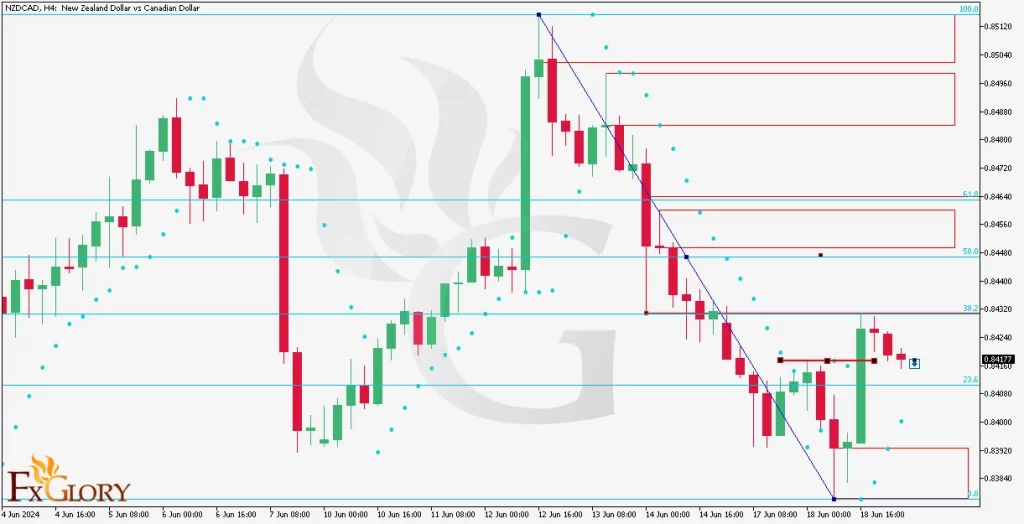
The NZD/CAD H4 chart reveals a market that was initially bearish but has shown signs of a bullish reversal after a Change of Character (CHOCH). The price action demonstrates a shift from lower lows to higher highs, confirming the trend reversal. The current price suggests a bullish trend with a target set above the previous order block. For further confirmation, we use the RSA Parabolic indicator, where the dots below the candles indicate a buy signal.

Key Technical Indicators:

RSA Parabolic: The dots below the candlesticks provide a clear buy signal, suggesting bullish momentum. This indicator is essential for confirming the trend reversal and potential upward movement.

Support and Resistance:

Support Levels:

Immediate support is at 0.8410, aligning with the recent lows. Additional support can be found at 0.8380.

Resistance Levels:

Immediate resistance is at 0.8450, followed by significant resistance at 0.8480 and 0.8500.

Conclusion and Consideration:

The NZD/CAD chart forecast is bullish, as indicated by the recent CHOCH and supporting technical indicators. Traders should consider going long, targeting the order block levels mentioned above. The NZDCAD forecast is strengthened by the bullish signals from the RSA Parabolic. Fundamental factors, such as the policies of RBNZ and BoC, will continue to influence the pair’s movements. Traders should use risk management strategies and be mindful of the volatile nature of the forex market. Staying updated with the latest NZD CAD analysis on TradingView and monitoring NZD CAD news analysis can provide further insights.

Disclaimer: The provided analysis is for informational purposes only and does not constitute investment advice. Traders should conduct their own research and analysis before making any trading decisions.

a picture of analysis NZDCAD pair for 6.19.2024

NZD/CAD Forecast — 28 February 2024

Time Zone: GMT +2

Time Frame: 4 Hours (H4)

Fundamental Analysis:

The NZD/CAD currency pair reflects the exchange rate between the New Zealand Dollar and the Canadian Dollar, two commodity-dependent economies. The NZD is often influenced by dairy prices and New Zealand’s economic indicators, while the CAD is closely tied to oil prices and economic developments in Canada. Trade relationships with global partners, especially China and the United States, can significantly impact these currencies. Additionally, monetary policy announcements from the Reserve Bank of New Zealand and the Bank of Canada, as well as changes in global risk sentiment, are important to monitor for their potential influence on the NZD/CAD exchange rate.

Price Action:

The H4 chart for NZDCAD displays a zigzag pattern, indicating a period of consolidation with clear swings between support and resistance levels. The price appears to be within a downtrend channel but recently showing signs of recovery, with the latest candles suggesting a potential reversal or pullback.

Key Technical Indicators:

MACD: The MACD line is close to the signal line, with the histogram showing minimal bars, indicating a lack of strong momentum in either direction. This could suggest a market in balance or indecision among traders.

RSI (Relative Strength Index): The RSI indicator is around the midpoint of 50, which does not indicate an overbought or oversold market. This suggests a neutral momentum currently in the market.

Ichimoku: The price is navigating around the Ichimoku cloud, which could be indicative of a potential trend change if the price breaks through the cloud.

Support and Resistance:

Support: The current support level can be identified by the lower boundary of the recent price channel and the consolidation area.

Resistance: Resistance is likely at the upper boundary of the price channel and the previous high points within the consolidation range.

Conclusion and Consideration:

The H4 chart for NZDCAD shows a market experiencing consolidation, with potential for a breakout in either direction. While recent price action suggests a slight bullish recovery, the key technical indicators do not present a clear direction, indicating a wait-and-see approach may be prudent. Traders should keep abreast of economic indicators from both New Zealand and Canada, as well as global commodity prices, to anticipate potential shifts in the currency pair’s movement.

Disclaimer: This analysis is intended for informational purposes only and should not be taken as investment advice. Trading decisions should be based on individual risk tolerance, market knowledge, and thorough analysis.

1NZD = –––CAD –––%
NZDCAD
Loading chart...