
The daily trend and momentum lean lower, but the close above primary support keeps the weekly thesis conditional on a completed daily break.
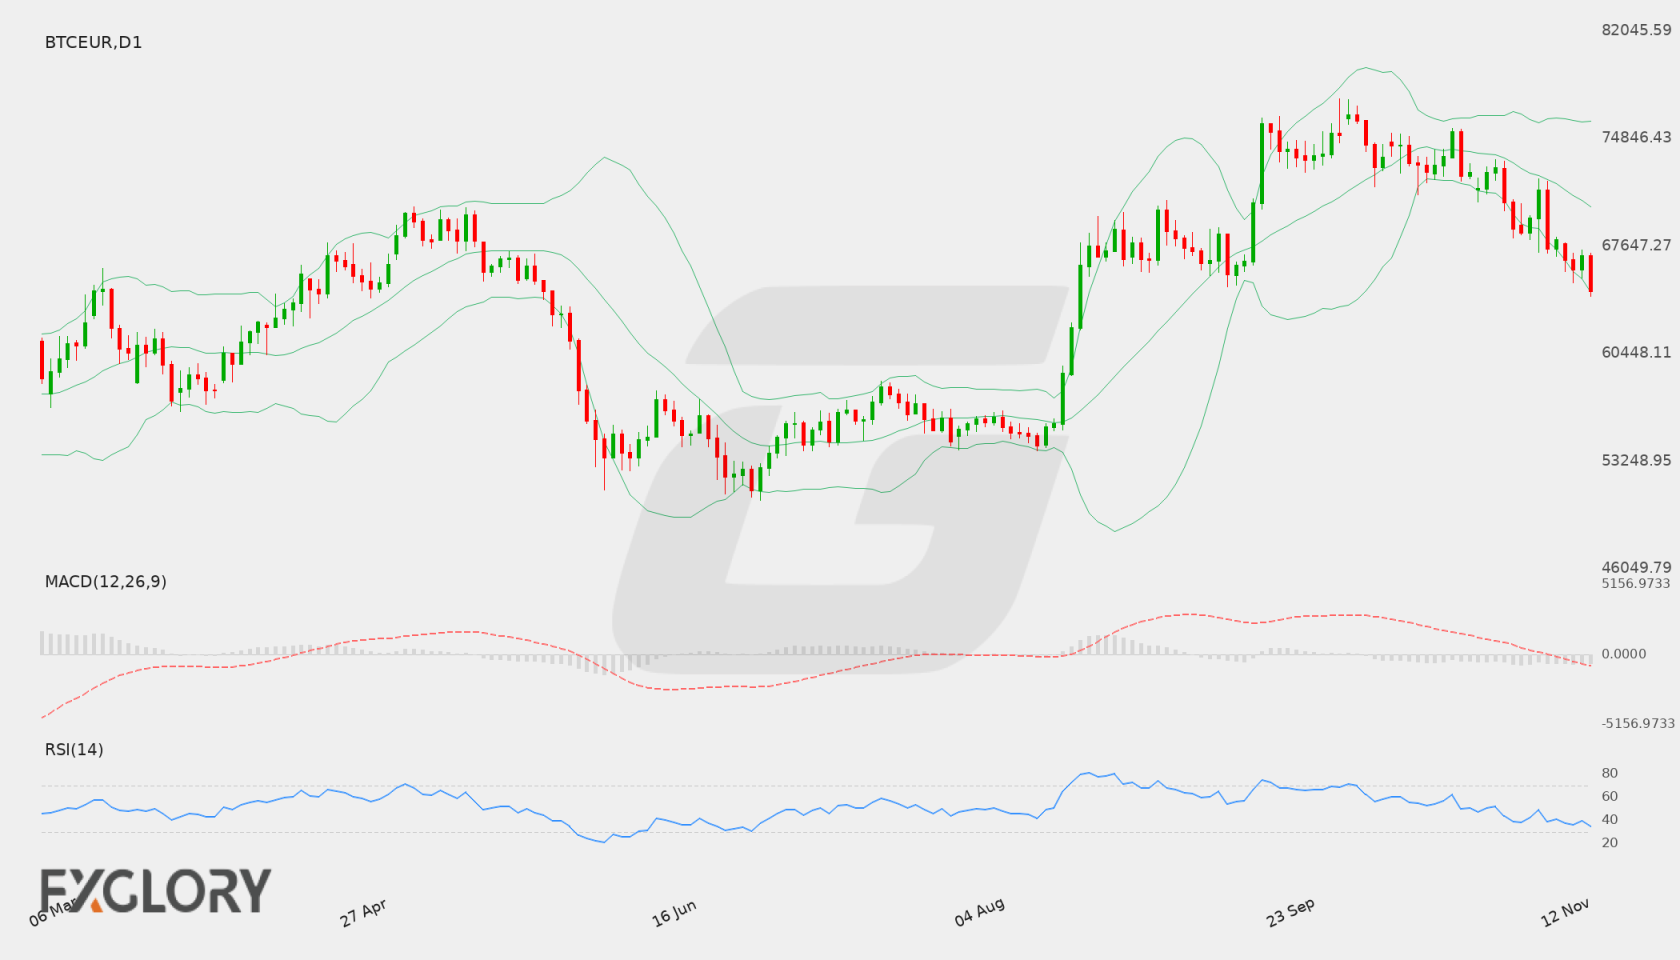
BTC/EUR Weekly Forecast at a Glance
In brief
Bearish bias for 14–21 November 2026: D1 trend, negative momentum and H4 all point lower, but the D1 close sits above the 61111.93 primary support, so the weekly thesis depends on a completed daily close below that level.
The controlling D1 picture leans bearish. The reference close of 62472.35 sits below the D1 EMA20, EMA50, SMA200 and Bollinger middle band, and momentum agrees, with RSI at 30.3 below 50 and MACD below its signal line with a negative histogram. The close sequence is mixed rather than a clean run of lower closes, so the bearish state rests more on the averages and momentum than on a continuous structure of lower highs and lower closes.
H4 supports the tactical direction without replacing the weekly view. The H4 close sits above H4 support at 61111.93 and below H4 resistance at 63391.92, with the H4 RSI below 50 and MACD below its signal line. The most important weekly question is whether D1 closes break below 61111.93 or recover toward 67092.26, while the ECB speaking schedule on 18–20 November adds volatility risk around those levels.
- Bullish targets
-
- T168520.81
- T269869.77
- Bearish targets
-
- T155943.22
- T254623.83
- Invalidation
- One completed D1 close above 68325.34466.
Selected key events
- ECB Financial Stability Review18 Nov 2026 12:00 GMT+3Medium
- ECB President Lagarde Speaks18 Nov 2026 17:25 GMT+3Medium
- ECB President Lagarde Speaks19 Nov 2026 16:30 GMT+3Medium
| Price at last update | 62029.23000 as of 14 Nov 2026 02:50 GMT+3 |
|---|---|
| Completed D1 reference close | 62472.35000 as of 13 November 2026 |
| Primary support | 61111.93000 |
| Secondary support | 55943.22000 |
| Primary resistance | 67092.26000 |
| Bullish targets | 68520.81, 69869.77 |
| Bearish targets | 55943.22, 54623.83 |
| Formal weekly thesis invalidation | Upper 68325.34466 — One completed D1 close above 68325.34466 formally invalidates the bearish weekly thesis. |
Live BTC/EUR Tools
A forecast is a snapshot. These pages keep moving with the market.
- Live
Live chart & price
Watch BTC/EUR move tick by tick. Flip from the 1-minute chart to the monthly, with trading conditions right alongside.
- Live
Technical signals
Buy, sell or sit it out? Oscillators, moving averages and pivot points boiled down to one clear reading, updated live.
Economic calendar
Know what's coming before it hits the price: every scheduled release with impact, forecast and actual.
Historical data
Open, high, low and close on any timeframe from 1 minute to monthly. Test your idea, then download the data.
All BTC/EUR forecasts
Every weekly outlook in one place. Scroll back to see how earlier calls played out against the chart.
BTC/EUR Fundamental Drivers This Week
Scheduled economic events relevant to BTC/EUR during 14–21 November 2026 include ECB Financial Stability Review, ECB President Lagarde Speaks, ECB President Lagarde Speaks. Directional impact depends on the released data relative to supplied expectations.
Scroll table sideways for more columns →
| Event | Scheduled | Importance |
|---|---|---|
| ECB Financial Stability Review | 18 Nov 2026 12:00 GMT+3 | Medium |
| ECB President Lagarde Speaks | 18 Nov 2026 17:25 GMT+3 | Medium |
| ECB President Lagarde Speaks | 19 Nov 2026 16:30 GMT+3 | Medium |
| ECB President Lagarde Speaks | 20 Nov 2026 11:15 GMT+3 | Medium |
Current BTC/EUR Price and Weekly Market Context
The D1 chart is the controlling frame for this week. The reference close of 62472.35 sits below the D1 EMA20 at 68693.46635, EMA50 at 69072.17179 and SMA200 at 62805.9287, and below the Bollinger middle band, which leaves price on the weaker side of the averages. Momentum agrees, with RSI at 30.3 below 50 and MACD below its signal line with a negative histogram. The H4 tactical state is bearish, but H4 sits inside a range between its own support and resistance, so the short-term picture confirms the direction without yet forcing a weekly break.
- D1 trendbearishClose vs 50 EMA and 200 SMA
- H4 tacticalbearishH4 close vs 20 and 50 EMA
- MomentumnegativeRSI and MACD histogram
- VolatilitystableD1 ATR change
Is BTC/EUR Bullish or Bearish This Week?
The primary scenario is bearish, favored by the D1 trend, the D1 momentum and the H4 tactical state. The base scenario is a two-sided consolidation between the primary support and primary resistance, which becomes more relevant while the D1 close sequence stays mixed. The bullish scenario requires a daily recovery above primary resistance that the current structure has not yet produced.
Scenario 1 of 3Bullish reversal
- D1 confirmation
- A completed D1 close above 67092.26, the primary resistance, would be required before the bullish case could be treated as structurally established. A close that remains inside the range would not qualify.
- H4 tactical signal
- A completed H4 close above 63391.92, the H4 resistance, would show short-term acceptance above a level that currently caps the tactical picture, and it would test whether that acceptance can carry into D1.
- Targets
- 68520.81, 69869.77
- Scenario failure condition
- A failure to hold a completed D1 close above 67092.26 after any test, or a rejection back below 63391.92 on H4 without follow-through, would weaken the recovery case and leave the bearish framework in control.
Scenario 2 of 3Base / neutral
- D1 confirmation
- D1 closes that remain between 61111.93 and 67092.26, with no completed daily close beyond either level, would confirm the range-bound development of this scenario.
- H4 tactical signal
- H4 closes alternating between 61111.93 and 63391.92 without a completed H4 break outside that band would support the consolidation picture on the tactical timeframe.
- Targets
- Consolidation between primary support at 61111.93 and primary resistance at 67092.26, with the secondary levels at 55943.22 and 68520.81 framing the wider reference structure.
- Scenario failure condition
- A completed D1 close above 67092.26 or below 61111.93 would break the range and move the weekly picture toward the bullish or bearish scenario respectively.
Scenario 3 of 3Bearish continuation
- D1 confirmation
- A completed D1 close below 61111.93, the primary support, would be the structural break that gives the bearish scenario its weekly relevance. A close above it would not qualify.
- H4 tactical signal
- A completed H4 close below 61111.93, the H4 support, would show that the tactical picture has also moved beneath the level that currently holds price, giving the bearish scenario its short-term confirmation.
- Targets
- 55943.22, 54623.83
- Scenario failure condition
- A completed D1 close back above 61111.93 after a breakdown attempt would weaken the bearish case, and a completed H4 close above 63391.92 would show that the tactical downside has stalled.
BTC/EUR D1 Outlook and H4 Technical Triggers
The daily timeframe controls the weekly thesis. H4 evidence is used only for earlier confirmation, tactical warning and scenario-failure context. Complete live H4, H1 and intraday readings remain on the Technical page.
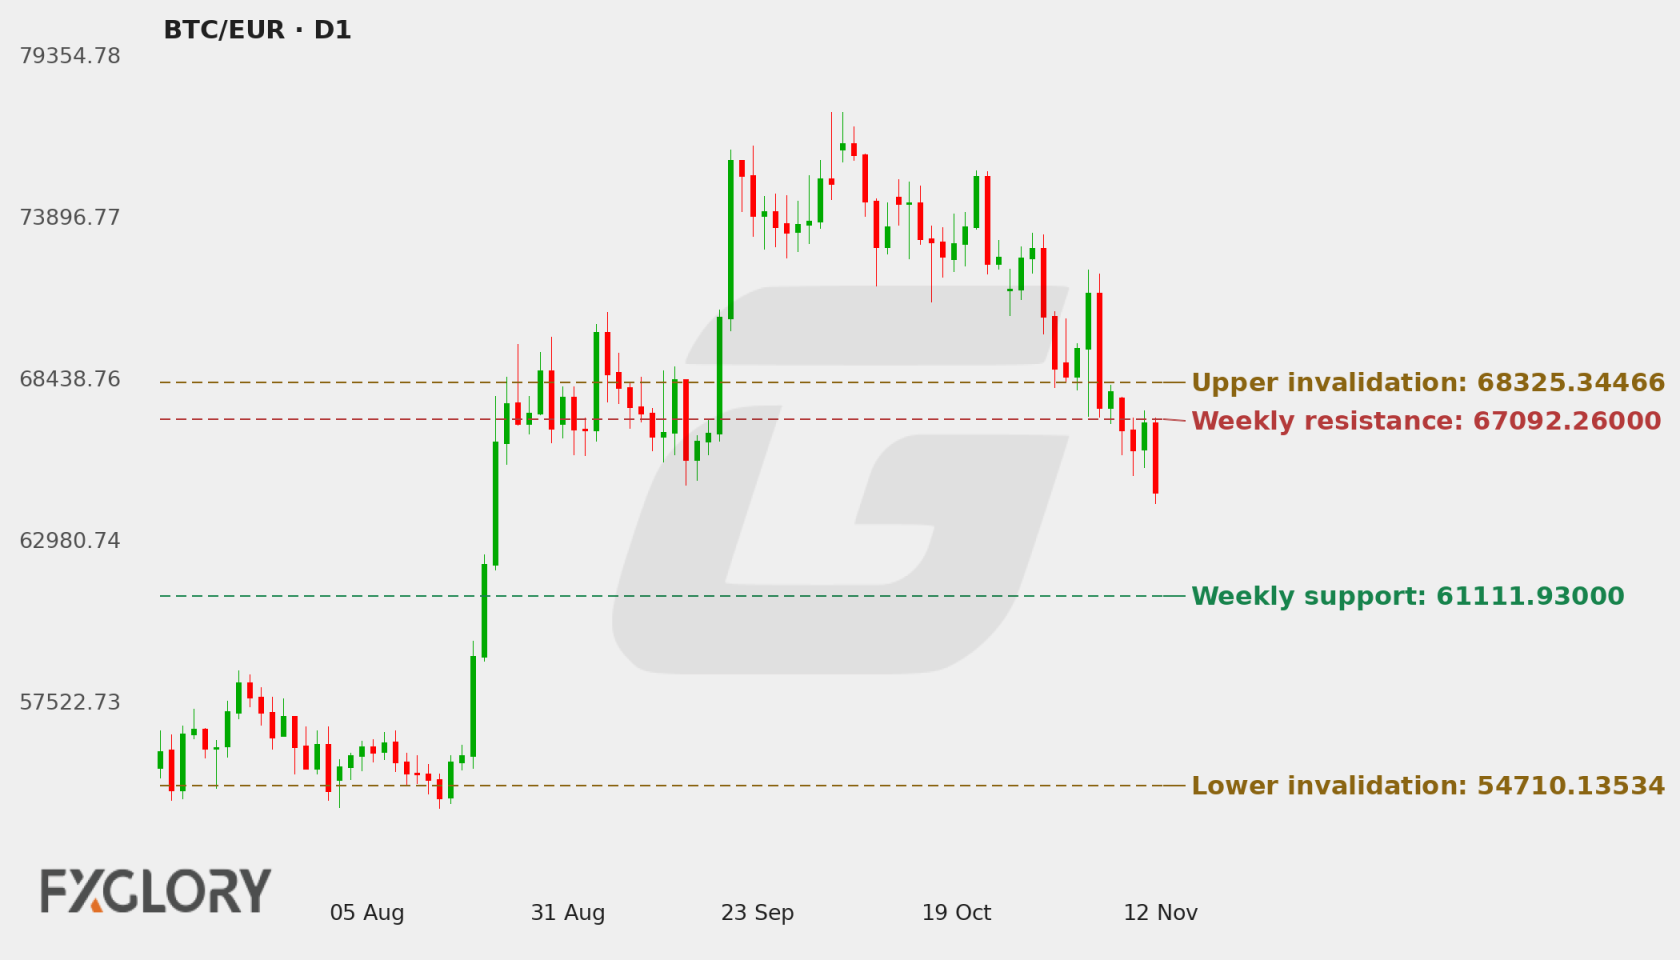
D1 Price Action and Market Structure
The reference close of 62472.35 sits above primary support at 61111.93 and below primary resistance at 67092.26, so it is inside the range formed by those two levels. The D1 close sequence is mixed, and the close is below the D1 SMA200 at 62805.9287, which keeps the long-term average as a meaningful reference that price has not yet reclaimed.
H4 Tactical Triggers
H4 confirms the tactical direction but does not yet deliver a break. The H4 close sits above the H4 support at 61111.93 and below the H4 resistance at 63391.92, while also remaining below the H4 EMA20 at 64827.93962, the H4 EMA50 at 66689.95138 and the H4 Bollinger middle band. H4 therefore adds timing context: the tactical picture leans lower, but it has not yet forced a move through its own support, so H4 supports the D1 thesis only partially.
Technical Indicators at a Glance
Automated technical summary
Bearish D1 trend with negative momentum, a bearish H4 tactical state and a stable volatility state. The reference close sits above primary support and below primary resistance, and the D1 close sequence is mixed.
Selected snapshot: D1 with H4 tactical context. Updated 14 November 2026.
- RSI30.3Neutral
- MACDBelow signalBearish
- Bollinger BandsOutside bandBelow lower band
- Moving averagesBelow bothBearish
- ATR3.95%Stable
RSI (14)
Neutral
H4 29.48
The RSI is below 50 on both D1 and H4, which confirms weak momentum on both timeframes. A low RSI by itself does not signal a reversal, so it reinforces the bearish thesis without indicating when a rebound would start.
- D1 RSI
- 30.3
- H4 RSI
- 29.48
MACD (12, 26, 9)
Bearish momentum
MACD sits below its signal line on both D1 and H4, with negative histograms, so the momentum evidence agrees with the bearish trend. The lines are both negative, which shows that momentum is weak rather than only turning, and this supports the D1 thesis as the controlling read.
- MACD
- -1921.302449
- Signal
- -1091.151157
- Histogram
- -830.151292
Bollinger Bands (20, 2σ)
Below lower band
Striped ends = price outside the bands.
The reference close sits below the middle band on both D1 and H4, so price has not returned to the mean on either timeframe. The bands describe the trading environment and do not add directional certainty on their own.
- Position in band
- Below lower band
- Band width
- 18.79%
Moving averages (D1)
Bearish structure
- 50 EMA falling69072.17179Price is 9.55% below
- 200 SMA rising62805.92870Price is 0.53% below
The close is below the D1 EMA20, EMA50 and SMA200, which places the medium-term structure on the weaker side. The EMA50 slope is falling while the SMA200 slope is rising, so the medium-term average is rolling over while the long-term average still rises. The close sitting below the rising SMA200 is the main tension in the trend picture.
- D1 close
- 62472.35000
- 50 EMA
- 69072.17179
- 200 SMA
- 62805.92870
ATR (14)
Stable volatility
One ATR either side of the latest close. A measure of move size, not a price target.
Volatility is stable, so the environment supports orderly development rather than an abrupt expansion. Stable volatility does not indicate direction, but it means level tests are more likely to develop gradually than through a sudden range break.
- D1 ATR
- 2466.16932 (3.95%)
- H4 ATR
- 1025.99002 (1.64%)
Technical conclusion: The weekly thesis is bearish because the D1 trend, D1 momentum and H4 tactical state agree. The strongest supporting evidence is the close below the D1 averages and the negative MACD, while the strongest counterargument is that the reference close still holds above primary support and the close sequence is mixed. The next important levels are primary support at 61111.93 for a structural break and primary resistance at 67092.26 for any recovery that would challenge the bearish framework.
View all live BTC/EUR oscillators, moving averages, pivot points and timeframe signals.
BTC/EUR Weekly Support, Resistance and Invalidation
| Level | Role | Timeframe | Why it matters |
|---|---|---|---|
| 61111.93 | Primary support | D1 | The reference D1 close sits above this level, so a completed D1 close below it is the structural break that gives the bearish scenario its weekly relevance. |
| 55943.22 | Secondary support | D1 | This is the next structural reference beneath primary support and the first bearish target. |
| 67092.26 | Primary resistance | D1 | A completed D1 close above this level would be needed before the bullish scenario could be treated as structurally established. |
| 68520.81 | Secondary resistance | D1 | This is the first bullish target and the next structural reference above primary resistance. |
| 63391.92 | H4 resistance | H4 | This tactical level marks the nearest H4 resistance and the key test for short-term rebounds. |
| 61111.93 | H4 support | H4 | The H4 close sits above this level, so a completed H4 close below it would add tactical confirmation to the bearish case. |
| 68325.34466 | Formal upper boundary | D1 | A single completed D1 close above this boundary would move the daily structure beyond the bearish framework. |
| 54710.13534 | Formal lower boundary | D1 | A single completed D1 close below this boundary would fall through the secondary support and mark the lower edge of the formal framework. |
These are forecast-specific market-structure levels. Formula-based Classic, Fibonacci and Camarilla pivots remain on the Technical page.
Economic News & Events to Watch for BTC/EUR This Week
Selected events may increase BTC/EUR volatility. Direction depends on the released value relative to consensus and previous results.
Scroll table sideways for more columns →
| Event | Date and time | Importance | Previous | Consensus |
|---|---|---|---|---|
| ECB Financial Stability Review | 18 Nov 2026 12:00 GMT+3 | Medium | — | — |
| ECB President Lagarde Speaks | 18 Nov 2026 17:25 GMT+3 | Medium | — | — |
| ECB President Lagarde Speaks | 19 Nov 2026 16:30 GMT+3 | Medium | — | — |
| ECB President Lagarde Speaks | 20 Nov 2026 11:15 GMT+3 | Medium | — | — |
Calendar source: FXGlory economic calendar. Retrieved 14 Nov 2026 16:17 GMT+3. View the complete BTC/EUR economic calendar.
BTC/EUR Outlook for 14–21 November 2026
The weekly bias is bearish because D1 controls the thesis and the D1 trend, momentum and H4 tactical state all lean lower. The reference close above primary support keeps the argument conditional, and the bearish case only gains structural weight when a completed D1 close moves below 61111.93.
The base scenario is the most relevant alternative while price stays between 61111.93 and 67092.26, and the bullish case needs a completed D1 close above 67092.26 before it can be taken seriously. The scheduled ECB commentary adds volatility risk around these levels, but it does not change the technical hierarchy.
Weekly Forecast Risks and What Would Change the Outlook
- Proximity to primary support without a completed break: The reference close is above 61111.93, so the bearish thesis remains conditional until a completed D1 close moves below that level.
- Mixed D1 close sequence: A mixed sequence means the bearish state rests more on averages and momentum than on a continuous run of lower closes, which tempers conviction.
- Rising SMA200 against a falling EMA50: The close sits below a rising long-term average, so the medium-term and long-term averages give different signals that could slow the weekly development.
- ECB speaking cluster: Medium-impact EUR events on 18–20 November 2026 could add volatility near the primary levels without providing a directional signal.
Formal weekly invalidation: The bearish weekly thesis is formally invalidated by one completed D1 close above 68325.34466. One completed D1 close below 54710.13534 confirms lower structural extension and continuation.
BTC/EUR Weekly Forecast FAQs
Is BTC/EUR bullish or bearish this week?
The bias is bearish because the D1 trend, D1 momentum and H4 tactical state all lean lower. The reference close still holds above primary support, so the bias is a conditional weekly view rather than a confirmed breakdown.
What scenario would strengthen for BTC/EUR this week?
The bearish case gains relevance if a completed D1 close moves below 61111.93, which would open the secondary support at 55943.22 as the next structural reference. The base case, a consolidation between 61111.93 and 67092.26, remains the main alternative while the close sequence stays mixed.
What are the key BTC/EUR support and resistance levels?
The key levels are primary support at 61111.93, secondary support at 55943.22, primary resistance at 67092.26 and secondary resistance at 68520.81. The H4 resistance at 63391.92 is the nearer tactical reference for short-term rebounds.
What would invalidate this BTC/EUR forecast?
The bearish weekly thesis is formally invalidated by one completed D1 close above 68325.34466.
Methodology, Data and Sources
- Price-data source: FXGlory price feed (BTCEUR)
- Live quote timestamp: 14 Nov 2026 02:50 GMT+3
- Weekly analysis timestamp: 14 November 2026
- Chart timestamp: 14 November 2026 (redrawn daily)
- Daily check: Every day at 04:00 GMT+3: the latest completed D1 close is checked against the invalidation levels and the chart is redrawn.
- Technical snapshot timestamp: 14 November 2026
- Calendar-data source: FXGlory economic calendar
- Calendar retrieval timestamp: 14 Nov 2026 16:17 GMT+3
- Candle convention: FXGlory D1 and H4 candles; D1 candle dates are evaluated in UTC and invalidation uses completed D1 closes only.
- Indicator settings: D1 RSI(14), MACD(12,26,9), Bollinger Bands(20,2), EMA(50), SMA(200), ATR(14); H4 RSI/MACD/Bollinger/EMA/ATR.
- Level-selection method: Weekly D1 support/resistance levels are structural market levels. Formal invalidation uses a hard 1.25× D1 ATR(14) minimum anchor distance plus a 0.50× D1 ATR(14) outward buffer; H4 levels are tactical only.
- Weekly forecast method: D1 controls the weekly thesis; H4 supplies tactical confirmation/warning only.