
BTCEUR Forecast

BTC/EUR Forecast — 22 August 2026

Time Zone: GMT +3

Time Frame: Daily (D1) / Weekly Outlook

Weekly Fundamental Overview:

The BTC/EUR market continues to be influenced by shifting market liquidity and Eurozone economic trends. Underlying demand for cryptocurrency risk assets interacts with macro conditions in Europe, where key inflation reports can shift Euro valuation and impact cross-asset trading sentiment.

Price Action:

On the daily (D1) chart, BTC/EUR (BTCEUR) has shown strong bullish momentum, rising sharply from recent lows near 54,307.27 to close at 62,193.61. The series of consecutive bullish daily candles highlights aggressive buyer participation pushing price near major technical barriers.

Key Technical Indicators:

Bollinger Bands: The pair is trading well above the upper Bollinger Band of 59,520.63, reflecting heightened volatility and an extended upside movement. The middle band at 56,111.38 and lower band at 52,702.13 mark potential areas of mean reversion should a pullback occur.

RSI: With a 14-day RSI standing at 72.45, the market has crossed into overbought territory. This reflects strong bullish pressure but also suggests the potential for brief cooling or price consolidation.

MACD: The D1 MACD indicator shows a positive value of 557.07, confirming robust bullish momentum and upward momentum alignment across recent sessions.

Support and Resistance:

Key technical levels on the daily chart include primary support at 50,609.45 and immediate resistance at 63,602.43.

News to Watch for BTCEUR This Week:

  • German Prelim CPI m/m: This release could impact Euro volatility and broader risk asset valuation.
  • CPI Flash Estimate y/y: Headline Eurozone inflation figures may influence European Central Bank policy expectations.
  • Core CPI Flash Estimate y/y: Core inflation data provides key insight into underlying price trends across the Eurozone.

Weekly Outlook and Consideration:

The D1 outlook for BTC/EUR remains elevated following a powerful advance toward resistance at 63,602.43. While positive MACD alignment supports the ongoing trend, an overbought RSI reading of 72.45 advises monitoring for potential consolidation above the upper Bollinger Band. Incoming European inflation releases could further sway momentum across the pair.

Disclaimer: The analysis provided for BTC/EUR is for informational purposes only and does not constitute investment advice. Traders are encouraged to perform their own analysis and research before making any trading decisions. Market conditions can change quickly, so staying informed with the latest data is essential.
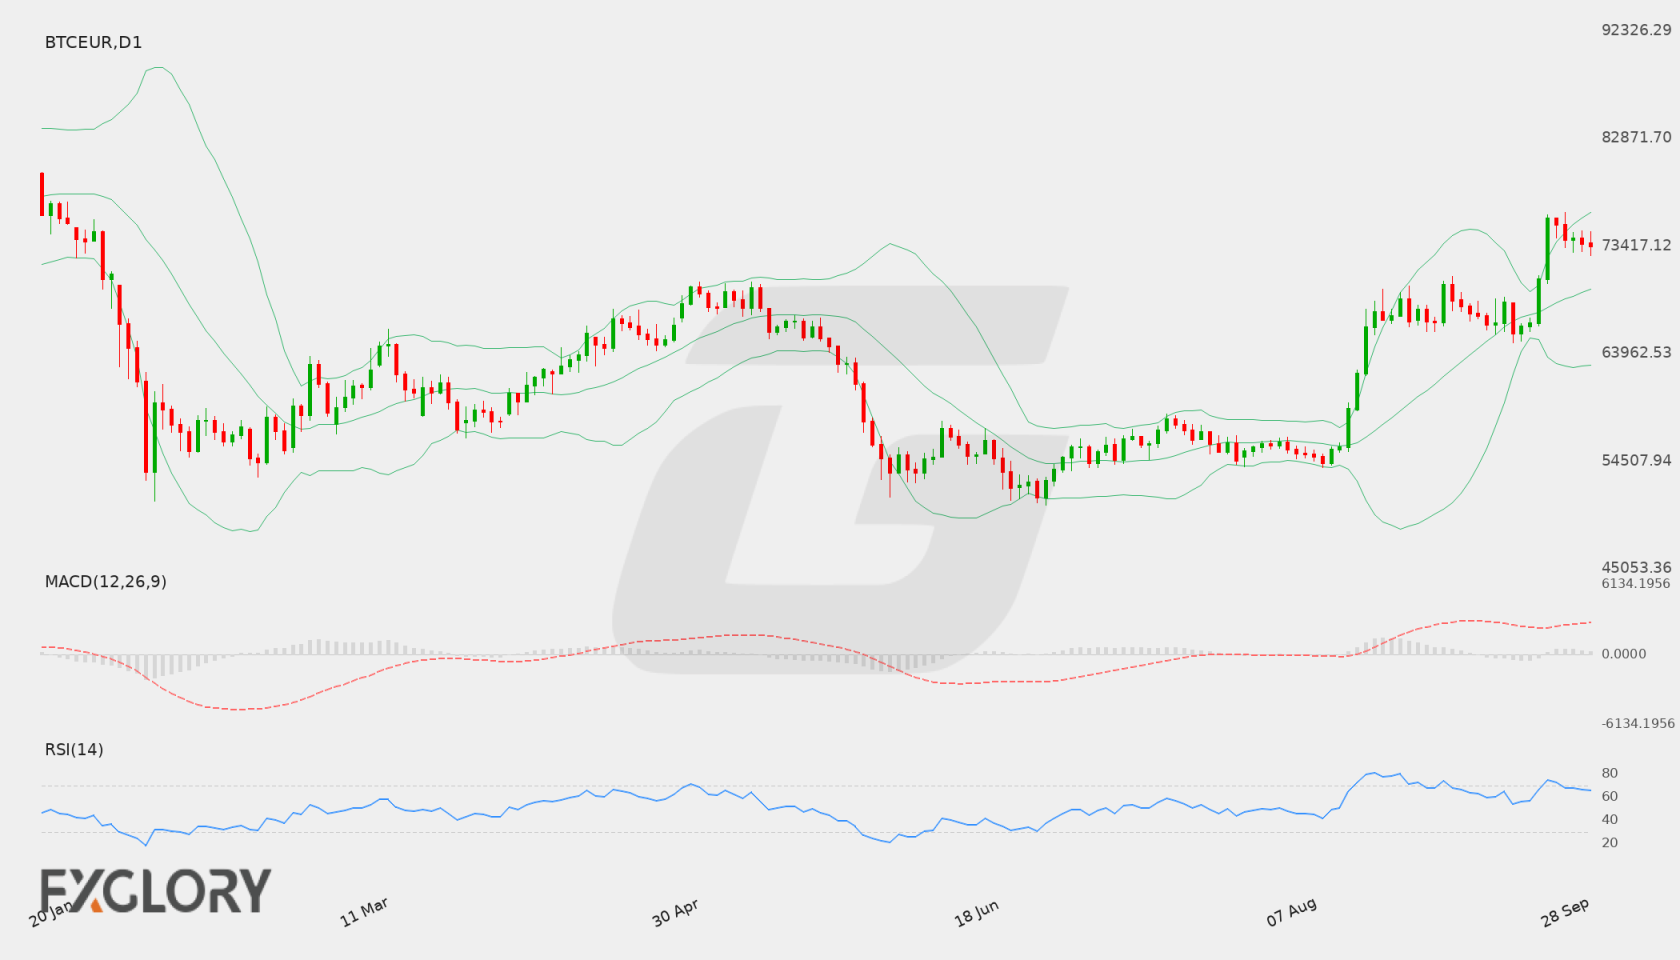
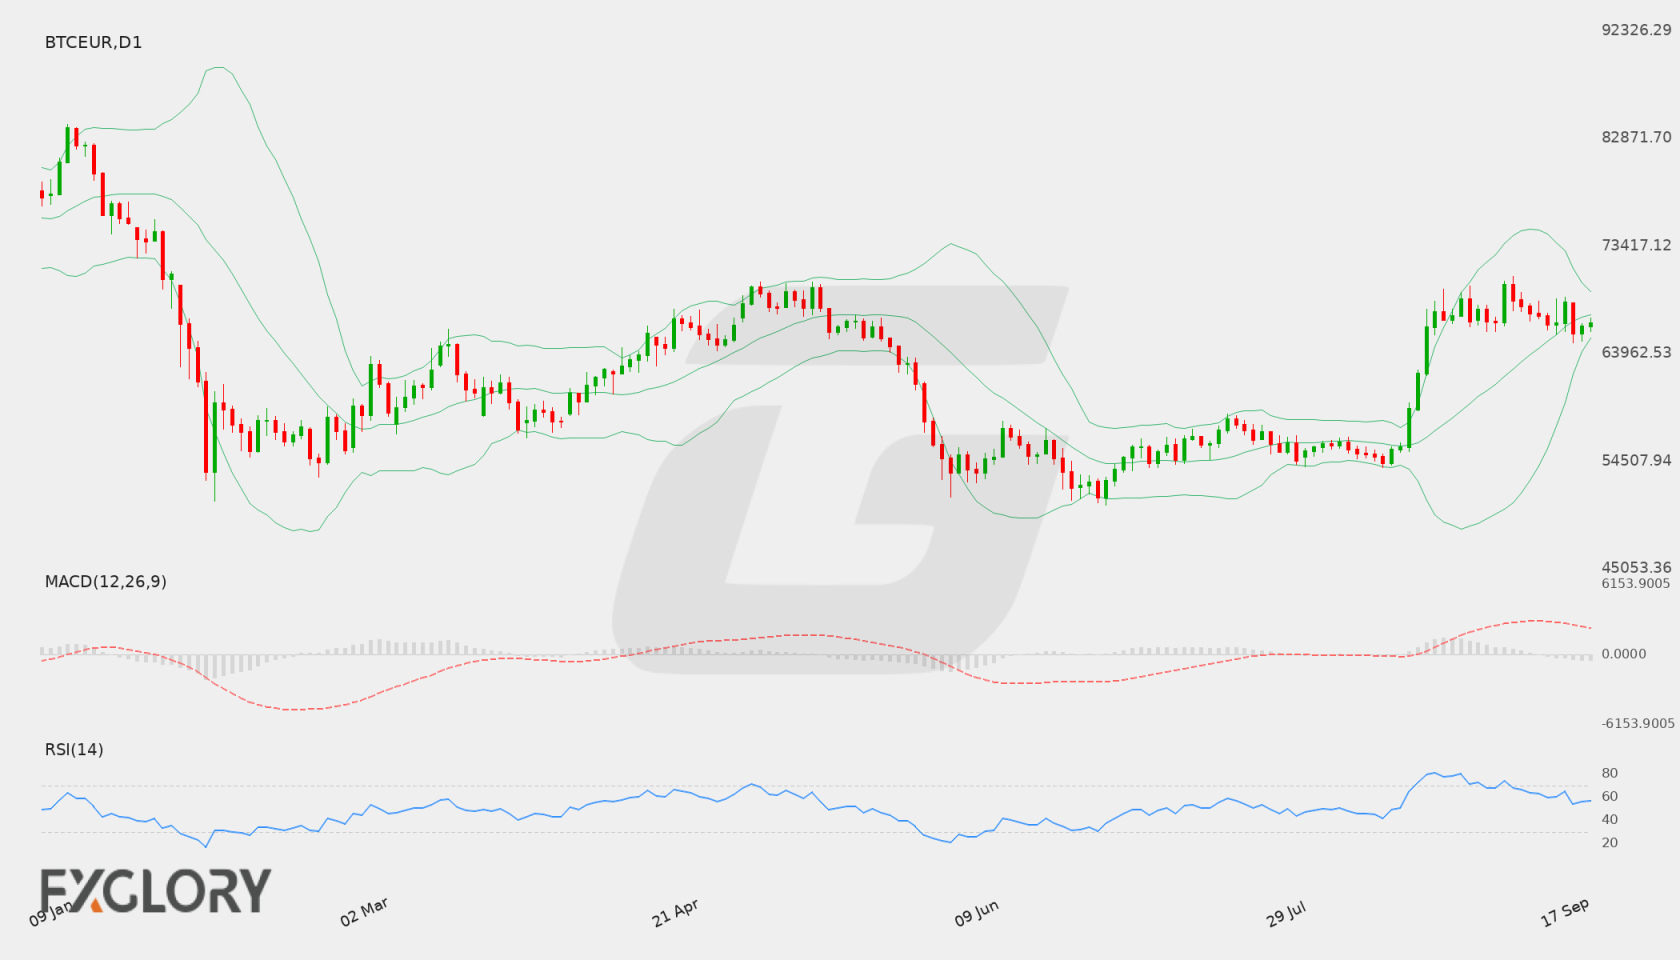
BTC/EUR D1 technical analysis chart
BTC/EUR D1 Technical Analysis for 08.22.2026

BTC/EUR Forecast — 15 August 2026

Time Zone: GMT +3

Time Frame: Daily (D1) / Weekly Outlook

Weekly Fundamental Overview:

Broader economic conditions across Europe and overall cryptocurrency market sentiment continue to influence BTC/EUR. Shifts in institutional capital flows, regulatory developments, and economic indicators within the Eurozone can impact market volatility and trader sentiment.

Price Action:

On the Daily (D1) chart, BTC/EUR closed recently at 54,934.46 after experiencing a period of sideways movement and consolidation following a pullback from higher levels. Prices have been testing lower boundary levels while attempting to stabilize near current market prices.

Key Technical Indicators:

Bollinger Bands: The Bollinger Bands indicator shows a middle band at 56,086.10, an upper band at 57,975.72, and a lower band at 54,196.48. Price action near the lower band suggests potential support, while the middle band remains an immediate upside resistance area.

RSI: The 14-period Relative Strength Index (RSI) stands at 44.56, placing the instrument in neutral-to-bearish territory below the 50 level without signaling oversold conditions.

MACD: The Daily MACD prints a negative value of -246.61, reflecting ongoing bearish momentum over recent trading sessions, though histogram contraction could hint at potential momentum shifts.

Support and Resistance:

Key technical levels on the Daily chart show key support at 50,609.45 and major resistance at 67,092.26, providing critical boundaries for prospective price moves.

News to Watch for BTCEUR This Week:

  • French Flash Services PMI: Measures economic activity in the French services sector which can impact Euro volatility and broader market sentiment.

Weekly Outlook and Consideration:

BTC/EUR is expected to consolidate within the current range, with potential tests of the lower support boundary if bearish momentum persists.

Disclaimer: The analysis provided for BTC/EUR is for informational purposes only and does not constitute investment advice. Traders are encouraged to perform their own analysis and research before making any trading decisions. Market conditions can change quickly, so staying informed with the latest data is essential.
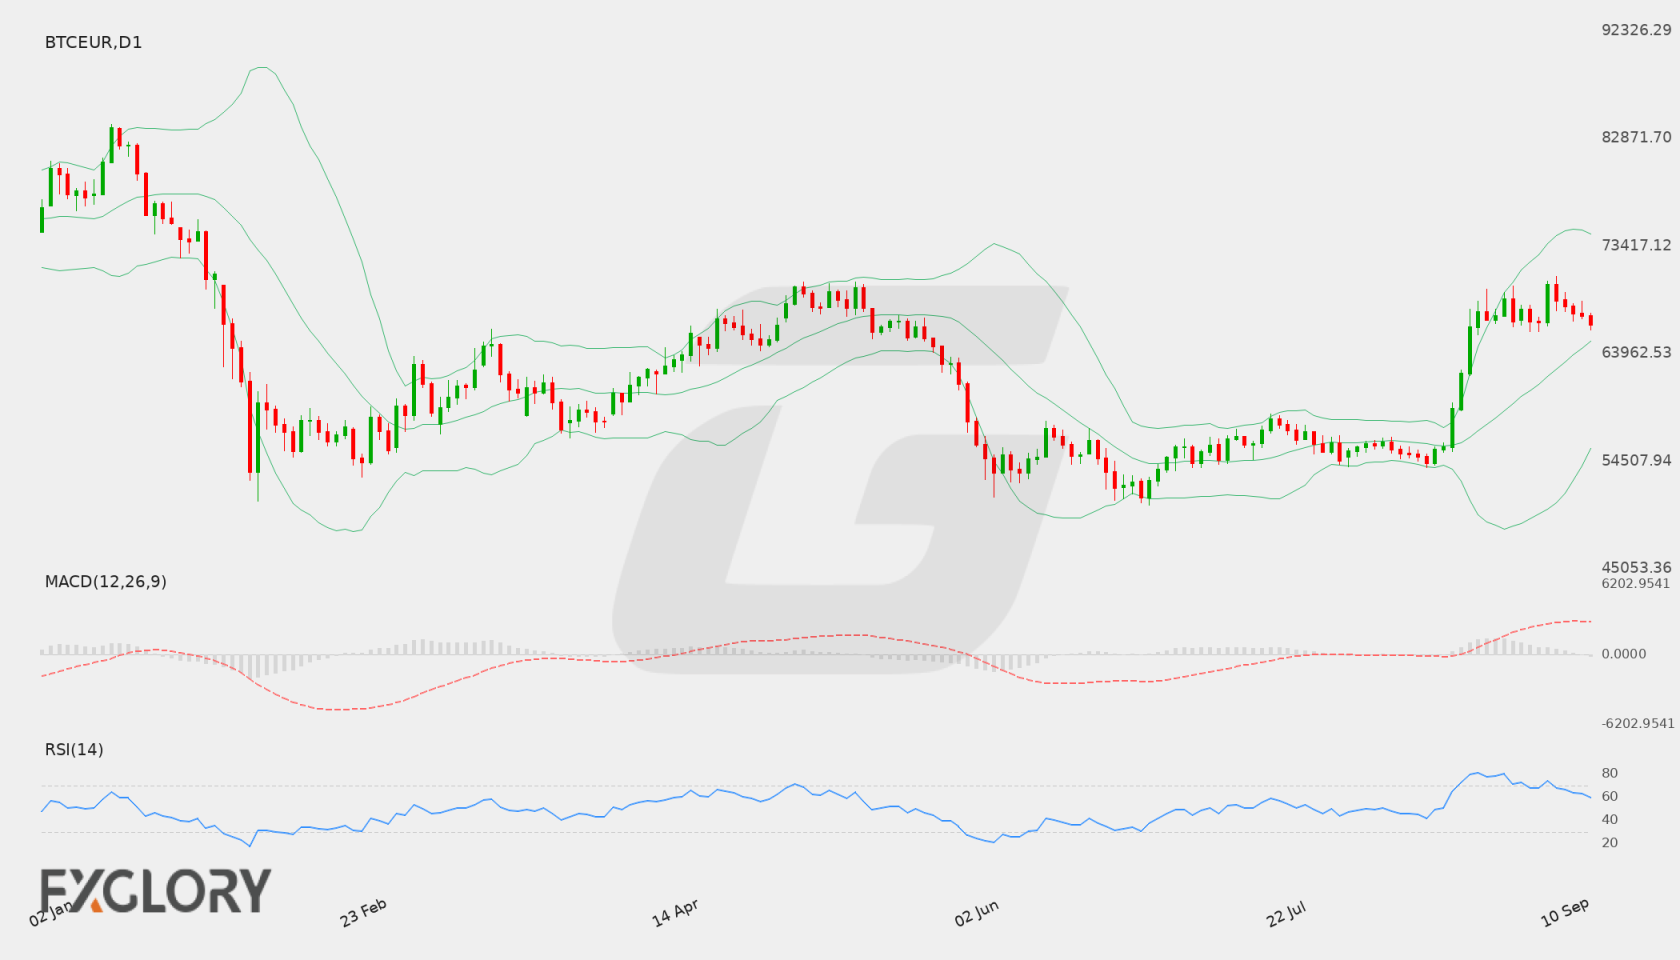
BTC/EUR D1 technical analysis chart
BTC/EUR D1 Technical Analysis for 08.15.2026

BTC/EUR Forecast — 9 August 2026

Time Zone: GMT +3

Time Frame: Daily (D1) / Weekly Outlook

Weekly Fundamental Overview:

The BTC/EUR (BTCEUR) pair continues to reflect a blend of broader cryptocurrency market trends and Eurozone economic dynamics. As market participants analyze potential shifts in Euro strength, upcoming macroeconomic reports from major Eurozone economies like France and Germany may influence quote currency valuations and drive short-term volatility across Euro-denominated digital asset pairs.

Price Action:

Daily chart price action shows BTC/EUR consolidating following recent fluctuations between the 50,609.45 support and 70,003.93 resistance range. The pair recorded a recent daily closing price of 55,859.28, remaining in a tight neutral pattern after testing higher levels near 58,202.09 earlier in the period.

Key Technical Indicators:

Bollinger Bands: The daily Bollinger Bands place the middle band at 56,218.50, with the upper band at 58,050.23 and lower band at 54,386.78. BTC/EUR trading just below the middle band signals a neutral-to-slightly cautious technical stance without immediate volatility expansion.

RSI: The 14-day Relative Strength Index (RSI) registers at 49.10, positioning the oscillator near the mid-50 level and confirming a neutral sentiment without overbought or oversold extremes.

MACD: The Moving Average Convergence Divergence (MACD) main line sits at -115.64, reflecting persistent underlying bearish momentum over the Daily timeframe despite recent temporary price rebounds.

Support and Resistance:

Key technical parameters highlight primary support at 50,609.45 and overhead resistance at 70,003.93. Additional dynamic reference points include the Bollinger upper band at 58,050.23 and lower band at 54,386.78.

News to Watch for BTCEUR This Week:

  • French Flash Services PMI: Measures activity levels in the French service sector, which could influence Euro sentiment and cross-asset flows.
  • French Flash Manufacturing PMI: Indicates industrial activity in France, offering insight into Eurozone growth expectations.
  • German Flash Manufacturing PMI: Reflects manufacturing health in Germany and may impact the relative value of the Euro against digital assets.

Weekly Outlook and Consideration:

Looking ahead, BTC/EUR appears bound within a defined consolidation band anchored between support at 50,609.45 and resistance at 70,003.93. With the RSI holding around 49.10 and MACD remaining in negative territory at -115.64, traders should monitor potential reactions near the Bollinger middle band at 56,218.50 and incoming Eurozone PMI data for directional cues.

Disclaimer: The analysis provided for BTC/EUR is for informational purposes only and does not constitute investment advice. Traders are encouraged to perform their own analysis and research before making any trading decisions. Market conditions can change quickly, so staying informed with the latest data is essential.
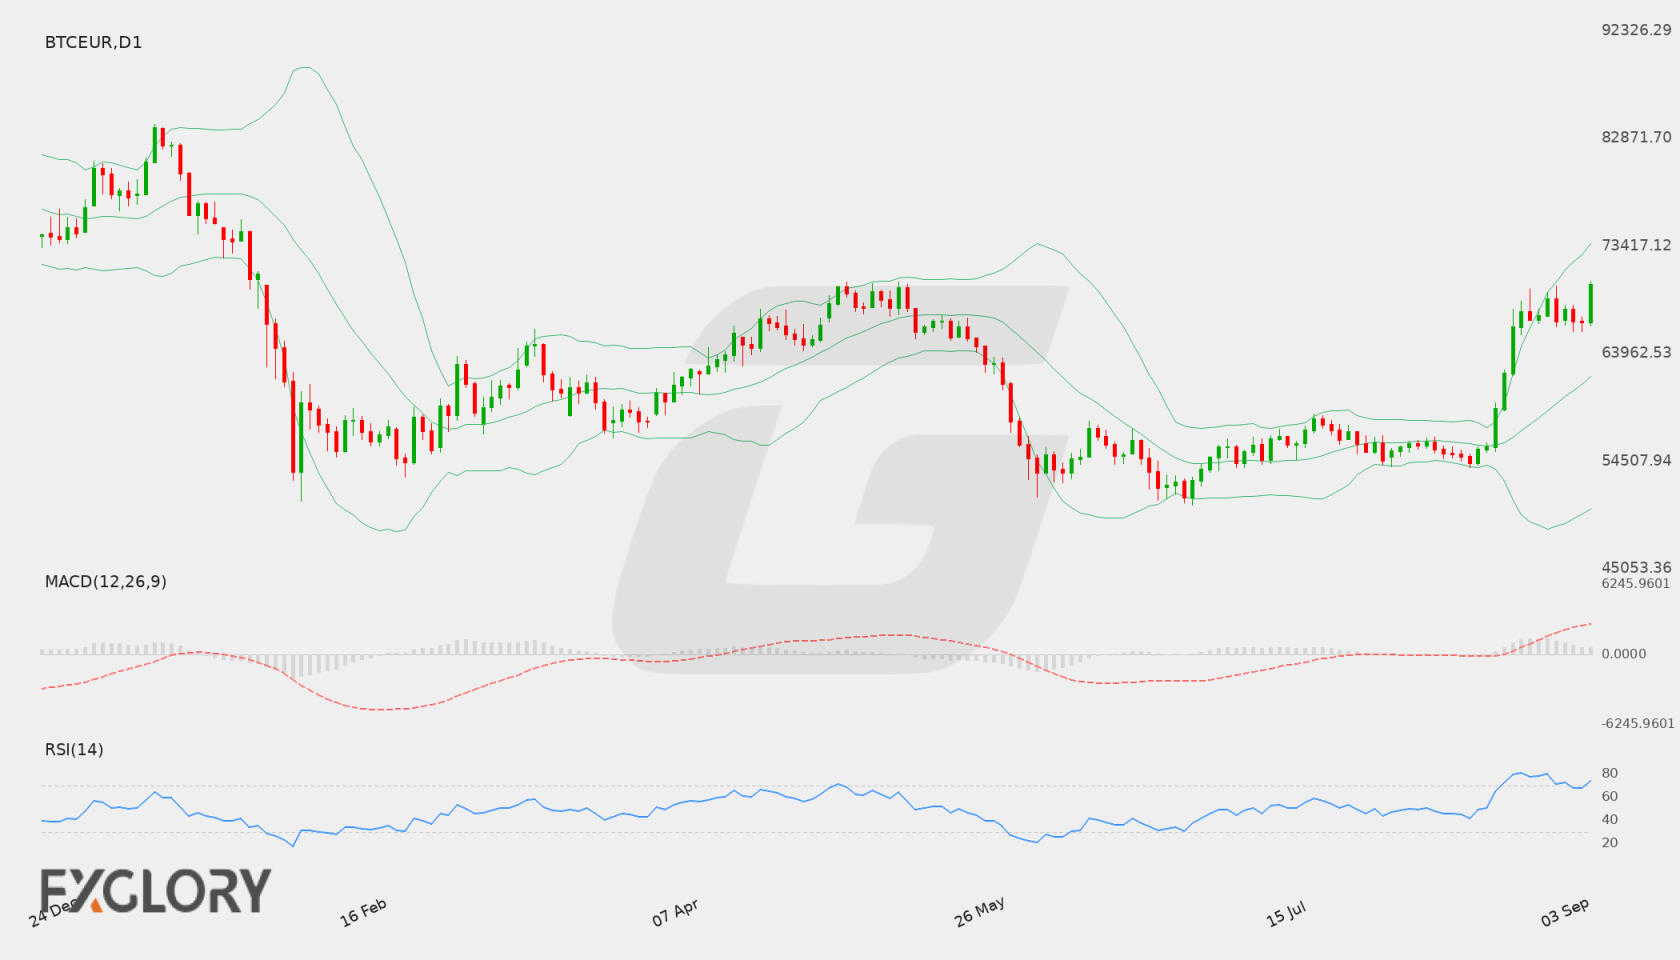
BTC/EUR D1 technical analysis chart
BTC/EUR D1 Technical Analysis for 08.09.2026

BTC/EUR Forecast — 2 August 2026

Time Zone: GMT +4

Time Frame: 4 Hours (H4)

Fundamental Analysis:

With no economic events scheduled in the provided calendar for BTC/EUR (BTCEUR), the fundamental backdrop remains driven by current market sentiment and broader cryptocurrency sector flows. Traders are monitoring technical setups in the absence of fresh macroeconomic data releases.

Price Action:

The H4 chart for BTC/EUR shows a clear corrective path from recent peaks above 58,000.00 down to a recent close at 54,516.49. Bearish candles have pushed the price down, testing lower boundaries and reflecting consistent short-term selling pressure.

Key Technical Indicators:

Bollinger Bands(20,2.000): Bollinger Bands indicators show a middle line at 55,876.51, an upper band at 56,793.74, and a lower band at 54,959.27. The recent close of 54,516.49 sits below the lower Bollinger Band, emphasizing strong downward momentum in the H4 timeframe.

MACD(12,26,9): The MACD indicator registers a reading of -333.88, remaining below the zero line and signaling sustained bearish momentum for the BTCEUR pair over recent trading sessions.

RSI(14): The 14-period Relative Strength Index (RSI) stands at 31.36. This value reflects heavy selling pressure and positions the instrument just above the traditional oversold threshold of 30.

Support and Resistance:

Key technical boundaries for BTC/EUR include technical support at 54,222.38 and overhead resistance at 58,610.37. These levels define the primary parameters for potential price interactions on the H4 timeframe.

Conclusion and Consideration:

BTC/EUR (BTCEUR) maintains a bearish bias on the H4 chart, closing at 54,516.49 near key support at 54,222.38. Technical indicators including an RSI of 31.36 and a MACD of -333.88 highlight persistent downside momentum, while resistance at 58,610.37 remains a distant level to the upside.

Disclaimer: The analysis provided for BTC/EUR is for informational purposes only and does not constitute investment advice. Traders are encouraged to perform their own analysis and research before making any trading decisions. Market conditions can change quickly, so staying informed with the latest data is essential.

BTC/EUR H4 technical and fundamental analysis
BTC/EUR H4 Technical and Fundamental Analysis for 08.02.2026
1BTC = –––EUR –––%
BTCEUR
Loading chart...