

How Alligator Lag and the Sleep Phase Work
The Alligator combines smoothed moving averages, so it responds to price with the delay expected from a trend-following average. Its Jaw, Teeth, and Lips are also plotted 8, 5, and 3 bars forward. Those shifts move the displayed lines; they do not translate into a fixed number of pips that must be missed before a trend is recognized.
MetaTrader's description of the Bill Williams Alligator states that clear trends may be visible only about 15-30% of the time and describes intertwined lines as a sleeping phase. Treat that percentage as part of the indicator's original framework rather than a universal statistic for every instrument, timeframe, or market regime.
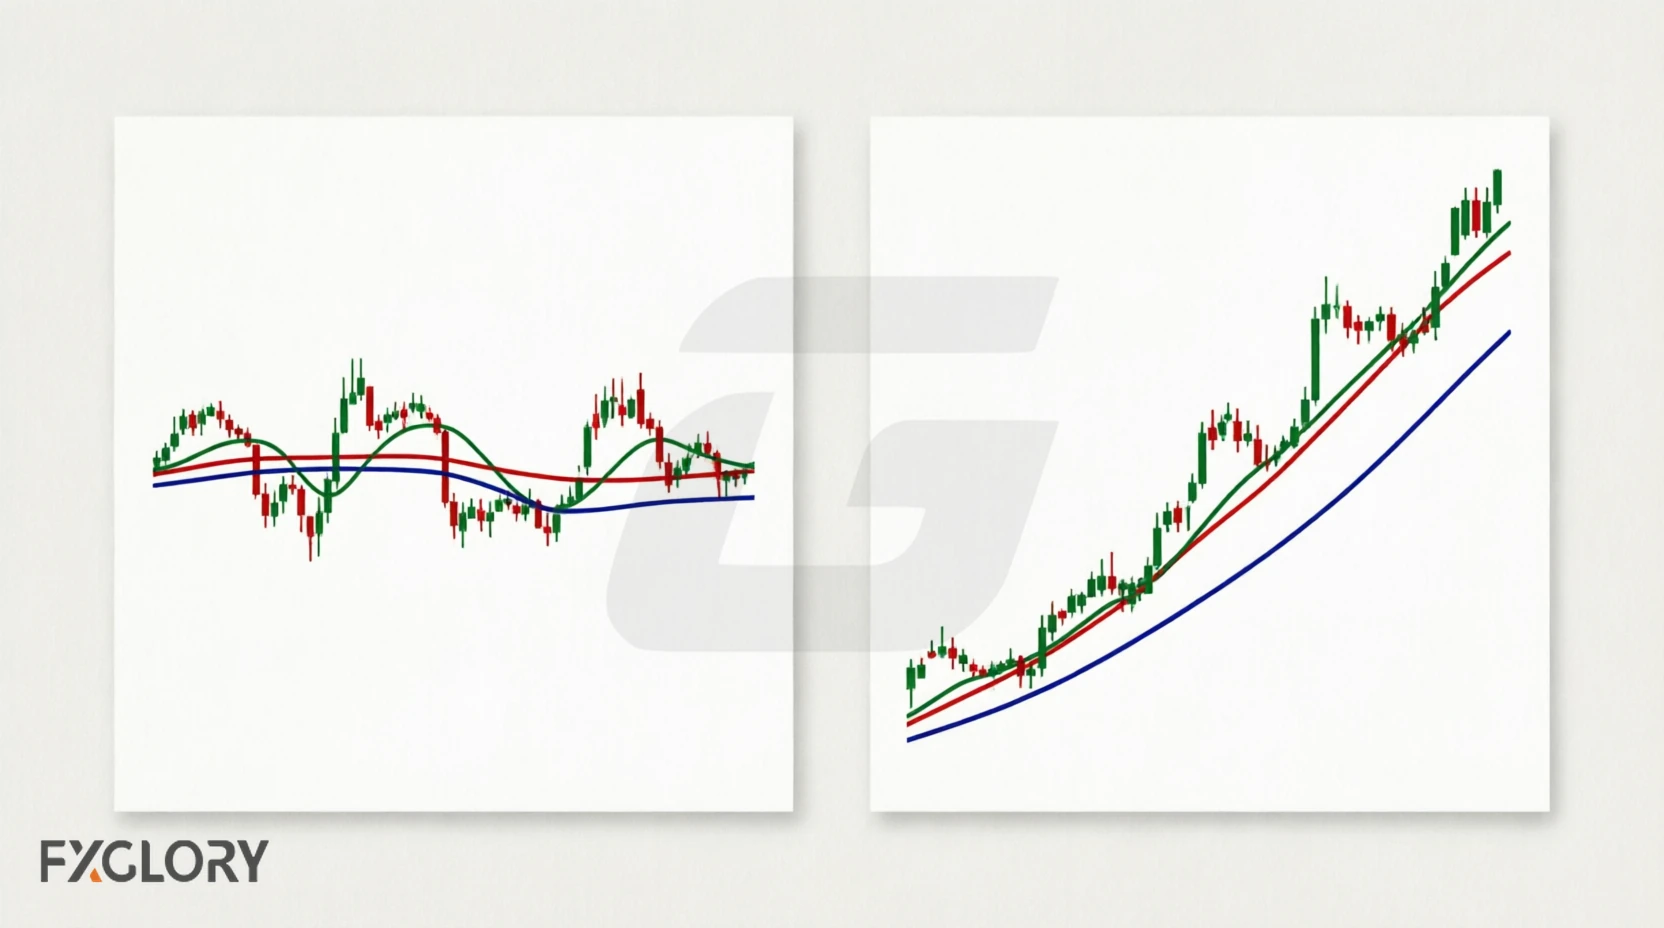
For practical use, the important distinction is between compressed, mixed lines and clearly separated lines moving in a common direction. A rule-based strategy should define those conditions explicitly and then test them on the intended market rather than assuming that every sleeping phase will produce a loss or every separated phase will produce a profitable trend.
The Anatomy: Jaw, Teeth, and Lips Explained
The indicator consists of three Smoothed Moving Averages (SMMA) applied to the Median Price (High + Low) / 2, shifted forward in time:
- Jaw (Blue line): 13-period SMMA shifted 8 bars forward. It is the slowest of the three lines.
- Teeth (Red line): 8-period SMMA shifted 5 bars forward. It reacts faster than the Jaw.
- Lips (Green line): 5-period SMMA shifted 3 bars forward. It is the fastest of the three lines.
The Four Phases: Sleeping, Awakening, Feeding, Sated
The Alligator cycles through four distinct phases. Recognizing each phase is critical to avoiding losses:
| Phase | Visual Characteristics | Trading Action |
|---|---|---|
| 1. Sleeping | Lines intertwined, moving sideways, or tightly grouped relative to recent price movement. Price may oscillate across the lines. | STAND ASIDE IN THIS RULE SET. Intertwined lines indicate that the trend filter is not satisfied and whipsaw risk may be higher. |
| 2. Awakening | Lips (green) crosses above/below Teeth and Jaw. Lines begin to separate slightly. Price breaks decisively beyond all three lines. | WATCH. The lines are beginning to separate, but the full trend filter may not yet be satisfied. |
| 3. Feeding | Lines clearly separated relative to recent price movement and sloping in the same direction. Price remains mainly on one side of the lines. | TREND FILTER ACTIVE. This is the phase in which the rule model looks for a separate entry trigger rather than treating line separation itself as an entry. |
| 4. Sated | Lips crosses back toward Teeth. Lines begin to converge. Price loses momentum and oscillates around the Lips. | REVIEW THE EXIT RULE. Convergence can indicate weakening trend conditions, but the exact exit should follow the strategy's predefined rule. |
Alligator + Fractals + Awesome Oscillator Rule Model
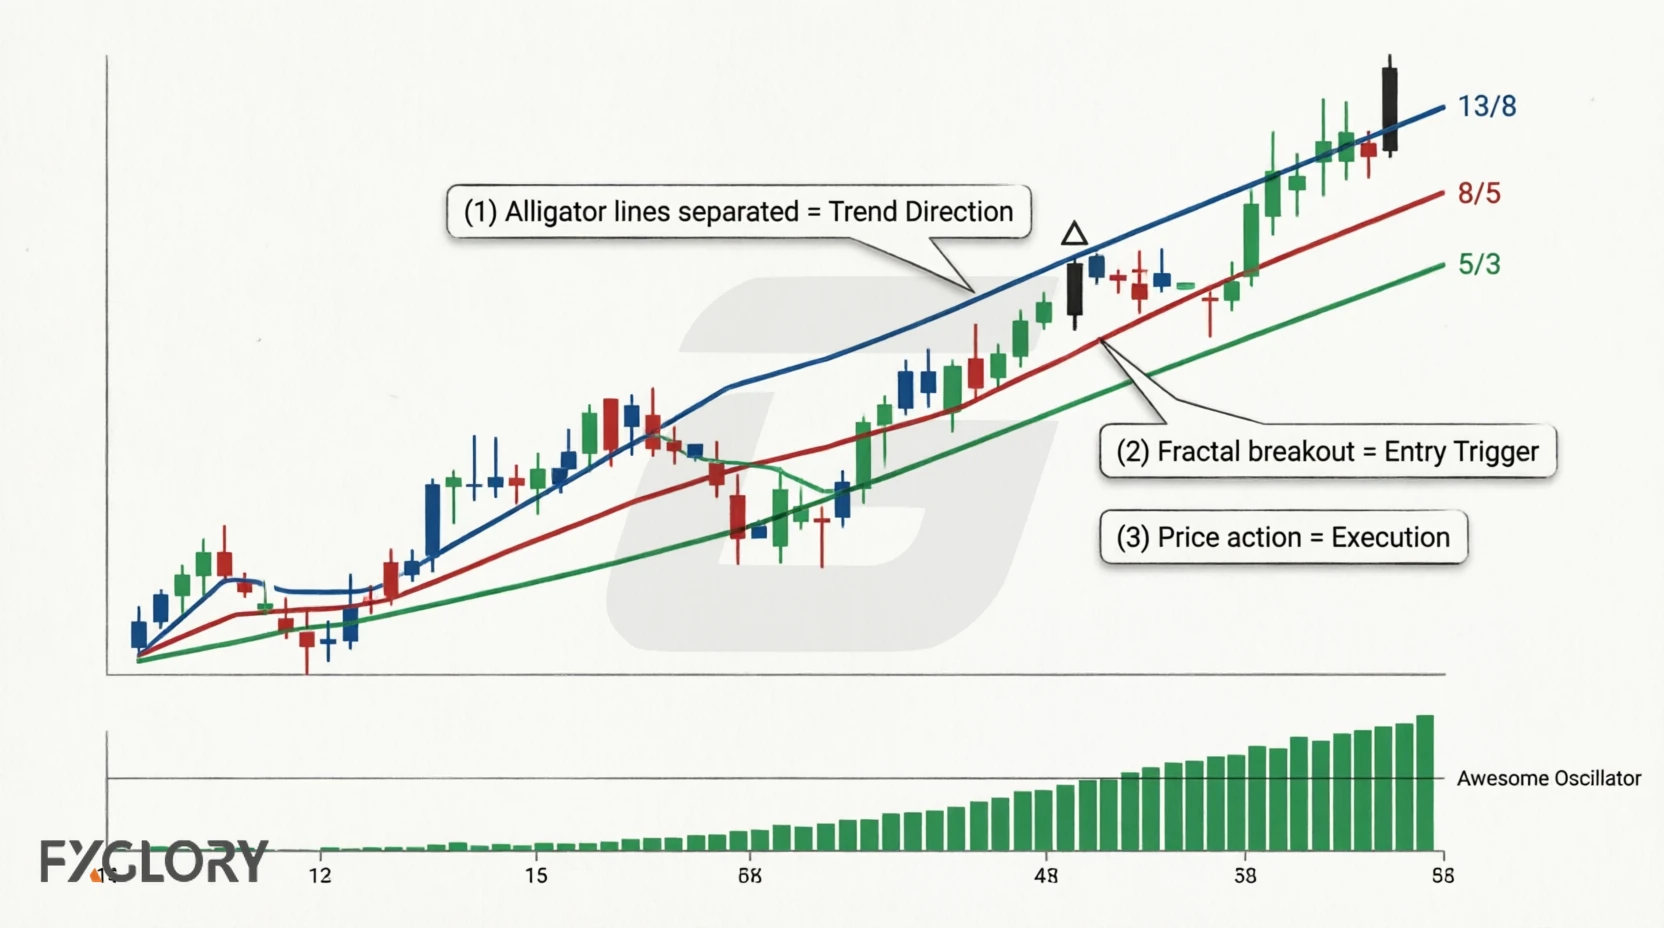
This page tests a three-filter model built from Bill Williams indicators: the Alligator for trend direction, Fractals for a breakout level, and the Awesome Oscillator (AO) for a momentum filter. This combination should not be confused with Alexander Elder's separate Triple Screen Trading System.
Step 1: The Alligator (Trend Direction)
Wait for the Alligator to wake up. The Jaw, Teeth, and Lips must be separated and sloping in the same direction. This establishes the trend direction. If the lines are intertwined, ignore all subsequent steps.
Step 2: Fractals (Structural Breakout)
Identify a 5-bar fractal pattern in the direction of the trend.
- Bullish Fractal: A 5-bar sequence where the middle bar has the highest high.
- Bearish Fractal: A 5-bar sequence where the middle bar has the lowest low.
The entry trigger is the breakout above the bullish fractal high (for buys) or below the bearish fractal low (for sells).
Step 3: Awesome Oscillator (Momentum Confirmation)
For the historical rule model on this page, the Awesome Oscillator (AO) applies a simple zero-line filter:
- For bullish entries: AO must be above zero.
- For bearish entries: AO must be below zero.
Test rule: For this model, a bullish breakout is accepted only when AO is above zero; a bearish breakout is accepted only when AO is below zero. If the AO filter disagrees with the entry direction, the model skips the trade.
Three Entry Styles: Later to Earlier Confirmation
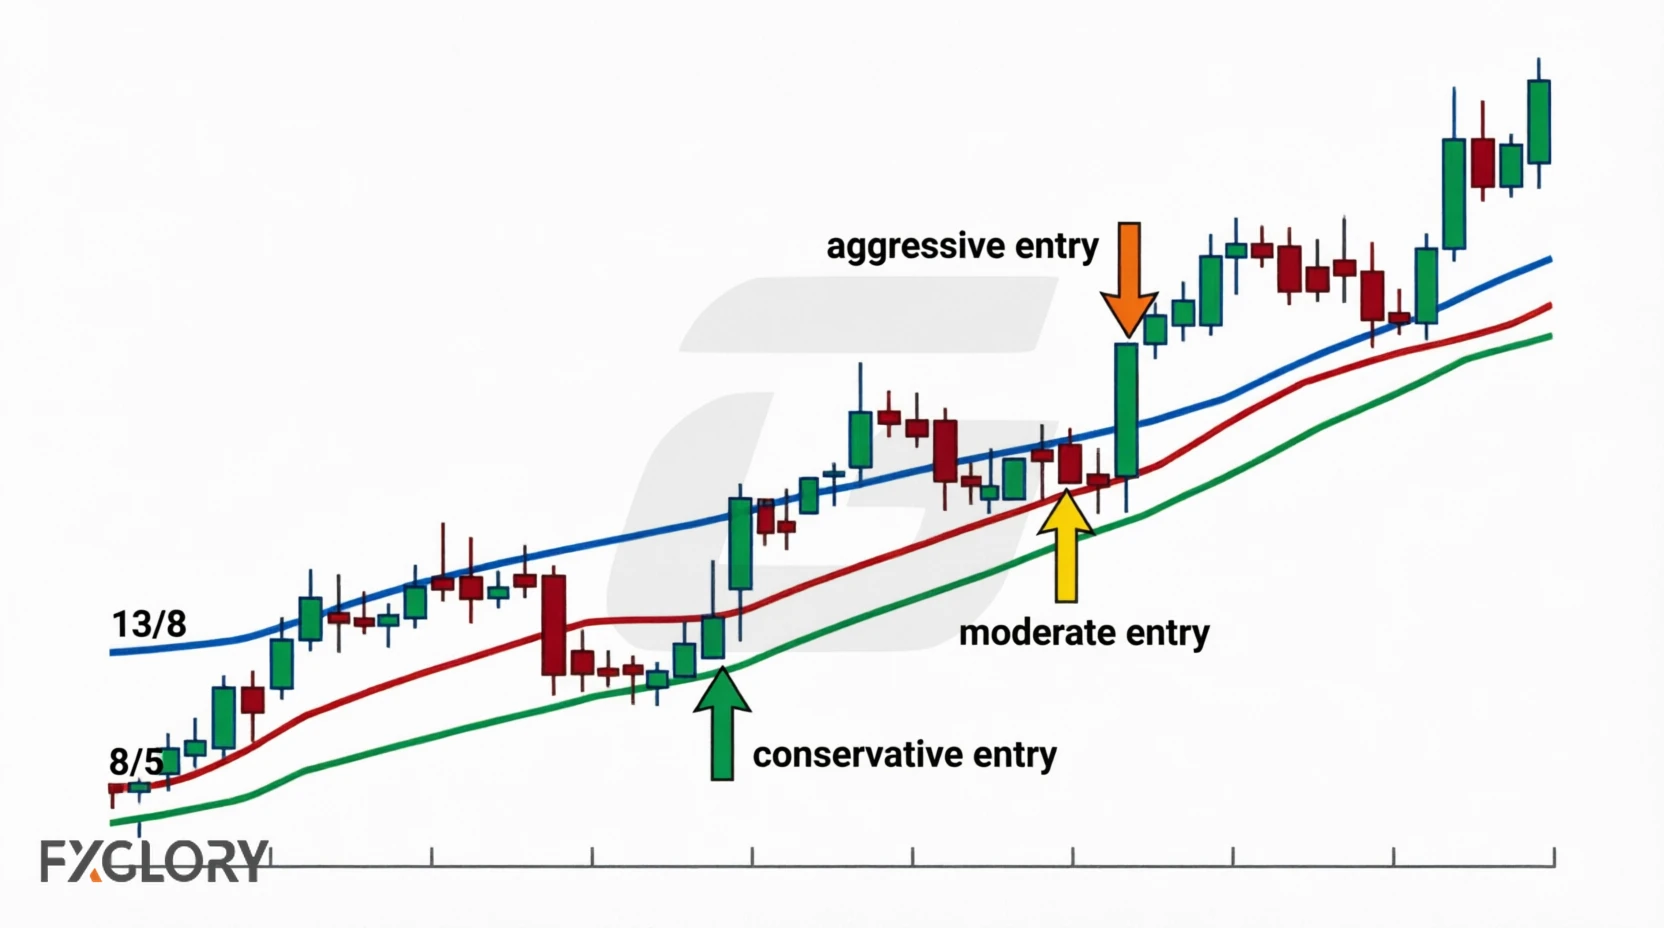
Traders sometimes use the Jaw, Teeth, or Lips as different confirmation points. These are entry styles to test, not established risk rankings, and their performance can vary by instrument, timeframe, and exit method.
1. Jaw-Based Confirmation
Waiting for price to close beyond the Jaw uses the slowest Alligator line as the confirmation point. It generally produces a later signal than Teeth- or Lips-based rules, but the amount of price movement that has already occurred cannot be expressed as a universal pip value.
2. Teeth-Based Confirmation
A Teeth-based rule uses the middle-speed line as its confirmation point and will generally respond sooner than a Jaw-based rule under the same market conditions.
3. Lips-Based Confirmation
A Lips-based rule uses the fastest line and can respond earlier, but earlier timing does not by itself establish that the method has higher or lower risk or better or worse expectancy.
Exit Rules and a Trailing-Stop Approach
An Alligator strategy needs an explicit exit rule that can be tested consistently. Common rule ideas include:
- Primary Exit (Lips Cross Back): Close the position when the Lips (green) crosses back toward the Teeth (red). In an uptrend, this means the Lips crosses below the Teeth. In this rule set, that cross is treated as an exit condition; it does not guarantee a reversal.
- Secondary Exit (Line Convergence): Exit when the distance between Jaw and Lips decreases by 50% from its maximum. This is an alternative rule that would need separate testing because it differs from the backtest exit used below.
- Trailing Stop Method: Instead of fixed exits, trail your stop-loss just beyond the Jaw line. In an uptrend, move your stop to the Jaw line value minus the structural buffer (detailed below) after every daily close. Exit when price hits the trailing stop. A Jaw-based trailing stop may remain farther from price than a faster-line exit, so its results should be tested separately.
Stop-Loss Placement and Structural Invalidation
A stop should represent the price level at which the setup is no longer valid, not an arbitrary distance from an Alligator line. Price can trade beyond obvious swing or fractal levels before reversing, but that does not justify a universal fixed-pip buffer.
For a fractal-breakout model, one approach is to place the invalidation beyond the relevant opposing fractal or another clearly defined structure level, then allow for spread and any tested volatility or execution buffer. The resulting stop distance will vary by pair and market conditions.
Determine the stop level first, calculate the resulting stop distance second, and only then calculate position size from the account risk limit. The forex risk management strategy explains this relationship in more detail. The historical test below used a fixed 5-pip buffer as a model assumption; that value should not be treated as a general live-trading recommendation.
Timeframes and the Forward Shift
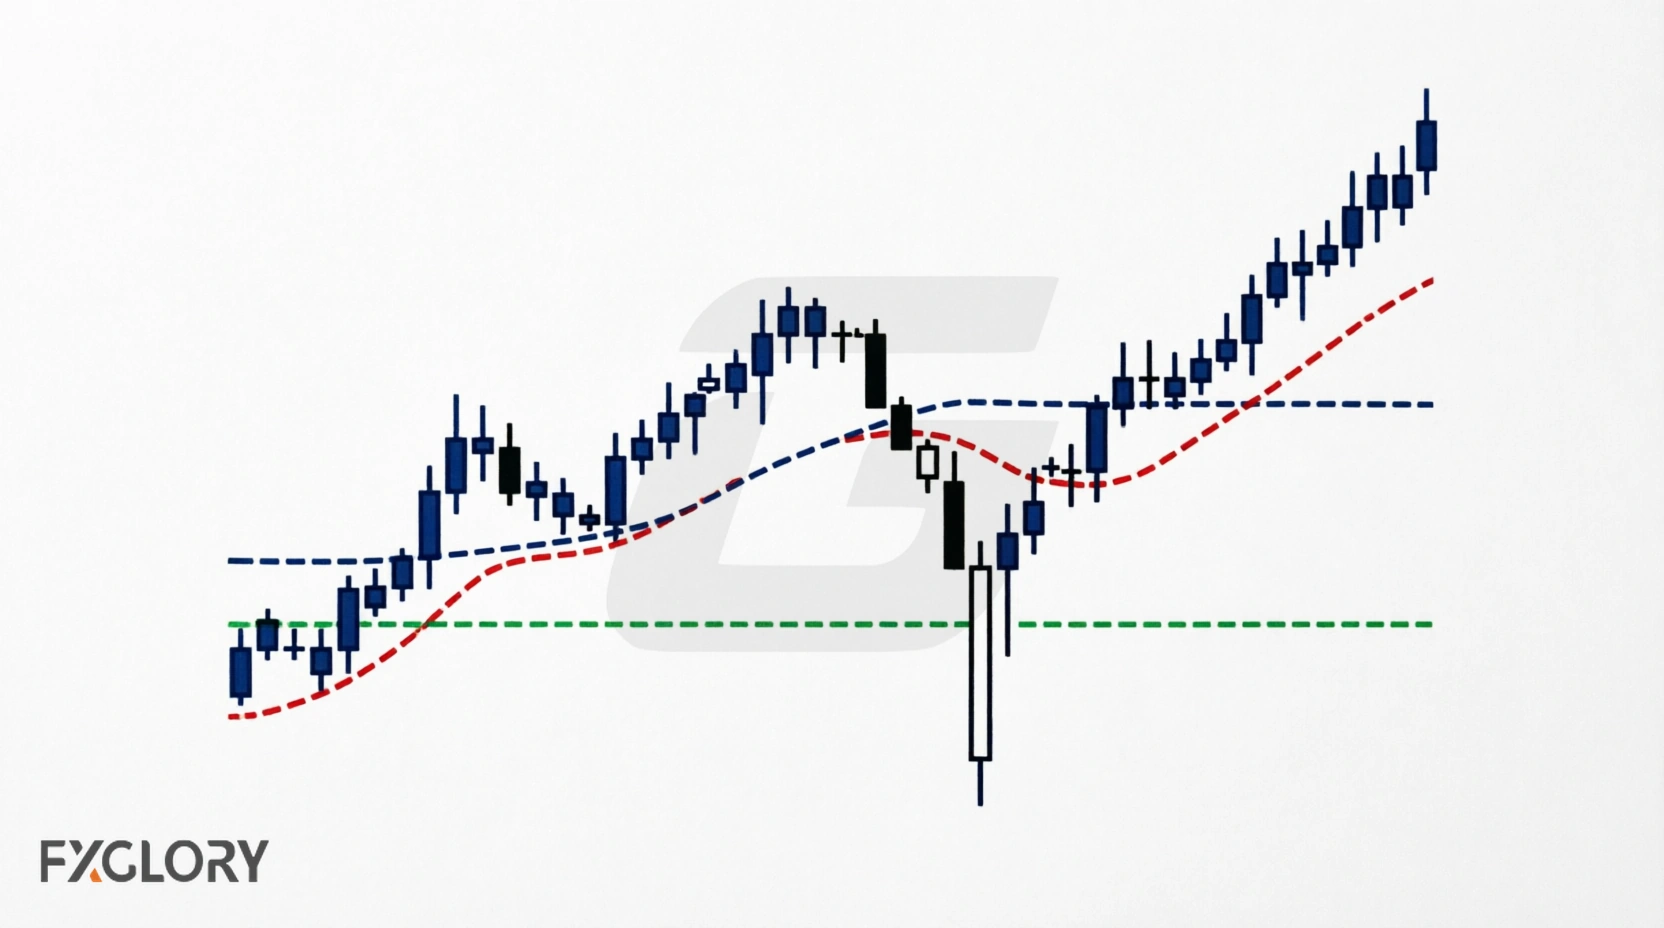
The Alligator can be applied to different chart timeframes. Its 3-, 5-, and 8-bar shifts represent different amounts of clock time on each chart, while signal quality also depends on volatility, spread, liquidity, and the exact rules being tested.
| Timeframe | 8-Bar Shift (Jaw) Represents | Considerations |
|---|---|---|
| Weekly (W1) | 8 Weeks (2 Months) | Very slow signal frequency; an 8-bar Jaw shift spans eight weekly bars. |
| Daily (D1) | 8 Days | An 8-bar Jaw shift spans eight daily bars. The historical test on this page uses Daily data. |
| 4-Hour (H4) | 32 Hours (1.3 Days) | An 8-bar Jaw shift spans 32 hours. Performance should be tested separately from the Daily model. |
| 1-Hour (H1) | 8 Hours | An 8-bar Jaw shift spans eight hours. Shorter horizons may increase sensitivity to noise and trading costs. |
| 15-Min (M15) | 2 Hours | An 8-bar Jaw shift spans two hours. This page provides no backtest establishing whether the timeframe is suitable or unsuitable. |
Timeframe takeaway: The bar shift itself does not establish a minimum usable timeframe. Shorter charts can be noisier and more sensitive to spread and slippage, so lower-timeframe use should be evaluated with instrument-specific backtesting and the current conditions and rules for the trading account.
Backtesting the Alligator Strategy
Manual chart review can introduce hindsight and selection bias. A reproducible backtest therefore needs explicit rules for line separation, entries, exits, costs, and invalidation:
- Define 'sleep phase' as all three lines within 15 pips of each other (daily).
- Define 'awakening' as Lips crossing beyond both Teeth and Jaw with minimum 10-pip separation.
- Execute entry only on a Fractal breakout confirmed by the Awesome Oscillator (AO).
- For this historical model, apply the tested fixed 5-pip buffer plus assumed spread beyond the Fractal. Treat this as a backtest parameter, not a universal stop rule.
- Exit when Lips crosses back toward Teeth.
Educational Backtest: Alligator + Fractals + AO Across Six Pairs (2014–2024)
The following results were generated from yfinance public research data using the mechanical rules described above. The data source was public research data, not FXGlory broker execution data.
Combined Metrics — All Pairs, All Sensitivity Runs
| Metric | Alligator + Fractals + AO Model |
|---|---|
| Trades (all sensitivity runs) | 5,256 |
| Win rate | 33.20% |
| Average win | +1.99R |
| Average loss | -0.86R |
| Expectancy | +0.088R |
| Profit factor | 1.15 |
| Max drawdown | -96.89R |
| Worst losing streak | 14 trades |
| Avg holding period | 8.93 days |
Pair-Level Comparison
| Pair | Trades | Win Rate | Expectancy | Profit Factor |
|---|---|---|---|---|
| EURUSD | 864 | 34.72% | -0.008R | 0.99 |
| GBPUSD | 927 | 33.01% | -0.041R | 0.92 |
| USDJPY | 819 | 36.75% | +0.191R | 1.35 |
| AUDUSD | 936 | 25.00% | -0.035R | 0.95 |
| USDCAD | 990 | 33.03% | -0.029R | 0.95 |
| USDCHF | 720 | 38.47% | +0.575R | 2.09 |
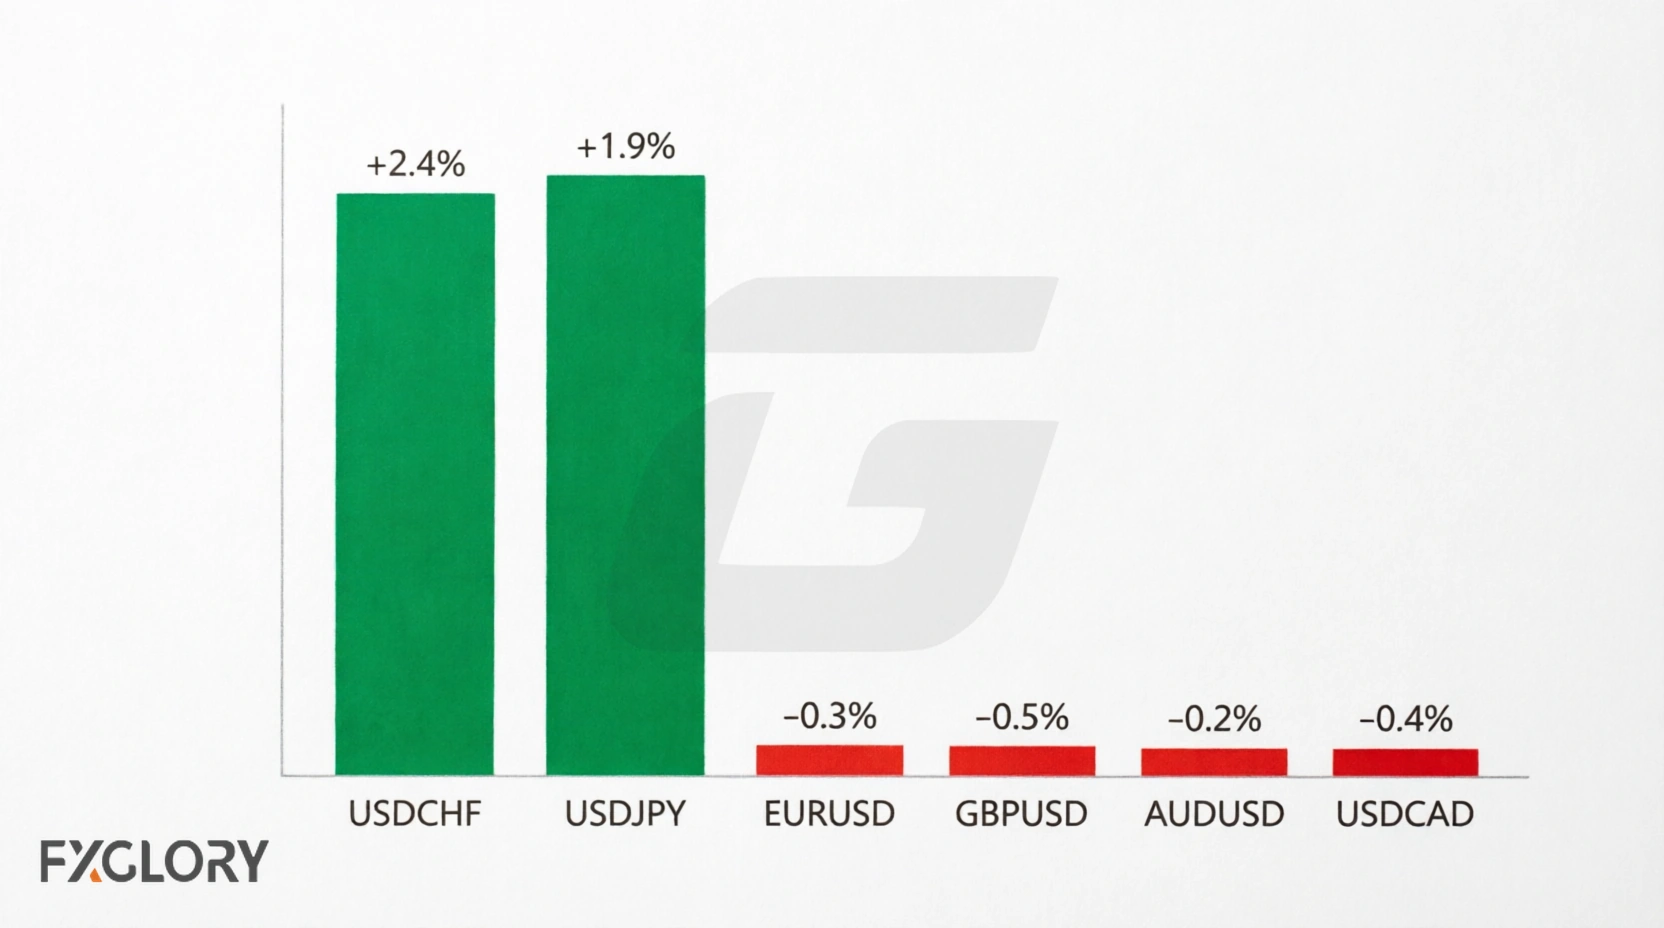
Four findings from this historical test deserve attention:
1. Combined expectancy was positive, but modest. Across the combined sensitivity runs, expectancy was +0.088R and profit factor was 1.15. The 33.2% win rate was offset by a larger average win (+1.99R) than average loss (-0.86R). These figures describe the tested historical rules and do not prove live profitability.
2. Pair-level results varied materially. USDCHF recorded +0.575R expectancy and a 2.09 profit factor, while USDJPY recorded +0.191R and 1.35. EURUSD, GBPUSD, AUDUSD, and USDCAD were slightly negative in this test. This is evidence about the model and dataset, not a universal ranking of currency pairs.
3. Average holding time was 8.93 days. Broker-specific swap and rollover were not included, so the test cannot show whether financing costs would preserve or erase the reported expectancy.
4. Drawdown was substantial. The combined maximum drawdown was -96.89R and the worst losing streak was 14 trades. Because R is a risk-unit measure, converting -96.89R into an account-percentage drawdown requires an explicit position-sizing and compounding model.