
What Is The Alligator Forex Indicator?
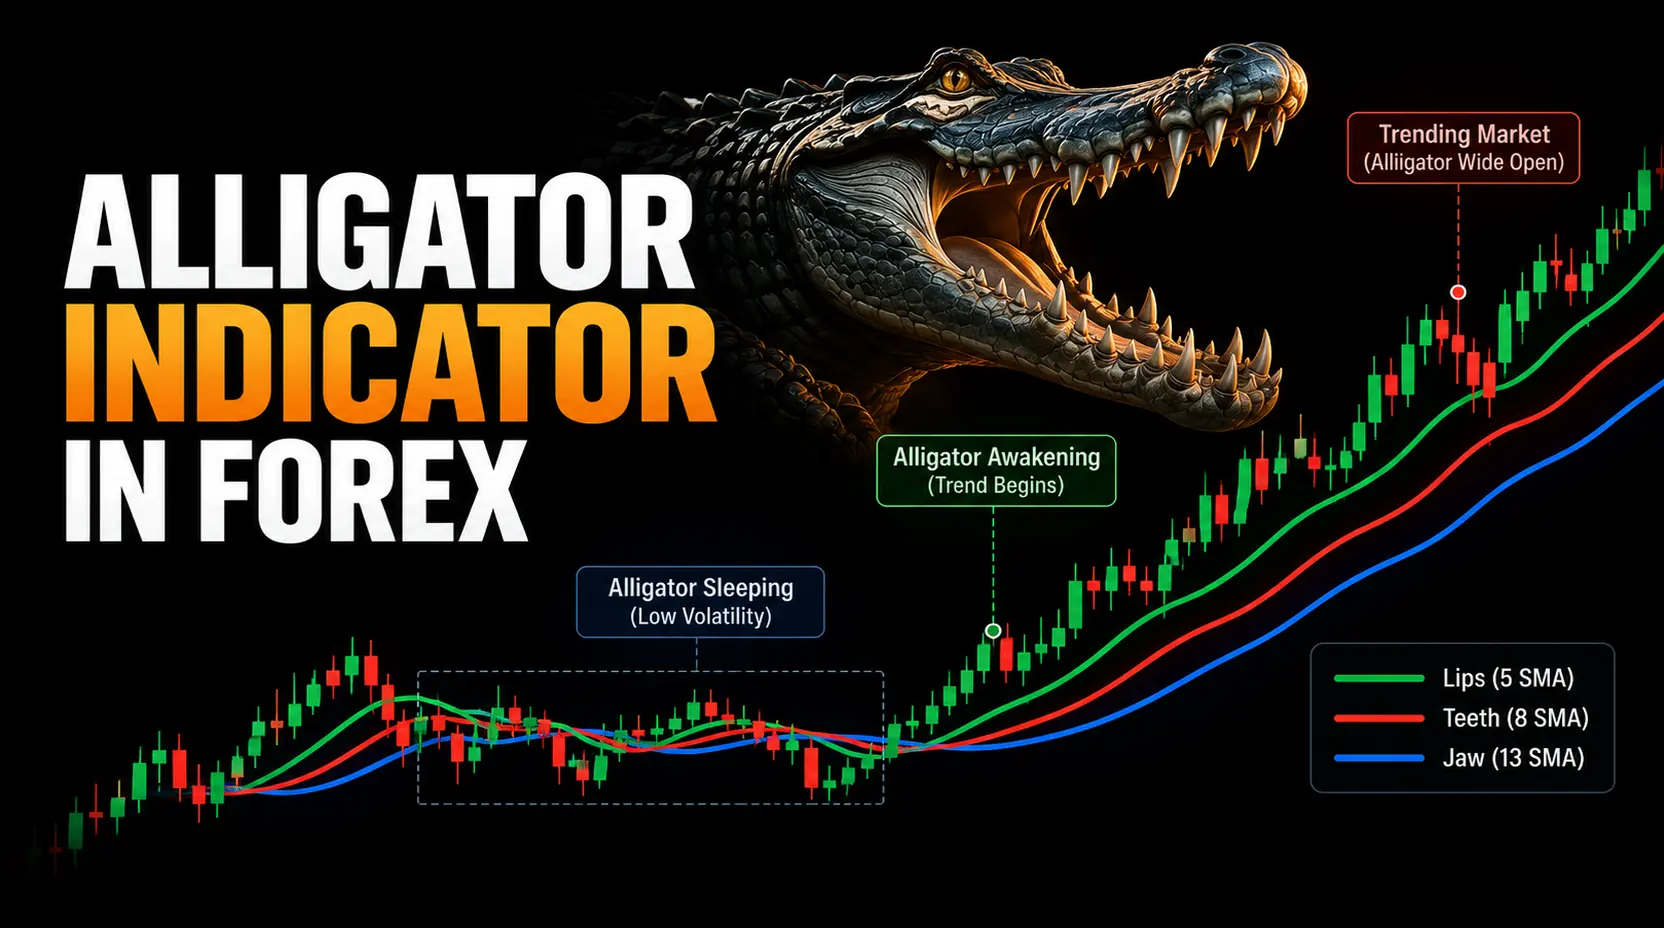
The Alligator forex indicator is a technical indicator developed by Bill Williams. It plots three smoothed moving averages on the chart and uses their position, slope, and separation to describe the market condition.
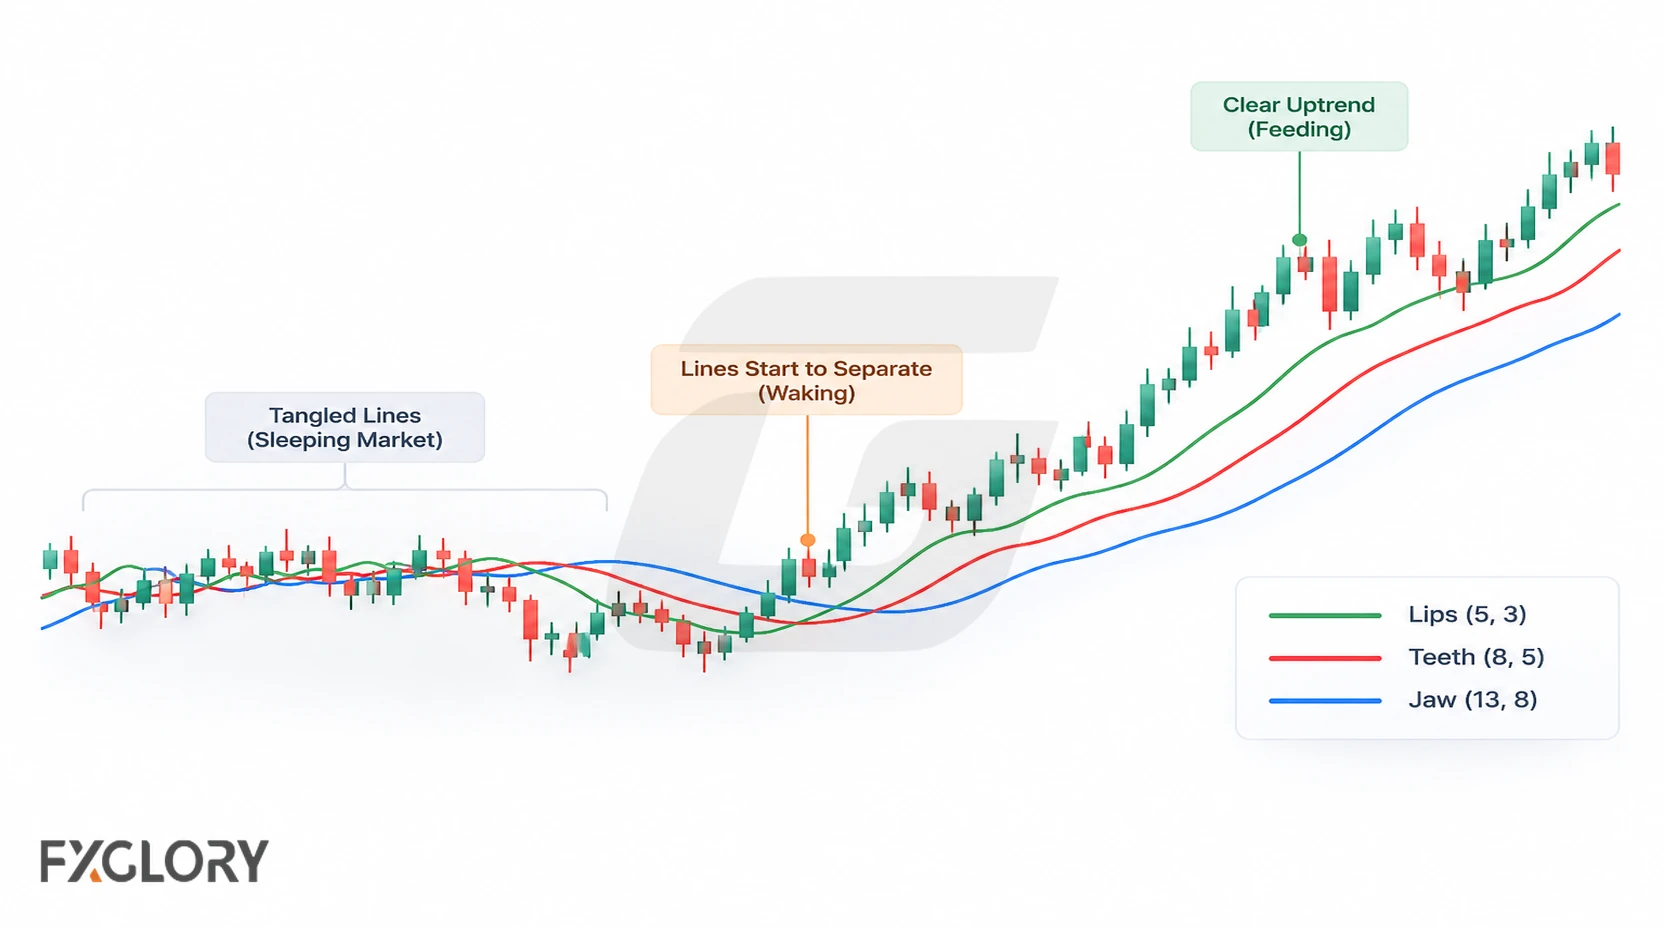
Its primary purpose is to classify the current chart environment, not to mark an exact entry. A moving-average-based reading can lag price, particularly during abrupt reversals.
The Alligator is built from smoothed averages, so it connects naturally with the way moving averages reduce price noise. The Alligator’s difference is that it turns three shifted averages into a phase-reading tool.
Jaw, Teeth, And Lips: The Three Alligator Lines
Each line smooths the median price over a different period. The shorter-period line responds more quickly to recent changes, while the longer-period line reacts more slowly.
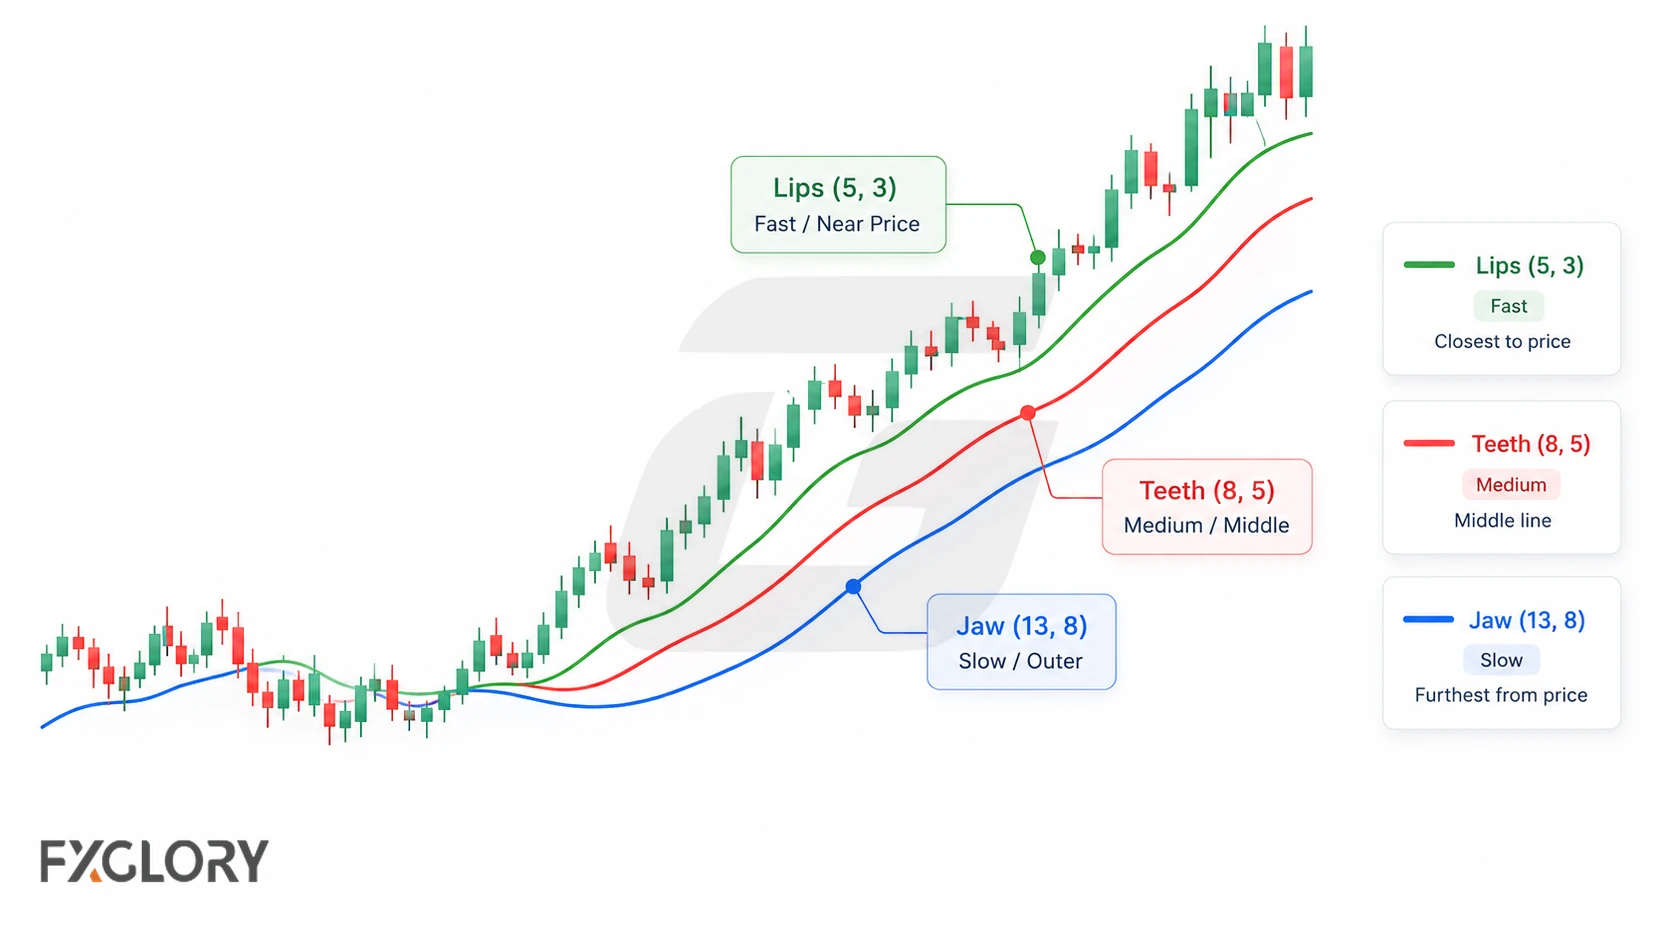
- Jaw: The slowest line, commonly shown in blue. It is usually a 13-period smoothed moving average shifted 8 bars forward.
- Teeth: The middle line, commonly shown in red. It is usually an 8-period smoothed moving average shifted 5 bars forward.
- Lips: The fastest line, commonly shown in green. It is usually a 5-period smoothed moving average shifted 3 bars forward.
These differing response speeds help show whether recent price movement is diverging from its longer-term average.
Alligator Indicator Formula And Default Calculation
The Alligator is commonly calculated from the median price of each candle:
Median Price = (High + Low) / 2
Each line uses a smoothed moving average (SMMA). After its initial average is established, a common recursive form is SMMA(current) = [SMMA(previous) × (n − 1) + Median Price(current)] / n, where n is the line’s period. Platforms may differ in initialization and handling of available history, so early values can vary.
How To Read Alligator Indicator Phases
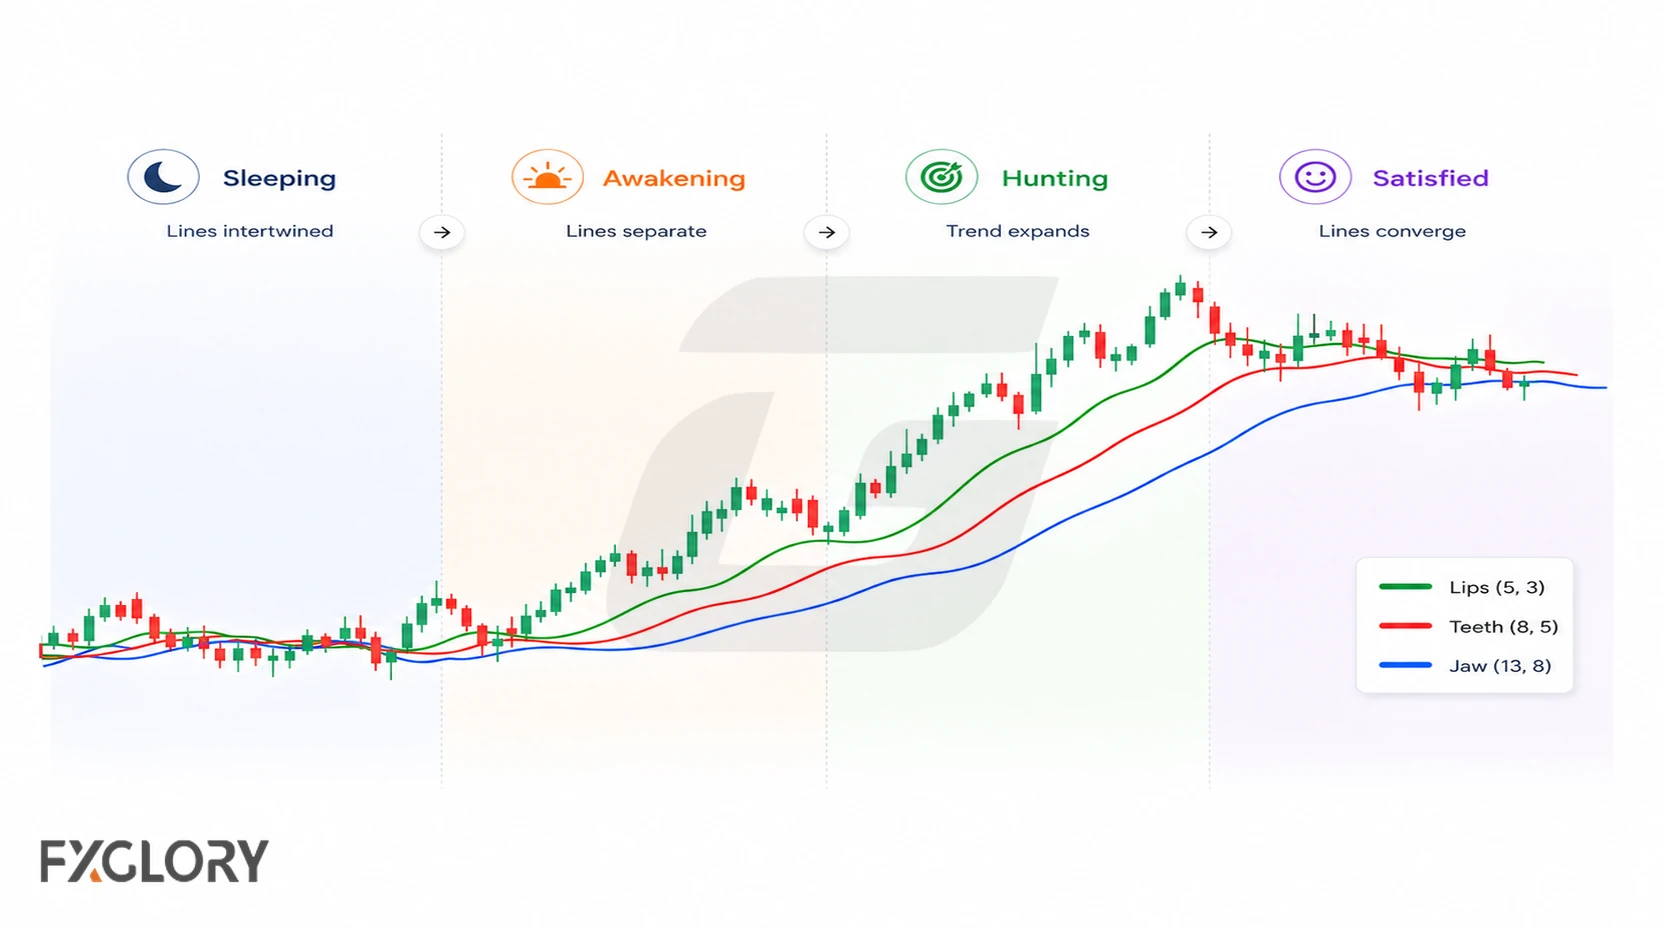
Bill Williams’s metaphor groups changing line behaviour into four phases. The table gives a quick reading; the sections below explain what each phase can and cannot establish.
| Alligator phase | What the lines show | How to read it |
|---|---|---|
| Sleeping | Lines are flat, compressed, or tangled | The chart may be range-bound; trend-following entries are usually weaker. |
| Waking | The Lips move away first, then the Teeth and Jaw begin to turn | A new move may be forming, but price confirmation is still needed. |
| Feeding | Lines are ordered, separated, and sloping in one direction | The trend condition is clearer, so continuation plans become easier to evaluate. |
| Sated | Lines narrow, flatten, or cross back together | The move may be weakening, pausing, or returning to a range. |
Sleeping Alligator: Range Or No-Trade Condition
Compression is particularly easy to misread around a choppy range boundary: several small crosses may occur without a sustained price break. A trend-following method can treat this as a filter against entry rather than trying to trade every crossing.
Waking Alligator: Early Trend Formation
The Alligator begins to wake when the Lips move away from the other lines and the Teeth and Jaw begin turning in the same direction. This can happen after a quiet range, a breakout attempt, or a shift in price pressure.
The key distinction is between emerging line separation and a price move that has actually cleared the recent range. These events need not occur on the same candle.
Feeding Alligator: Active Trend Condition
The Alligator is feeding when the lines are separated, ordered, and sloping in the same direction. In an uptrend, the Lips are usually above the Teeth, and the Teeth are above the Jaw. In a downtrend, the order is usually reversed.
An established alignment can help frame pullbacks in the prevailing direction, but it does not reveal the remaining distance or duration of the trend.
Sated Alligator: Trend Weakening
Renewed convergence can occur during a pause as well as a genuine reversal. For an existing position, treat it as a reason to review price structure and the strategy’s predefined exit conditions—not as a mandatory exit signal.
Bullish And Bearish Alligator Signals
Bullish and bearish alignment describe directional context. Neither alignment is an order to trade: the chosen strategy still needs a price-based trigger and an invalidation rule.
Bullish Alligator Signal
In bullish conditions, check whether the shorter average leads the others and whether price is sustaining a move above recent structure.
- Line order: Lips above Teeth, Teeth above Jaw.
- Line behavior: The three lines separate and slope upward.
- Price behavior: Price breaks higher, holds above the lines, or pulls back without breaking the structure.
- Invalidation: Price closes back through the lines and breaks the structure that supported the setup.
Bearish Alligator Signal
In bearish conditions, the ordering reverses; look separately for evidence that price is holding below a meaningful level.
- Line order: Lips below Teeth, Teeth below Jaw.
- Line behavior: The three lines separate and slope downward.
- Price behavior: Price breaks lower, stays below the lines, or retests the Alligator without reversing the structure.
- Invalidation: Price closes back above the structure and the lines lose bearish order.
How To Use The Alligator Indicator In Forex
Use the phase reading as an initial filter, then make the trade decision from price and predefined rules rather than counting indicator crosses.
- Identify the environment: Is this a range, a possible breakout, or an established trend? Compare the Alligator phase with recent swing highs and lows.
- Choose a price trigger: Specify the close, break, retest, or pullback reaction that would justify an entry.
- Mark invalidation: Identify the market structure that would disprove the setup, before determining stop placement.
- Size the position: Use the selected stop distance, instrument pip or contract value, and the account-risk limit.
- Plan the exit: Define the price-based exit or management rule in advance; treat changing Alligator lines as context for review.
Alligator Forex Strategy Example
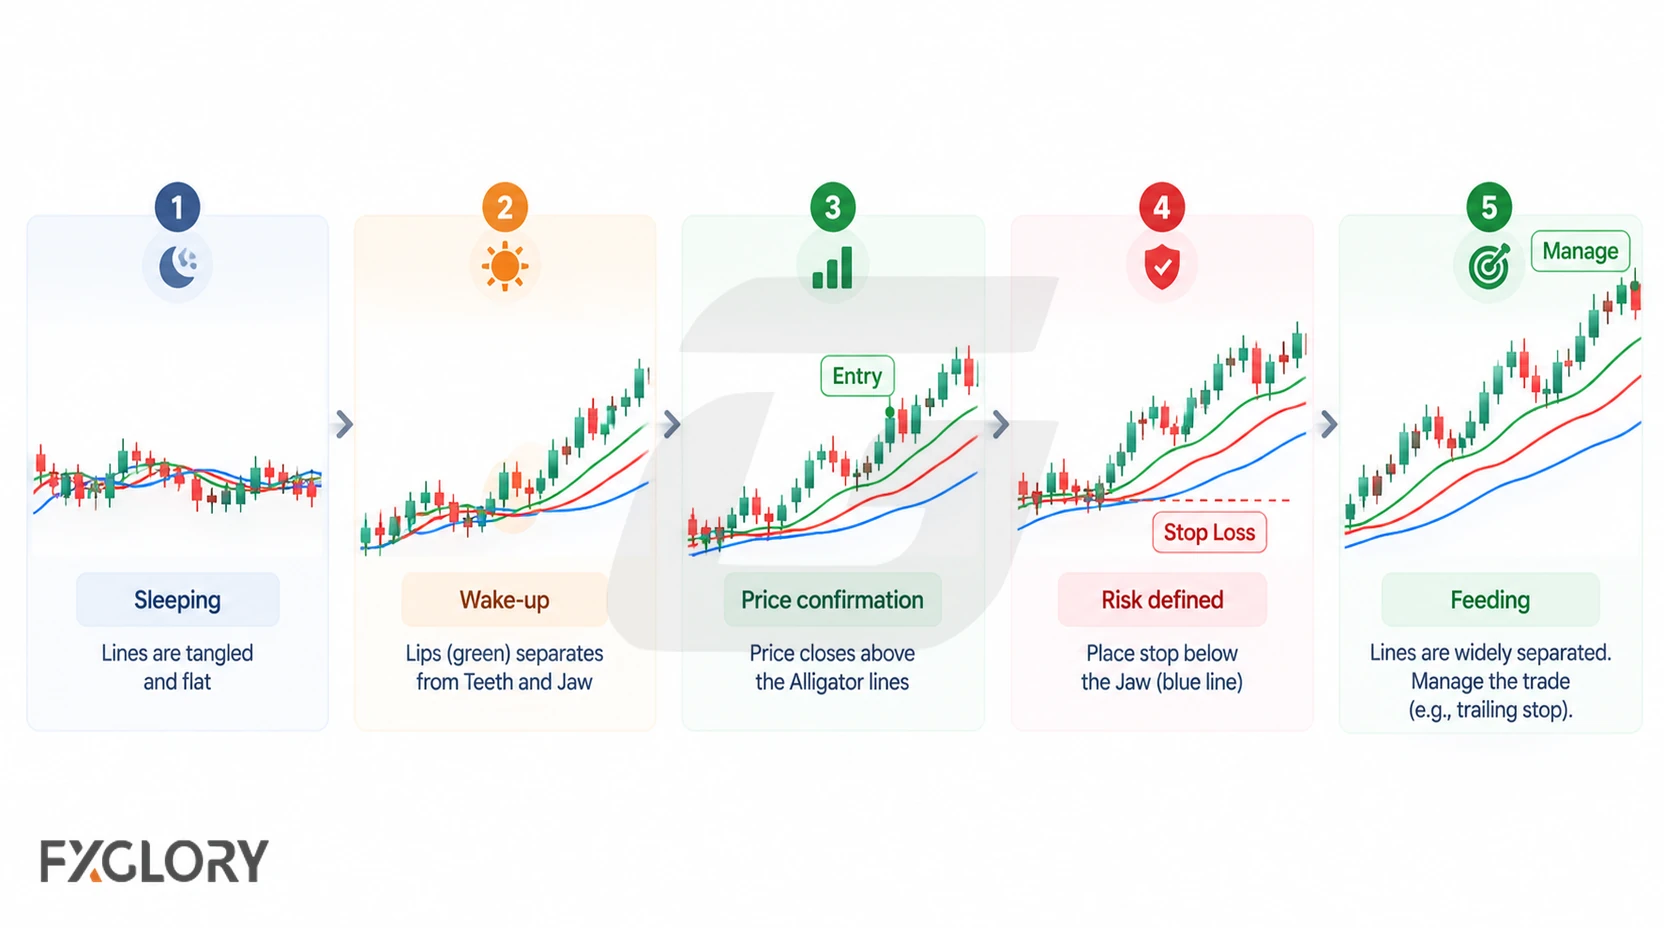
Consider this hypothetical sleeping-to-feeding sequence as a chart-reading example, not a tested system or evidence of profitability.
Illustrative Range-Break Sequence
Suppose a currency pair has traded inside a visible range. The Alligator lines begin to separate as price closes above its upper boundary. A trader using a breakout method might require a subsequent hold or retest of that boundary before considering entry. If price falls back through the level that defined the breakout, the premise may no longer hold.
The intended stop should follow the method’s structural invalidation; ATR provides volatility context but cannot establish invalidation by itself. Position size then follows from the stop distance, instrument value and account-risk limit. No outcome is implied by this example.
For specific entry, filtering, management and testing rules, see the dedicated Alligator forex strategy guide.
How To Add The Alligator Indicator In MetaTrader 4
In MetaTrader 4, the Alligator is usually available under the Bill Williams indicator group. The exact menu layout can vary by platform version, but the common path is:
- Open the chart you want to study.
- Select Insert from the top menu.
- Choose Indicators.
- Open Bill Williams.
- Select Alligator.
- Review the Jaw, Teeth, Lips, shift, and color settings before applying it to the chart.
After adding the indicator, start with the default settings and study how the lines behave during ranges, breakouts, pullbacks, and trend weakening. FXGlory traders can review available platform options through the FXGlory trading platforms page.
Using The Alligator With Confirmation
The Alligator describes phase and structure. Confirmation should answer a separate question, not repeat what the Alligator already shows.
Trend Strength Confirmation
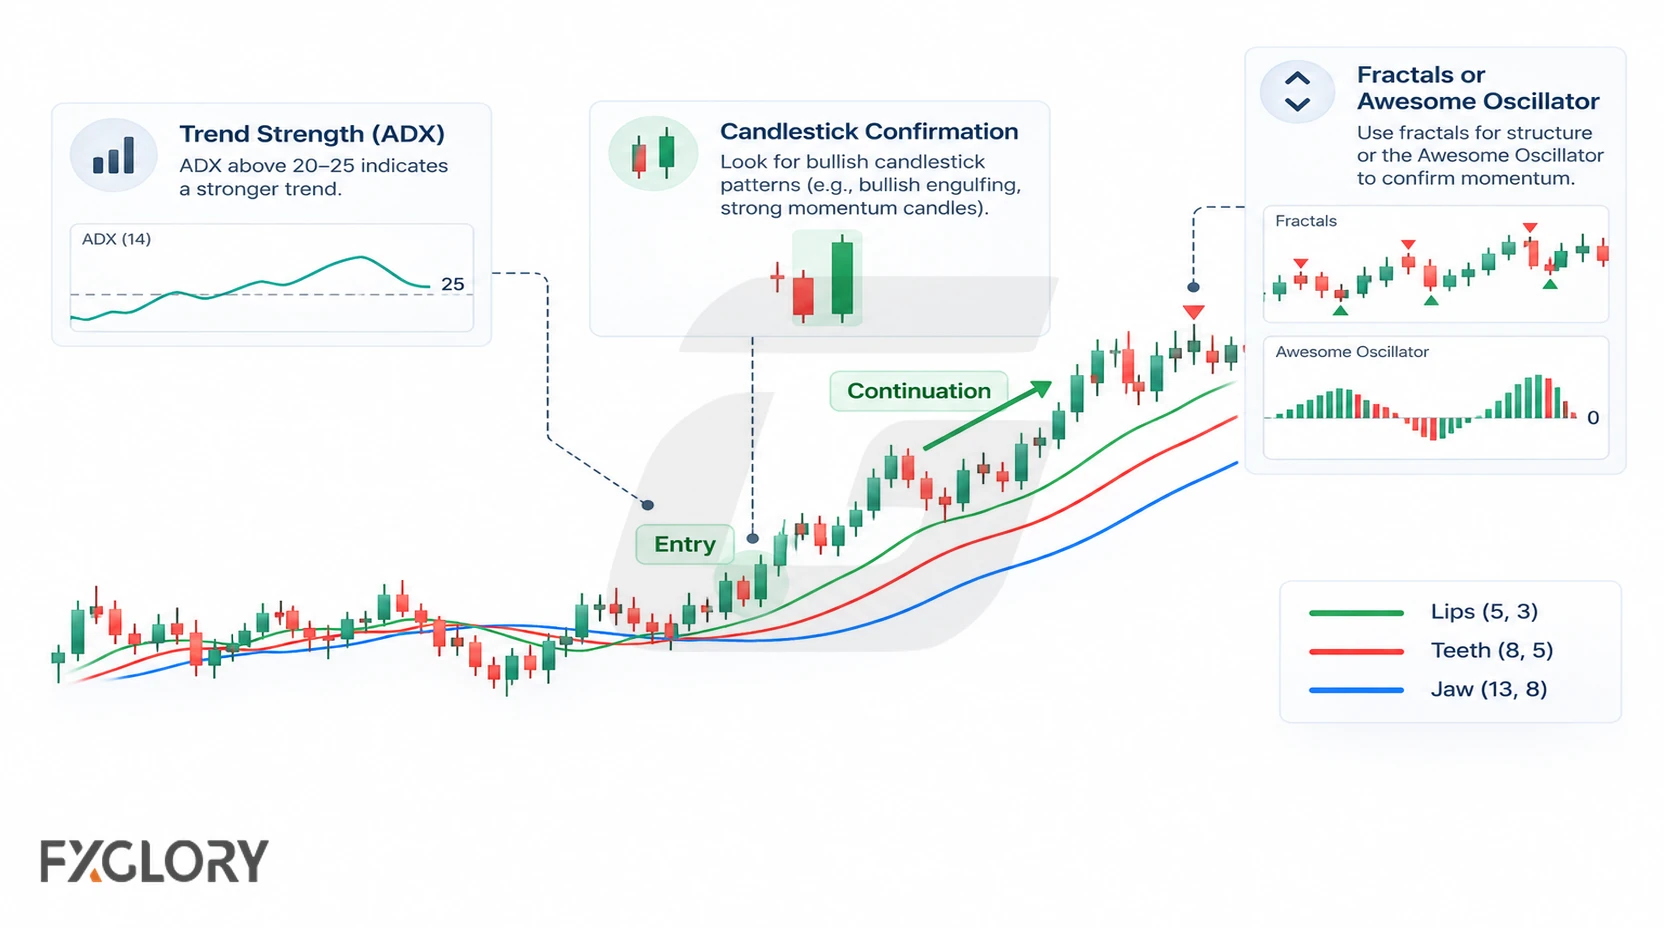
The Alligator can show direction and separation, but it does not fully measure trend strength. If strength is the missing question, traders may compare the setup with ADX as a separate trend-strength reading.
Candlestick Confirmation
Candlesticks can help refine the trigger after the Alligator has already shown a readable phase. For example, a continuation candle after a pullback may give clearer timing than a line cross alone.
Bill Williams Context
The Alligator is often studied with other Bill Williams tools such as Fractals or Awesome Oscillator. In that type of approach, the Alligator usually acts as the trend filter, while the other tool adds breakout or momentum context. Without a separate Fractals or Awesome Oscillator plan, those tools should not be added just to create more signals.
Best Timeframes And Settings For The Alligator Indicator
The indicator can be used across chart timeframes. Shorter intervals tend to display more frequent fluctuations and can make crossover-based interpretations harder to distinguish from market noise.
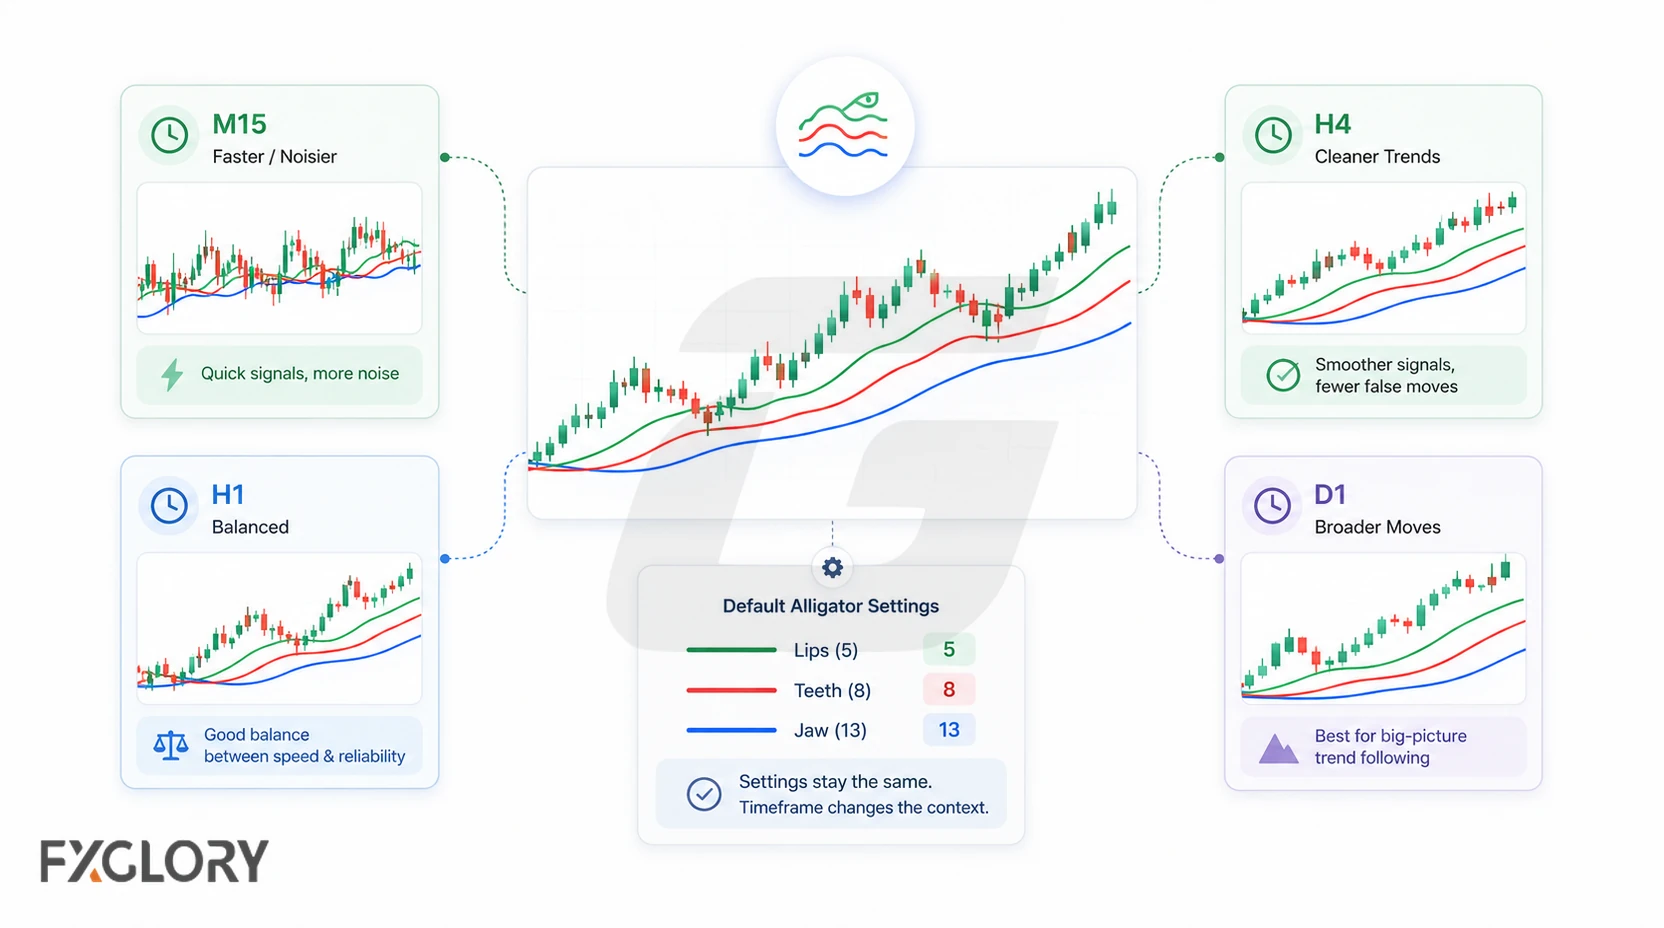
H1, H4 and daily charts are reasonable examples to study, not proven best timeframes. A shorter interval also makes spread and other execution costs more important relative to typical price movement.
Begin with the standard configuration given above. Shortening periods may reduce response delay while increasing whipsaws; lengthening them may smooth fluctuations while responding later. Compare settings on the same instrument and timeframe using a consistent, cost-aware evaluation method rather than selecting whichever produces the most crosses.
Common Mistakes And Limits Of The Alligator Indicator
The Alligator is easy to see on a chart, but it becomes unreliable when every cross is treated as a trade signal.
- Trading during the sleeping phase: Tangled lines often mean the market does not have enough direction for trend-following logic.
- Entering on the first cross: The Lips can cross the other lines inside a range without a real trend forming.
- Ignoring price structure: Indicator direction is weaker when support, resistance, or recent swings disagree.
- Chasing after a long feeding phase: Wide line separation can show a trend, but it can also mean the move is already extended.
- Using it without invalidation: A setup is incomplete if the trader cannot explain where the idea is wrong.
- Forgetting news and volatility: Sudden market events can overpower a clean indicator structure.
Underlying limitation: Smoothed averages respond to past prices, so even visually orderly lines can lag a sharp reversal. The indicator cannot establish a breakout’s probability or replace a tested entry and risk-management method.
Final Thoughts On The Alligator Forex Indicator
The Alligator offers a visual way to track changes in trend conditions, but its smoothing and plotting shifts require careful interpretation. Use it to frame the market environment; judge entries and exits with explicit price-based rules whose costs and risks you understand.