

What Is A Forex Momentum Strategy?
A forex momentum strategy is a rule-based method that studies whether price movement has enough strength and persistence to continue. Momentum can appear during a trend, after a breakout, during a session surge, after a news-driven move, or when one currency is consistently stronger than another.
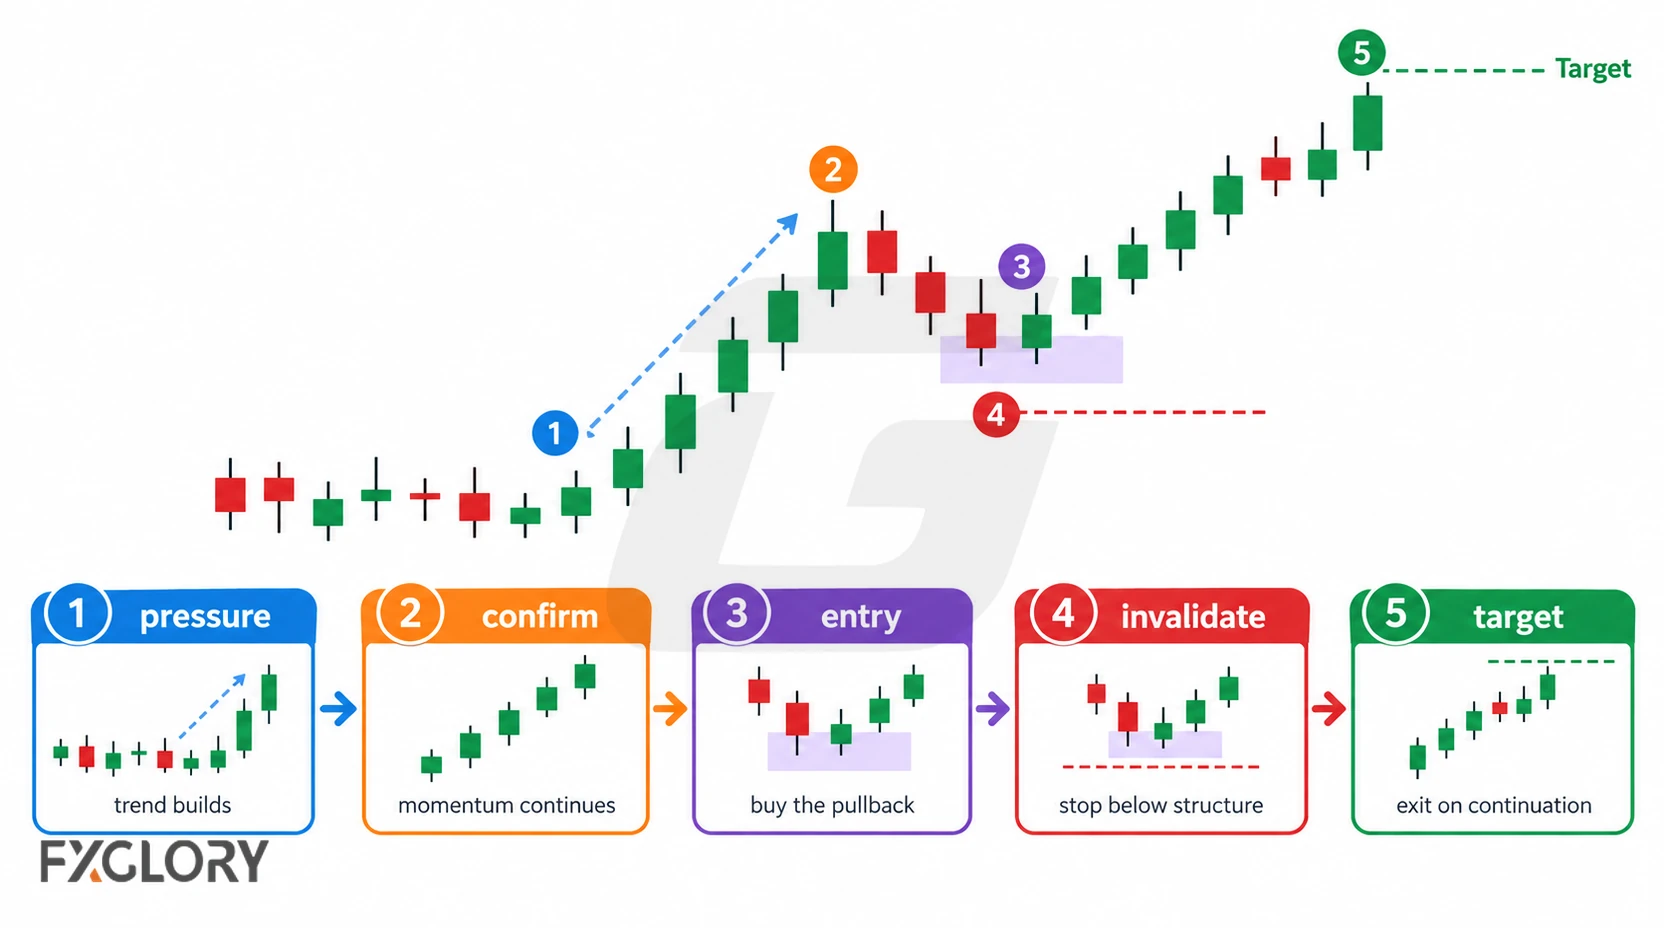
This page covers momentum as the main decision factor: how strong the move is, whether it is continuing or fading, and whether the entry is early enough to define risk. Trend direction, breakout structure, and indicators can support the idea, but the momentum setup must still define where the trade is wrong.
Momentum Strategy vs Trend Trading vs Breakout Trading
Momentum overlaps with trend trading, breakout trading, and indicator strategies, but it has a different job. It measures pressure and persistence, not only direction or level breaks.
| Topic | Main Question | How Momentum Fits | Main Risk |
|---|---|---|---|
| Momentum strategy | Is the move strong enough to continue without being too late? | Focuses on pressure, acceleration, persistence, and exhaustion | Chasing after the useful entry has passed |
| Trend trading | Is price moving in a sustained direction? | Momentum can confirm or weaken the trend idea | Assuming every trend has enough current force |
| Breakout trading | Has price left a level, range, or structure? | Momentum can help judge whether the break has follow-through | Entering false breakouts or late expansion candles |
| Indicator strategy | Do technical tools support the setup? | Indicators can confirm momentum shifts or fading pressure | Letting an indicator replace structure and invalidation |
| News trading | Is the move caused by a scheduled event? | News can create momentum, but also unstable spreads and slippage | Treating event volatility as clean momentum |
Use trend structure before momentum confirmation when the setup depends on a larger directional move. Use breakout rules when momentum begins after price leaves a defined level.
Momentum vs Chasing
A momentum setup is not the same as buying or selling after a fast candle. Before entry, specify the trigger (including whether a completed candle is required), the structural invalidation price, entry-to-stop distance, and the distance to the next marked obstacle. Compare potential reward with stop distance and estimated costs, then size the position to the chosen account-risk limit. A closer stop or a retest is not automatically a better trade.
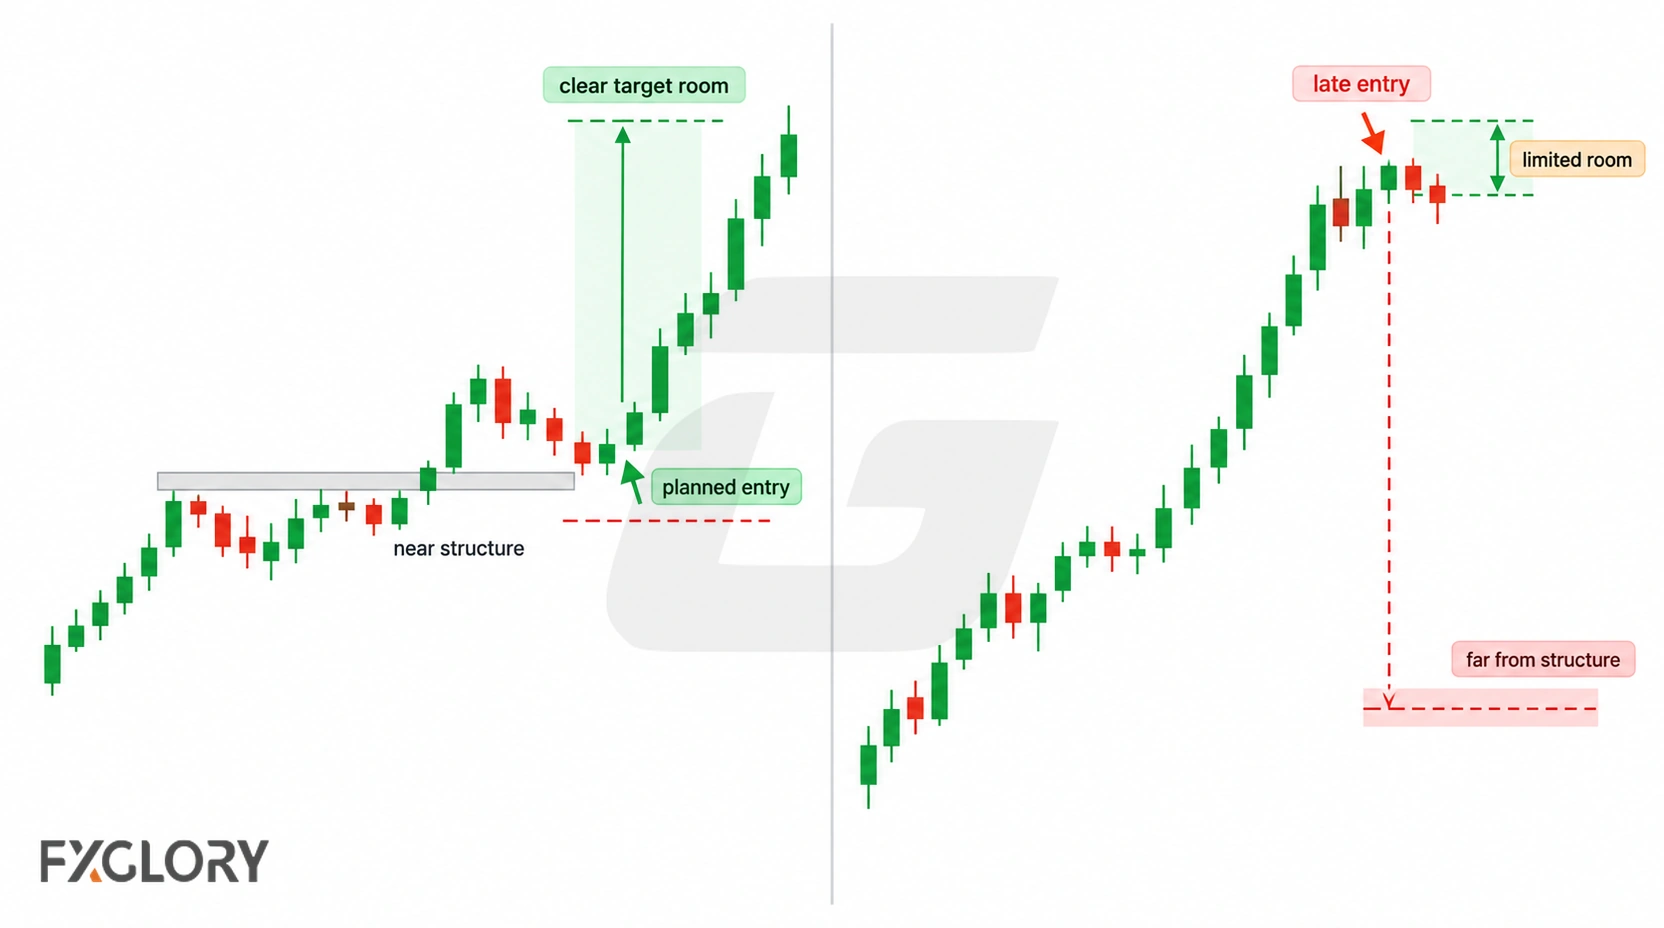
| Question | Planned Momentum Setup | Chasing Risk |
|---|---|---|
| Where is price? | Near a planned level, pullback, retest, or continuation area | Far from structure after the obvious move |
| Where is invalidation? | Stop distance and position size fit the pre-set account-risk limit | Wide stop requires smaller size or leaves poor reward relative to risk |
| Where is the target? | There is room before the next support or resistance area | The next obstacle is already close |
| What observable context supports the idea? | Premarked structure, a completed breakout, or continuation after a pullback | Unplanned news spike, spread expansion, or emotional candle chase |
| What cancels the idea? | Structure break, failed retest, momentum fade, or exit rule | No defined cancellation point |
A fast candle is a possible observation, not a stand-alone entry trigger. If the stop is far behind the proposed entry or the next obstacle leaves insufficient room after costs, skip that particular setup.
What Counts As Momentum In Forex?
Momentum can be seen in several ways. The trader should define which type of momentum is being used before entry, because candle strength, indicator momentum, and currency-strength ranking are not the same signal.
| Momentum Evidence | What It Shows | Weak Use |
|---|---|---|
| Large directional candles | Large net price movement within the measured candle | Entering after the candle is already far from invalidation |
| Consecutive closes in one direction | Successive completed closes showing directional progress | Ignoring the next major level or exhaustion risk |
| Breakout with follow-through | A completed break followed by price holding beyond the marked level | Treating a wick through the level as confirmation |
| Pullback that holds structure | Momentum may be pausing instead of reversing | Buying or selling before the pullback confirms continuation |
| MACD, RSI, ADX, or ROC | Indicator-based momentum context | Using indicator movement as the only reason for a trade |
| Currency strength comparison | One currency or pair is outperforming another | Ignoring spread, swap, correlation, and rebalancing cost |
Momentum Continuation vs Momentum Exhaustion
Continuation and exhaustion can look similar in a single strong candle. A break followed by completed closes holding beyond a premarked level provides different evidence from an extended move reaching major support or resistance after several candles. Neither observation determines the next move.
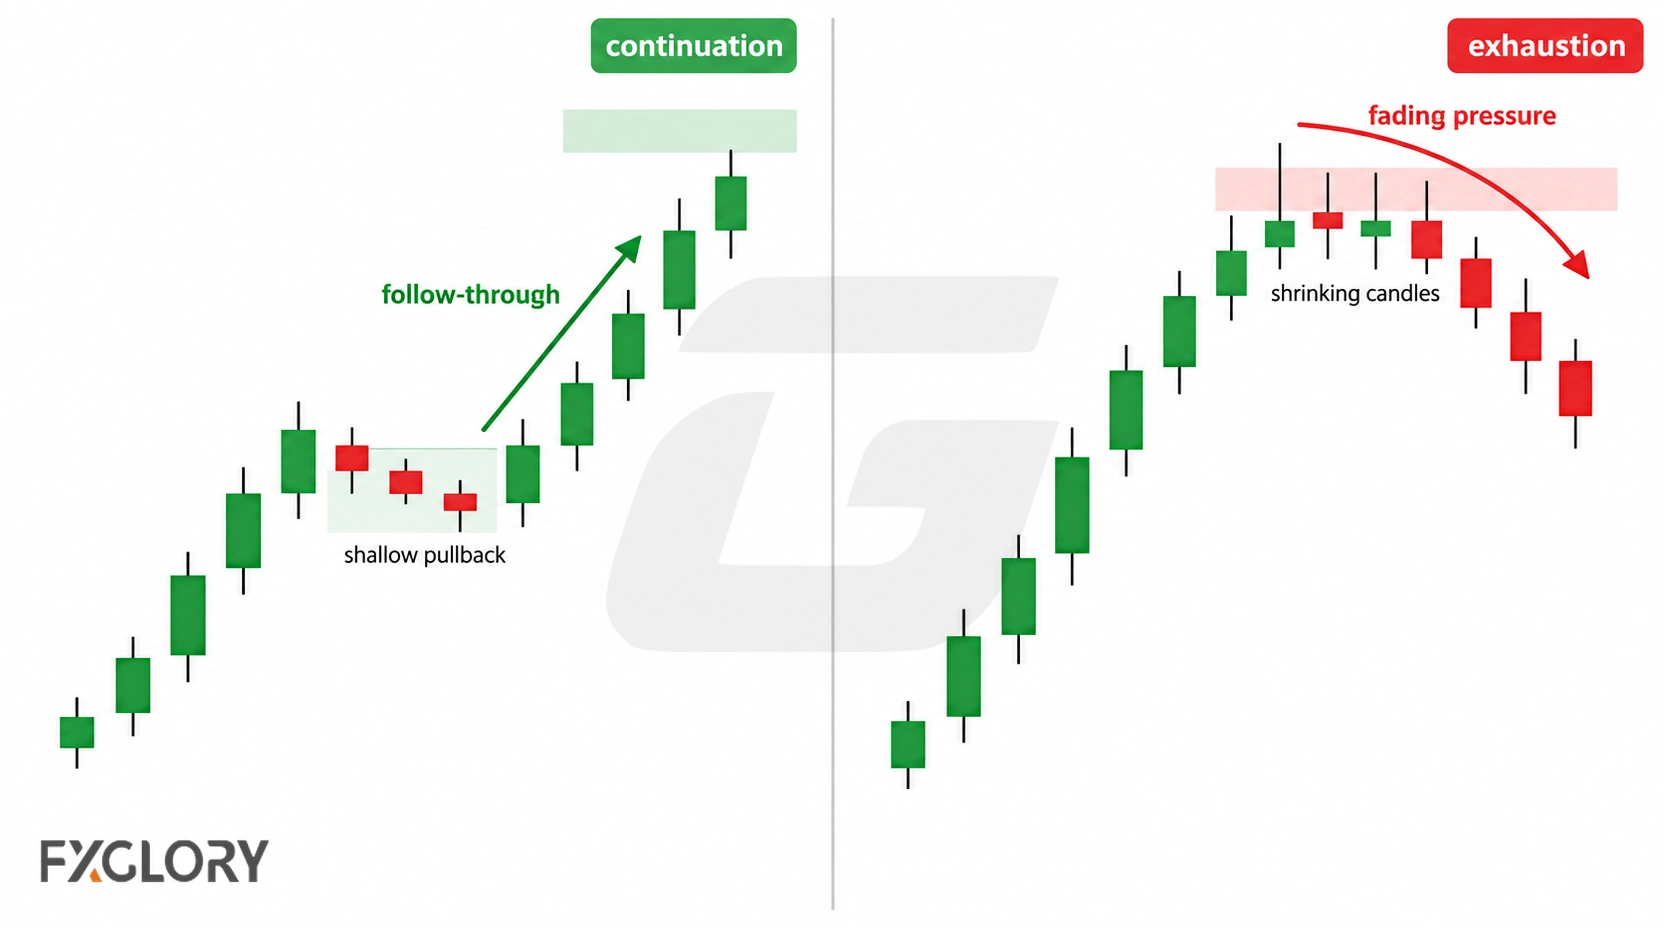
| Condition | Continuation Clue | Exhaustion Warning |
|---|---|---|
| Price location | Move begins from a clear level, breakout, or pullback area | Move is already near a major support or resistance obstacle |
| Candle behavior | Closes show acceptance beyond structure | Long wicks, shrinking bodies, or failed follow-through appear |
| Pullback behavior | Retracement holds structure and resumes direction | Pullback breaks the structure that supported the move |
| Indicator behavior | Momentum expands with price structure | Momentum indicator fades while price struggles to continue |
| News context | Move forms outside unstable event conditions | Move is driven by a spike, spread widening, or slippage-prone event |
Momentum vs Volatility: Not Every Fast Move Is Tradable
Momentum needs movement, but movement alone is not enough. Volatility can expand because of news, thin liquidity, stop runs, session changes, or spread widening. That can create speed without a clean structure to trade.
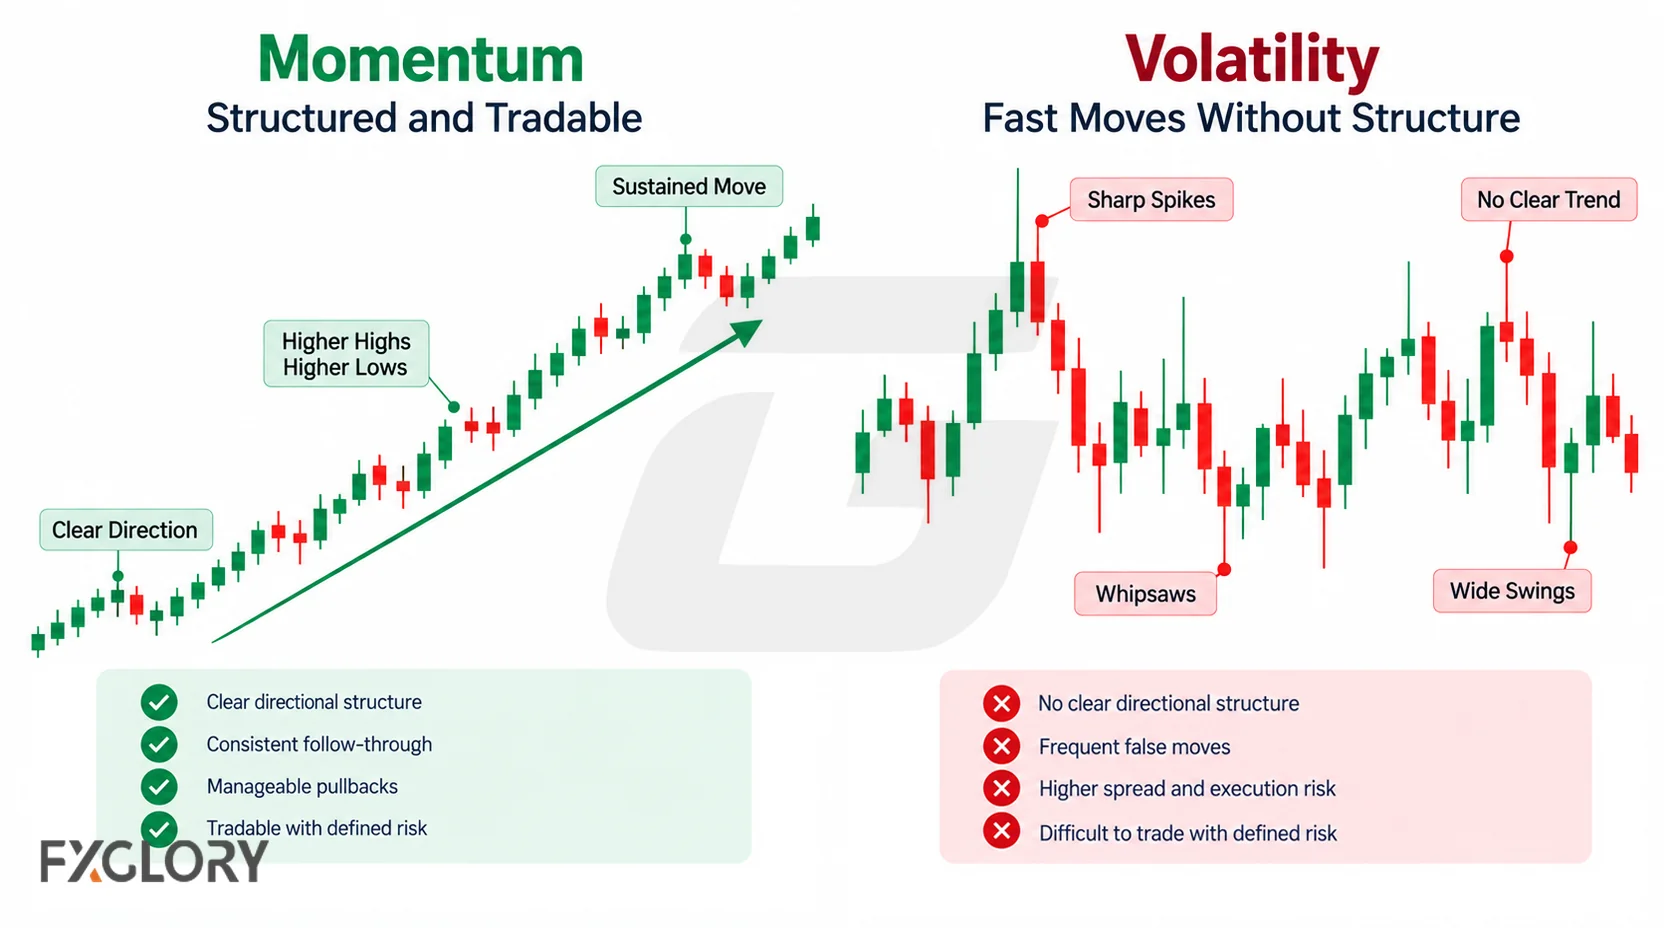
| Condition | Momentum | Volatility Without A Clean Setup |
|---|---|---|
| Direction | Movement has a clear directional bias | Price whipsaws both ways |
| Structure | Move breaks, holds, retests, or continues from a level | Move happens in the middle of unclear price action |
| Spread and slippage | Costs still allow realistic target room | Execution cost changes the trade before entry |
| News context | Event risk is planned or avoided | Price jumps without stable entry quality |
| Risk control | Stop and target can be defined before entry | Stop location is unclear or too far away |
Several large alternating candles can create substantial volatility with little net directional progress. Compare price movement over a chosen lookback with the directional sequence of completed closes; neither observation alone constitutes a trade signal.
Time-Series Momentum vs Cross-Sectional Momentum
Momentum can be reviewed in two different ways. A trader can study whether one pair is strong compared with its own past movement, or compare several currencies and pairs against each other.
| Momentum Type | Forex Meaning | Example Use | Main Risk |
|---|---|---|---|
| Time-series momentum | One pair is compared with its own past movement | Review whether EUR/USD has persistent directional pressure over a chosen lookback | Chasing late movement after the pair is already extended |
| Cross-sectional momentum | Currencies or pairs are ranked against each other | Review stronger currencies against weaker currencies | Correlation, rebalancing cost, spread, swap, and duplicated exposure |
| Single-pair chart momentum | One pair is reviewed through structure, candles, and indicators | Breakout, pullback, retest, or continuation setup | Ignoring broader currency strength or higher-timeframe obstacles |
| Portfolio-style momentum | Several positions may be selected from a ranked list | Long-short basket or periodic rotation | More transaction costs, more margin use, and more execution complexity |
Time-series momentum uses an instrument's own historical returns, while cross-sectional momentum ranks relative returns across a defined universe. Define their signals and evaluate each approach separately so its contribution is visible. A combined strategy can also be tested with different rules, provided the actual portfolio allocation, correlation, exposure, rebalancing, and transaction costs are modeled explicitly.
Forex Momentum Rule Sequence
For a price-structure momentum setup, the following order keeps observations separate from an executable trade plan. A portfolio ranking strategy also needs an explicit instrument universe and allocation procedure.
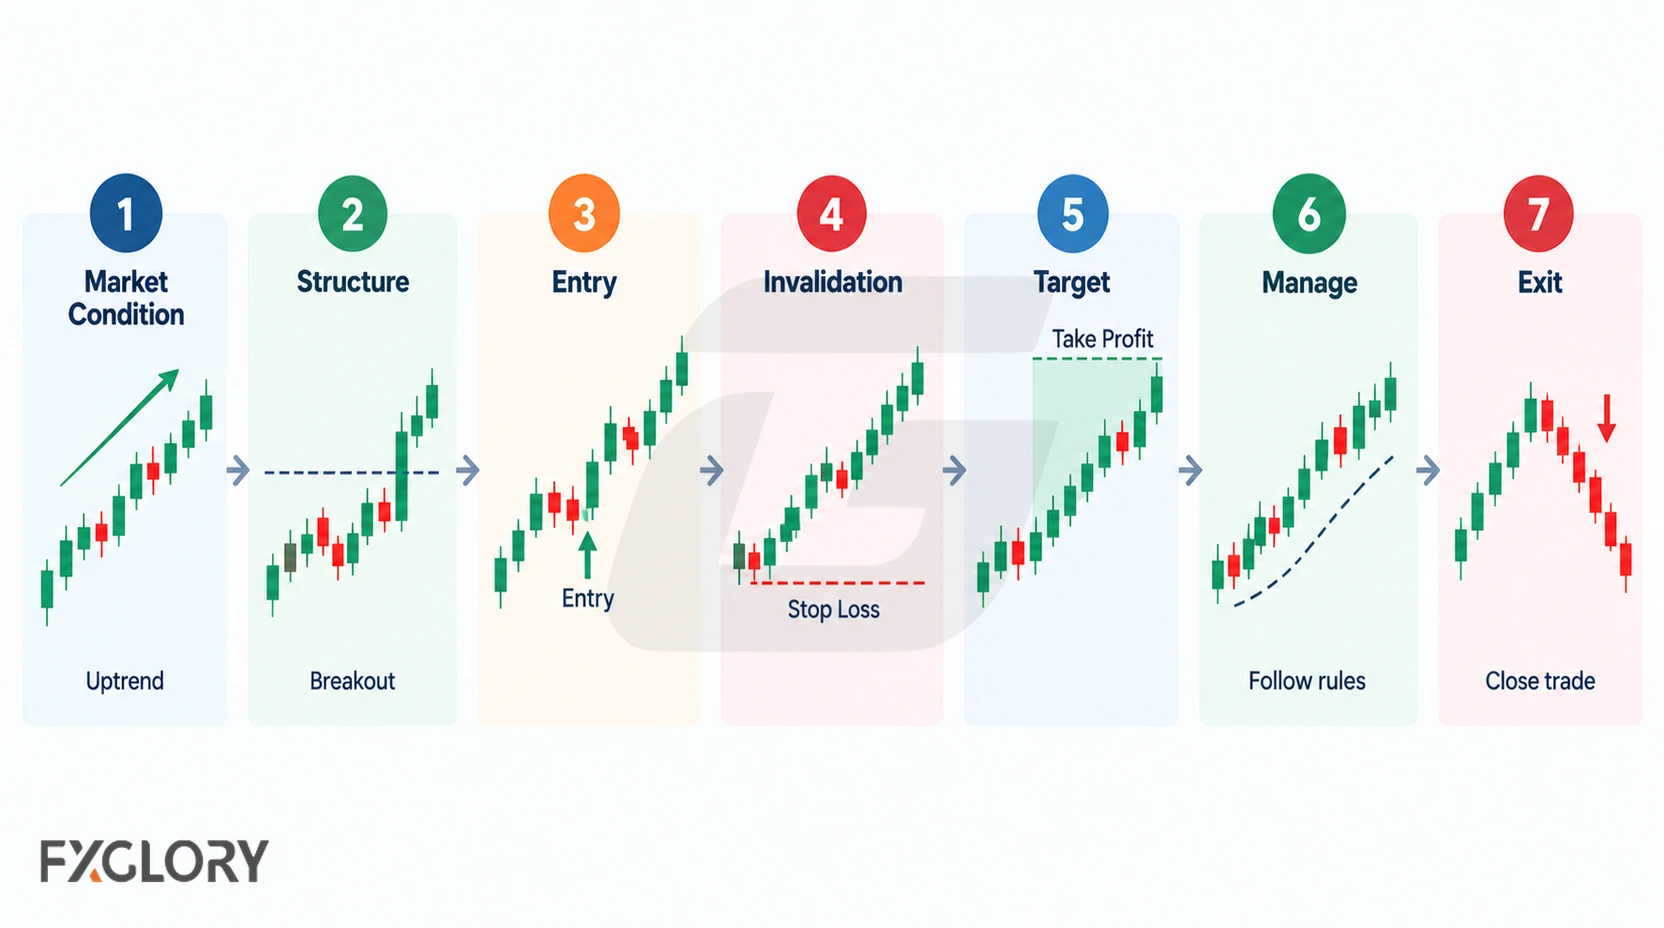
- Define the market condition: trend, breakout, pullback, range expansion, session move, or unclear.
- Identify the momentum source: price action, breakout, candle strength, indicator reading, session flow, time-series strength, or cross-sectional comparison.
- Check structure: mark support, resistance, trendline, range edge, swing point, or breakout zone.
- Check continuation vs exhaustion: decide whether the move has room to continue or is already extended into an obstacle.
- Separate momentum from volatility: reject fast movement if spread, slippage, news, or unclear structure makes the trade unmanageable.
- Wait for an entry trigger: breakout close, retest hold, pullback continuation, controlled continuation candle, or indicator-supported confirmation.
- Define invalidation: write where the momentum idea is wrong before entry.
- Measure stop and target: compare stop distance with target room after spread and slippage.
- Check trading conditions: news, spread, slippage, swap, margin, leverage, correlation, and holding time.
- Write exit rules: target, trailing logic, momentum fade, structure break, or cancellation condition.
Use position size after the momentum stop is known before testing live setups.
Forex Momentum Strategy Types And When To Use Them
Momentum is not one setup. Different momentum strategies need different entry and exit logic.
| Momentum Type | Best Used When | Main Risk | Related Rule |
|---|---|---|---|
| Trend continuation momentum | A trend has structure and current force | Trend is mature and momentum is fading | trend continuation rules |
| Breakout momentum | Price breaks a level, box, range, or consolidation with follow-through | False breakout or late entry | breakout confirmation |
| Pullback after momentum | Strong move pauses and retraces into structure | Pullback becomes reversal | pullback entry planning |
| Session momentum | Active session produces directional pressure | Move fades when session liquidity changes | session timing context |
| Indicator-confirmed momentum | Price structure aligns with MACD, RSI, ADX, MA, or ROC | Indicator signal appears without tradable structure | indicator role planning |
| Cross-sectional momentum | Stronger and weaker currencies or pairs can be compared | Correlation, spread, swap, and rebalancing risk | correlation checks |
Report breakout and pullback results separately when comparing their individual behaviour. They can be combined in a portfolio backtest with different rules, but the combined result must include their actual position sizing, simultaneous exposures, and transaction costs.
Trend Continuation Momentum
Trend continuation momentum looks for current force inside an existing trend. The trend provides direction, but momentum decides whether the trend still has pressure behind it.
- Confirm that the trend structure is still valid.
- Check whether price is making progress instead of only drifting sideways.
- Wait for a continuation trigger near structure, not far away from invalidation.
- Check whether the next support or resistance level leaves enough target room.
- Cancel the setup if momentum fades before entry or price accepts back inside the prior structure.
A trend may remain structurally intact even when its recent directional price change slows. Treat trend direction and current momentum as separate observations.
Breakout Momentum
Breakout momentum appears when price leaves a support, resistance, box, range, or consolidation area with pressure. The key question is whether price has accepted the new side of the level or only produced a temporary spike.
| Breakout Momentum Step | What To Check | Skip If |
|---|---|---|
| Level | The level or range was marked before the move | The level is drawn after the breakout candle |
| Break | Price closes beyond the area with enough target room | The candle closes directly into the next obstacle |
| Follow-through | Subsequent completed price action maintains direction beyond the broken area | Price immediately accepts back inside the old range |
| Invalidation | The stop is placed where the breakout idea fails | The stop is random or too tight for normal volatility |
A retest is a separate optional trigger, not a requirement for identifying every breakout. When the trade depends on the return to a broken level, use momentum after the retest rather than chasing the first breakout candle.
Pullback After Momentum
A pullback-after-momentum setup waits for a strong move to pause, then reviews whether price holds structure before continuation. It can sometimes provide a closer structural invalidation price than an extended-candle entry, but it is not inherently safer and still needs an explicitly defined continuation trigger.
- Do not assume every pullback is a continuation entry.
- Do not enter if the pullback breaks the structure that supported the move.
- Do not enter if the pullback entry still leaves poor target room.
- Do not add risk because the first move looked strong.
The pullback should make the trade more defined. If it does not clarify invalidation and stop placement, it has not improved the momentum setup.
Session Momentum
Session momentum can appear when market activity increases around major trading sessions or session overlap. A session move can create clean continuation, but it can also fade quickly when liquidity changes.
| Session Factor | Why It Matters | Decision |
|---|---|---|
| Active session | Directional closes and quoted trading costs can differ by pair and session | Choose the session in advance; review completed-candle progress and compare quoted spreads with that pair's observed same-session conditions |
| Session transition | Momentum can fade or reverse when activity changes | Plan exit or review before the transition |
| Spread behavior | Costs can change around less active periods | Skip if spread weakens the target |
| News near session | Momentum may be event-driven rather than structural | Use event rules before entry |
Use session timing context when the momentum setup depends on active market hours.
Momentum Indicators: MACD, RSI, ADX, Moving Averages, And ROC
Indicators can help review momentum only when each tool answers a specific question. They should not replace price structure, invalidation, or risk management.
| Indicator | Question It Helps Answer | Weak Use |
|---|---|---|
| MACD | Is momentum expanding, fading, or shifting? | Entering only because the lines cross |
| RSI | Is momentum stretched, failing, or holding strength? | Buying or selling only because RSI is high or low |
| ADX | Is trend strength present? | Treating ADX as an entry signal or direction signal by itself |
| Moving averages | Is momentum aligned with directional structure? | Entering every touch or crossover without confirmation |
| Rate of change | How fast has price changed over the lookback period? | Ignoring support, resistance, and spread cost |
| Stochastic | Is momentum stretched near a meaningful structure area? | Using overbought or oversold alone as a trade signal |
If an indicator becomes the main reason for the trade, use indicator rules before signal testing.
MACD Histogram Momentum: Useful But Not Enough
The MACD histogram is the MACD line minus its signal line. Positive bars moving farther above zero show a widening positive difference; negative bars moving farther below zero show a widening negative difference. Bars moving toward zero show the difference narrowing, regardless of whether the bars themselves are numerically rising or falling. These measurements may help review changes in a price move, but they do not independently predict its direction or establish an entry. See the MACD histogram calculation and interpretation for the underlying indicator method.
| MACD Signal | What It May Show | Why It Is Not Enough |
|---|---|---|
| Histogram magnitude increasing away from zero | MACD-to-signal-line separation is widening in the positive or negative direction | Entry may already be late if price is extended |
| Histogram moving toward zero | MACD-to-signal-line separation is narrowing | Price can still continue even while momentum slows |
| MACD line cross | A momentum shift may be forming | The cross needs structure, location, and target room |
| MACD line crossing zero | The two underlying EMAs change their relative ordering | It can lag after much of the move has happened |
| Divergence | Price and momentum may be disagreeing | Divergence can persist before any reversal occurs |
MACD should not be treated as a complete forex momentum strategy by itself. A histogram shift away from a meaningful level may be useful. A histogram signal in the middle of poor structure, into a nearby obstacle, or during unstable news conditions may be weak.
Cross-Sectional Forex Momentum: Winners vs Losers
Cross-sectional forex momentum compares currencies or pairs over a defined lookback period. The idea is to identify relative strength and weakness, such as stronger currencies against weaker currencies. This can create long-short logic, but it is more complex than a single-pair chart setup.
| Step | What It Means In Forex | Risk To Control |
|---|---|---|
| Universe | Choose which pairs or currencies are compared | Do not mix illiquid pairs without spread checks |
| Lookback | Rank recent performance over a chosen period | A short lookback can chase noise; a long lookback can lag |
| Selection | Review stronger versus weaker currencies or pairs | Correlation can create hidden concentration |
| Rebalancing | Positions may need periodic review | Frequent changes can increase spread and swap cost |
| Exposure | Long-short logic can create multiple open risks | Total margin and leverage must remain controlled |
When comparing a currency-ranking component with a single-pair signal, report their individual results before interpreting a combined portfolio. The combined run should model simultaneous positions, shared currency exposure, rebalancing, spread and swap costs.
Forex Momentum Strategy Example Flow
This is a made-up EUR/USD price example, not a historical quote, verified backtest trade, or recommendation. Assume a level was marked before the move and a completed candle closed above 1.1000. The example illustrates the arithmetic of a possible breakout plan, not the tested Donchian model below.
| Hypothetical Input | Value | What It Means |
|---|---|---|
| Trigger and entry | Breakout close above 1.1000; assumed fill at 1.1005 | A completed close is the stated trigger; an actual fill can differ |
| Structural invalidation and stop | 1.0985 | The assumed stop is 0.0020, or 20 pips, below entry |
| Next marked obstacle | 1.1045 | Distance from entry is 0.0040, or 40 pips |
| Gross reward relative to risk | 40 ÷ 20 = 2R | Only before spread, slippage, financing, and execution differences |
| Position size | Not assumed | Determine from the account-risk allowance and effective stop distance, not the strength of the candle |
| No-entry decision | Skip if trigger, costs, price location, or account-risk limit fail the written rules | A valid breakout structure is not automatically an acceptable trade |
The same calculation can be made for a short setup by reversing the price direction. Prices here are illustrative and must not be mixed with the verified numerical research tables below.
Entry Rules: Breakout, Pullback, Retest, Or Continuation
A momentum entry should make the trade more precise, not more emotional. The entry method should be selected before the move appears.
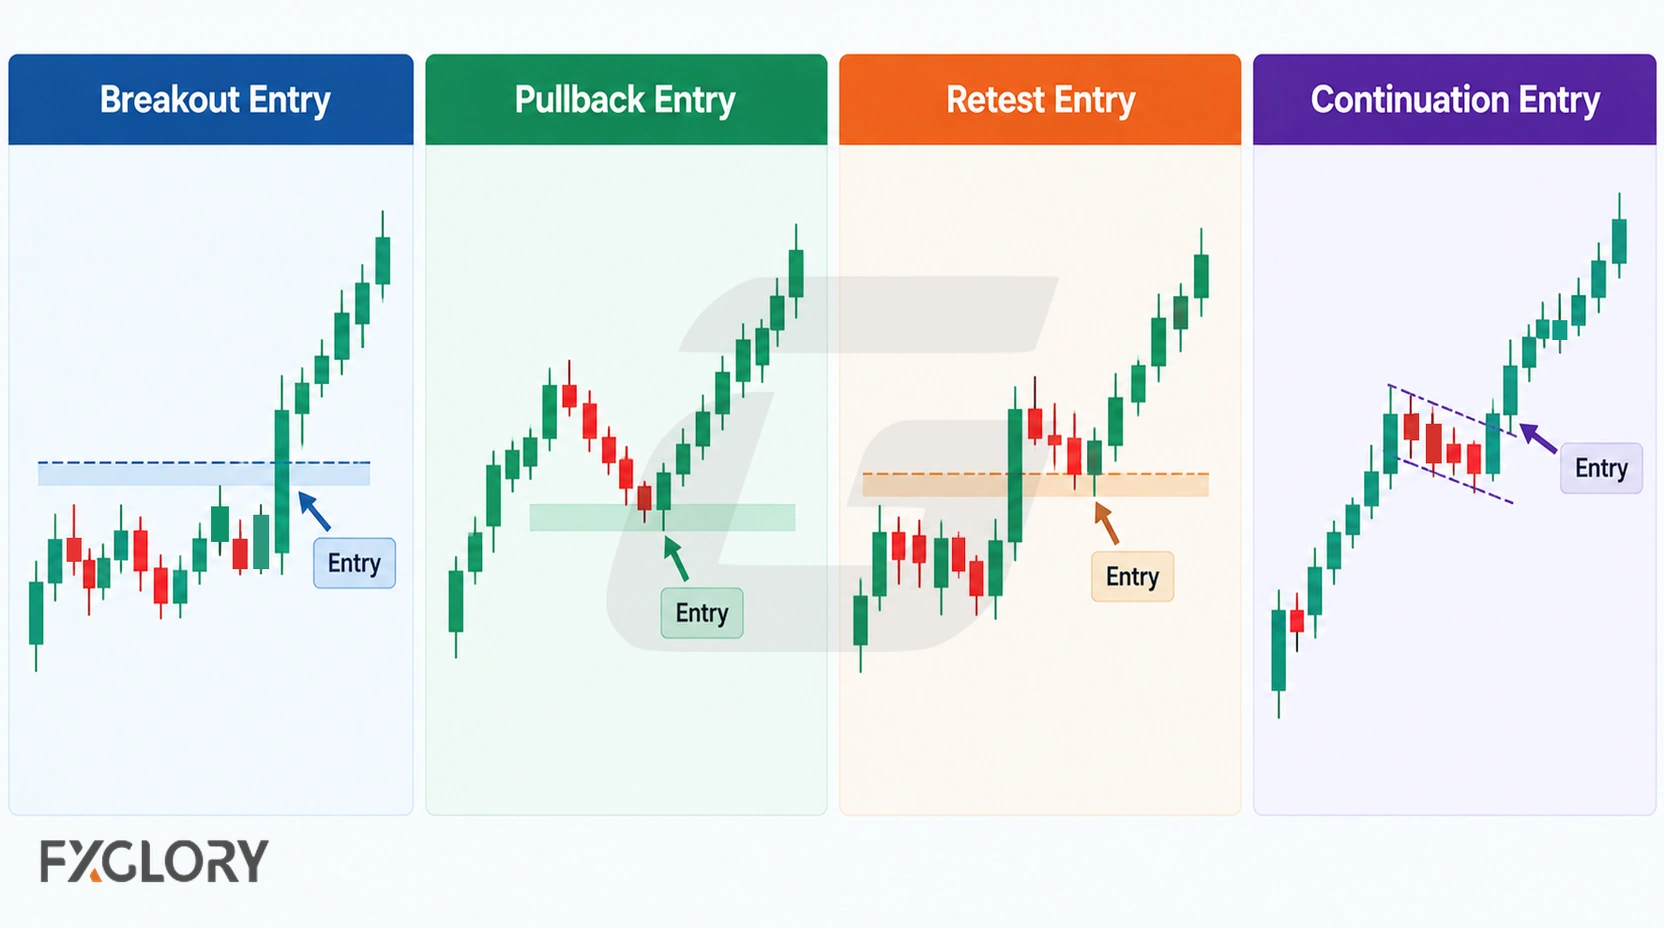
| Entry Type | How It Works | Best Use | Main Risk |
|---|---|---|---|
| Breakout entry | Entry after price closes beyond a level with momentum | Expansion from range or consolidation | False breakout or late candle entry |
| Pullback entry | Entry after price retraces into structure and resumes | Continuation after strong movement | Pullback becomes reversal |
| Retest entry | Entry after broken level holds on return | Momentum after role reversal | Messy or failed retest |
| Continuation candle | Entry after a controlled candle confirms pressure | Structured trend continuation | Entering after price is extended |
| Indicator-supported entry | Entry when price structure aligns with momentum indicator | Confirmation, not standalone signal | Indicator signal without tradable location |
A breakout close, a retest hold, and a pullback continuation are alternative triggers. Specify whether each requires a completed candle and how the stop location is determined before comparing their outcomes.
Exit Rules: When Momentum Fades
A momentum strategy needs exit rules before entry because momentum can fade quickly. Waiting for a perfect reversal can turn a strong trade into an unmanaged position.
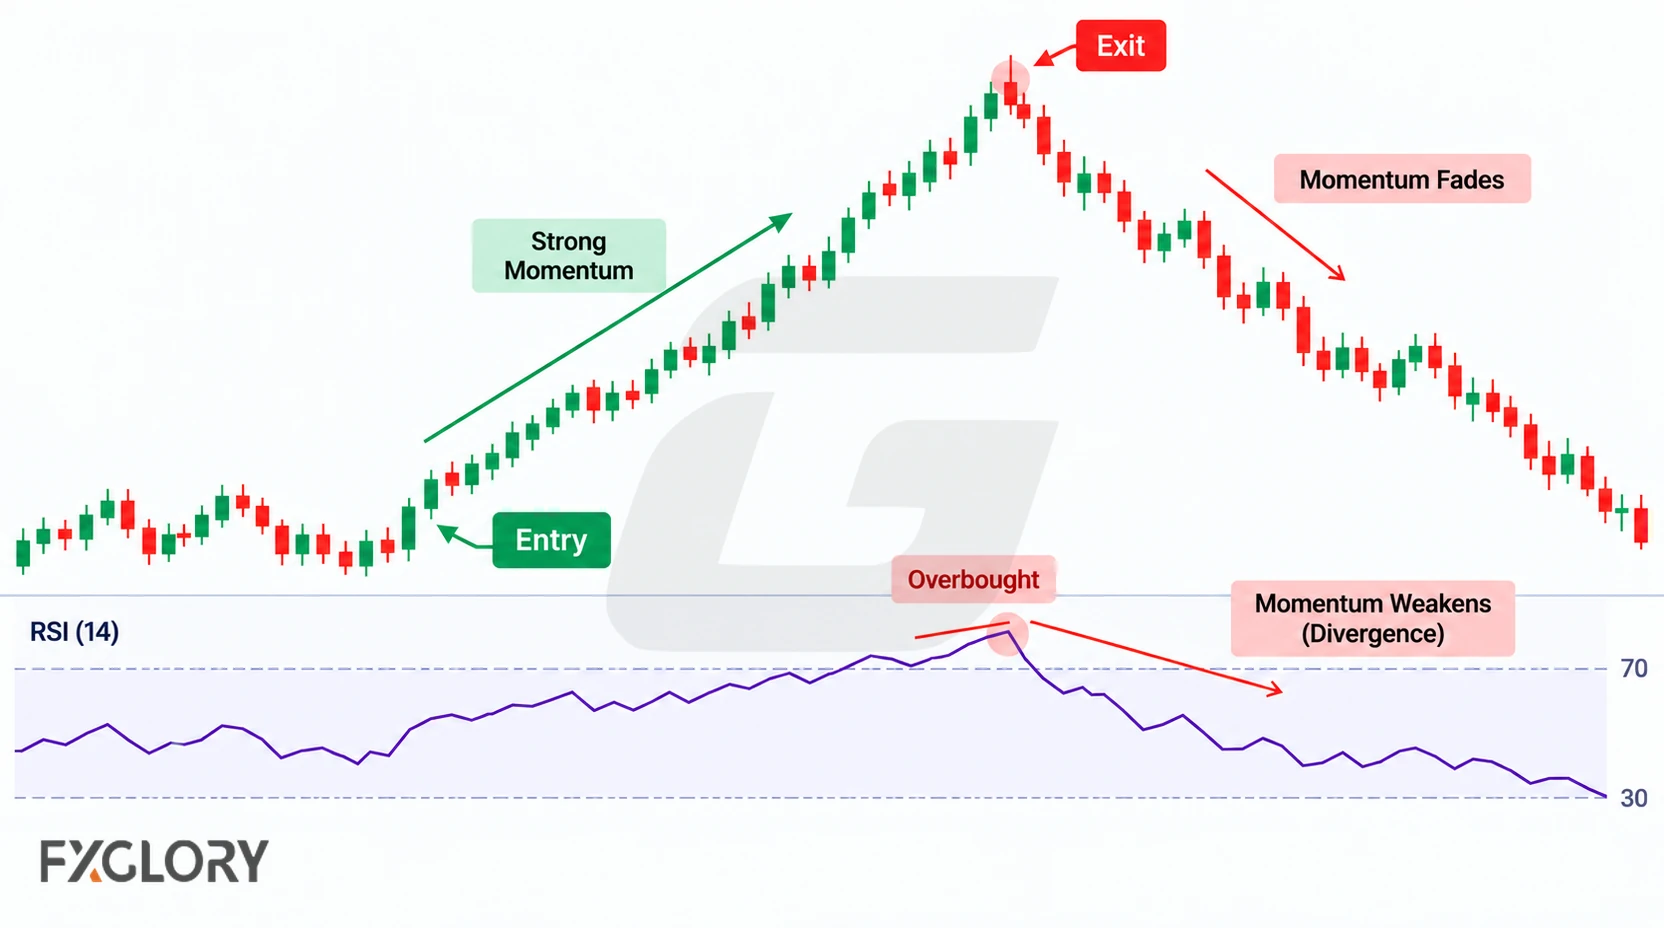
| Exit Signal | What It Suggests | Possible Action |
|---|---|---|
| Target reached | Price has reached the planned level or measured move | Exit, reduce, or trail only if rules allow |
| Momentum fades near obstacle | Continuation pressure is weakening near support or resistance | Reduce risk or avoid adding exposure |
| Structure breaks | The setup no longer supports continuation | Exit or cancel continuation idea |
| MACD or RSI weakens | Indicator warns that pressure may be fading | Review with price structure, not indicator alone |
| News or spread changes | Trading conditions no longer match the plan | Delay, reduce, or exit based on written rules |
Momentum exit rules should be tested separately from entry rules. A good entry can still fail if the trader has no rule for fading pressure.
News, Spread, Slippage, Swap, Margin, And Leverage Checks
Momentum strategies can be sensitive to execution and cost because fast movement can widen spreads, increase slippage, and tempt larger position sizes. A setup that looks strong on the chart may be weak after trading conditions are included.
| Condition | Why It Matters For Momentum | Decision It Should Change |
|---|---|---|
| Spread | Fast or frequent momentum trades can lose edge to transaction cost | Skip if spread consumes too much target room |
| Slippage | Fast candles can change entry, stop, and exit quality | Avoid entering after sudden spikes without a plan |
| News | Event moves can mimic momentum but behave unpredictably | Delay, reduce risk, or skip if event rules are not defined |
| Swap | Momentum trades held overnight may carry rollover cost | Review holding cost before entry |
| Margin | Momentum systems can create multiple open trades or correlated exposure | Limit total exposure before adding trades |
| Leverage | Losses can accelerate when position size and stop distance are mismatched | Resize or skip if margin pressure becomes excessive |
| Correlation | Several momentum trades can depend on the same currency move | Reduce duplication across related pairs |
| Rebalancing | Ranking-based momentum can require periodic changes | Check whether transaction costs and swap weaken the idea |
Review FXGlory spreads when momentum targets are short or entries are frequent. Use the FXGlory margin calculator after stop distance is known, and review leverage conditions before increasing exposure.
No-Trade Conditions
Apply the following rejection conditions to the specific setup under review; a rapid price move alone does not establish whether it qualifies.
- Skip if the move is already extended into a major support or resistance area.
- Skip if the entry would be far from invalidation.
- Skip if spread or slippage removes too much target room.
- Skip if a news event is driving the move and event rules are not defined.
- Skip if MACD, RSI, ADX, or another indicator is the only reason for entry.
- Skip if volatility is high but directional structure is unclear.
- Skip if the pullback breaks the structure that supported the momentum idea.
- Skip if the breakout returns inside the old range and accepts it again.
- Skip if multiple trades create duplicated currency exposure.
- Skip if completed candles show repeated failed follow-through or possible exhaustion at the intended entry.
- Skip if no entry, stop, and exit rules were defined before the trade decision.
Testing And Review Checklist
Evaluate momentum approaches with explicit signal definitions. Report breakout, pullback, time-series, and cross-sectional components individually where their contribution matters; if they are combined, also test the actual combined execution and portfolio rules. Do not pool unlike setups into an unexplained aggregate.
- Specify the test universe and period: list each currency pair, candle timeframe, data source, historical window, and indicator warm-up period.
- Freeze the signals: define the lookbacks, price or indicator conditions, candle-completion requirement, execution timing, and every filter before reviewing results.
- Write executable trade rules: state entry, structural invalidation, stop, target, other exits, position sizing, and simultaneous-position limits separately.
- Check for future-data leakage: indicators and higher-timeframe filters must use information available at the entry decision, not values learned from a later candle close.
- Model costs and fills: include plausible spreads, per-side slippage, swaps if relevant, and a documented rule for ambiguous intrabar stop-versus-target ordering.
- Log all eligible observations: record accepted and skipped setups, reasons for rejection, and whether each rule was applied consistently.
- Report outcomes transparently: include trade counts, win/loss distribution, expectancy, drawdown, holding time, pair and direction breakdowns, and cost sensitivity.
- Assess sample limitations: show the observation count and test period; use out-of-sample or period-by-period checks when feasible. No fixed number of examples establishes reliability for every strategy.
- Separate diagnosis from revision: tag mistakes such as late entry, weak structure, news distortion, indicator-only triggers or duplicated exposure, then retest explicitly documented rule changes.
Backtesting Notes For Forex Momentum Strategy
This numerical review uses one hypothetical educational rule model: a daily Donchian breakout continuation setup with weekly trend alignment, ADX confirmation, ROC confirmation, ATR-based risk, a 2R target comparison, and a momentum-fade exit. It does not test every type of forex momentum, trend continuation, breakout trading, pullback-after-momentum, MACD momentum, RSI momentum, session momentum, or cross-sectional currency-strength ranking.
The model reviewed EURUSD, GBPUSD, USDJPY, AUDUSD, USDCAD, and USDCHF on daily candles using public yfinance OHLC data where available. The recorded requested review window was 2016-06-29 to 2026-06-29, with 2014-07-30 to 2016-06-28 used as indicator warm-up data. These dates are taken from the accompanying research record, not independently reproduced here. The breakout reference is the prior 60-day Donchian high for long setups and the prior 60-day Donchian low for short setups.
| Rule Area | Educational Model Rule |
|---|---|
| Momentum type | Daily time-series Donchian breakout continuation |
| Long breakout | Daily close above the prior 60-day high |
| Short breakout | Daily close below the prior 60-day low |
| Weekly trend filter | Weekly close must be on the correct side of weekly EMA(50), with weekly EMA(50) slope over 5 completed weeks supporting the trade direction |
| Momentum confirmation | ADX(14) at least 20 and ROC(20) aligned with the trade direction |
| Chasing filter | Signal candle extension beyond the Donchian breakout level must be no more than 1.25 ATR(14) |
| Entry | Next daily open after the confirmed breakout candle |
| Stop | 1.5 ATR(14) from entry |
| Target comparison | Fixed 2R target |
| Momentum-fade exit | After at least 3 holding candles, exit at daily close if EMA(20) structure or ROC(10) turns against the position |
| Maximum holding review | 40 daily candles after entry |
The review records trade count, win rate, average win in R, average loss in R, expectancy in R, profit factor, maximum drawdown in R, worst losing streak, average holding period, pair-level behavior, direction-level behavior, exit reasons, and spread/slippage sensitivity.
| Cost Input | Assumptions Used |
|---|---|
| Spread | 0.5, 1.5, and 3.0 pips |
| Slippage | 0.1, 0.5, and 1.0 pips per side |
| Baseline comparison | 1.5-pip spread and 0.5-pip slippage per side |
| Swap and rollover | Not included |
Educational Sensitivity-Test Results
This educational sensitivity test is not presented as a profitable system. The baseline run used 1.5 pips of spread and 0.5 pips of slippage per side. Across 147 trades, the model produced a negative expectancy of -0.24R, a profit factor of 0.556, and a total net result of -35.2855R. These figures are hypothetical historical outputs from one educational rule model and do not prove future live-trading performance.
| Metric | Baseline Result |
|---|---|
| Number of trades | 147 |
| Win rate | 28.57% |
| Average win | 1.052R |
| Average loss | -0.7568R |
| Expectancy | -0.24R |
| Profit factor | 0.556 |
| Maximum drawdown | -38.4881R |
| Worst losing streak | 9 |
| Average holding period | 7.86 daily candles |
| Median holding period | 8 daily candles |
| Total net result | -35.2855R |
Pair-level results varied, but every reviewed pair had negative baseline expectancy in this run.
| Pair | Trades | Win Rate | Expectancy | Profit Factor | Max Drawdown | Total Net R |
|---|---|---|---|---|---|---|
| EURUSD | 23 | 21.74% | -0.2625R | 0.476 | -9.5112R | -6.0369R |
| GBPUSD | 27 | 25.93% | -0.2893R | 0.5248 | -10.7746R | -7.8111R |
| USDJPY | 28 | 39.29% | -0.2014R | 0.6242 | -7.7225R | -5.6393R |
| AUDUSD | 23 | 34.78% | -0.1637R | 0.6544 | -5.4366R | -3.7644R |
| USDCAD | 22 | 27.27% | -0.248R | 0.5486 | -5.9561R | -5.4565R |
| USDCHF | 24 | 20.83% | -0.2741R | 0.5137 | -7.5161R | -6.5773R |
Long trades had a smaller negative expectancy than short trades under the baseline assumptions.
| Direction | Trades | Win Rate | Expectancy | Profit Factor | Max Drawdown | Total Net R |
|---|---|---|---|---|---|---|
| Long | 83 | 32.53% | -0.1467R | 0.7248 | -17.3933R | -12.1784R |
| Short | 64 | 23.44% | -0.361R | 0.3439 | -23.945R | -23.1071R |
Exit counts separate momentum-fade exits, stop losses, fixed 2R targets, and time exits.
| Exit Reason | Count |
|---|---|
| momentum fade | 68 |
| stop loss | 61 |
| target 2r | 17 |
| time exit | 1 |
Cost sensitivity remained negative across all tested spread and slippage assumptions.
| Spread | Slippage Per Side | Trades | Expectancy | Profit Factor | Max Drawdown | Total Net R |
|---|---|---|---|---|---|---|
| 0.5 pips | 0.1 pips | 147 | -0.226R | 0.5739 | -36.7838R | -33.2215R |
| 0.5 pips | 0.5 pips | 147 | -0.2322R | 0.5659 | -37.5413R | -34.1388R |
| 0.5 pips | 1 pips | 147 | -0.24R | 0.556 | -38.4881R | -35.2855R |
| 1.5 pips | 0.1 pips | 147 | -0.2338R | 0.5639 | -37.7307R | -34.3682R |
| 1.5 pips | 0.5 pips | 147 | -0.24R | 0.556 | -38.4881R | -35.2855R |
| 1.5 pips | 1 pips | 147 | -0.2478R | 0.5463 | -39.435R | -36.4321R |
| 3 pips | 0.1 pips | 147 | -0.2455R | 0.5492 | -39.1509R | -36.0881R |
| 3 pips | 0.5 pips | 147 | -0.2517R | 0.5415 | -39.9084R | -37.0054R |
| 3 pips | 1 pips | 147 | -0.2595R | 0.5321 | -40.8552R | -38.1521R |