

What Is A Forex Breakout Strategy?
A forex breakout strategy is a trading method that watches for price to move beyond a planned support, resistance, range, trendline, channel, or pattern boundary. The idea is that a clear break may show a change from balance to movement, from compression to expansion, or from a defended level to a new price area.
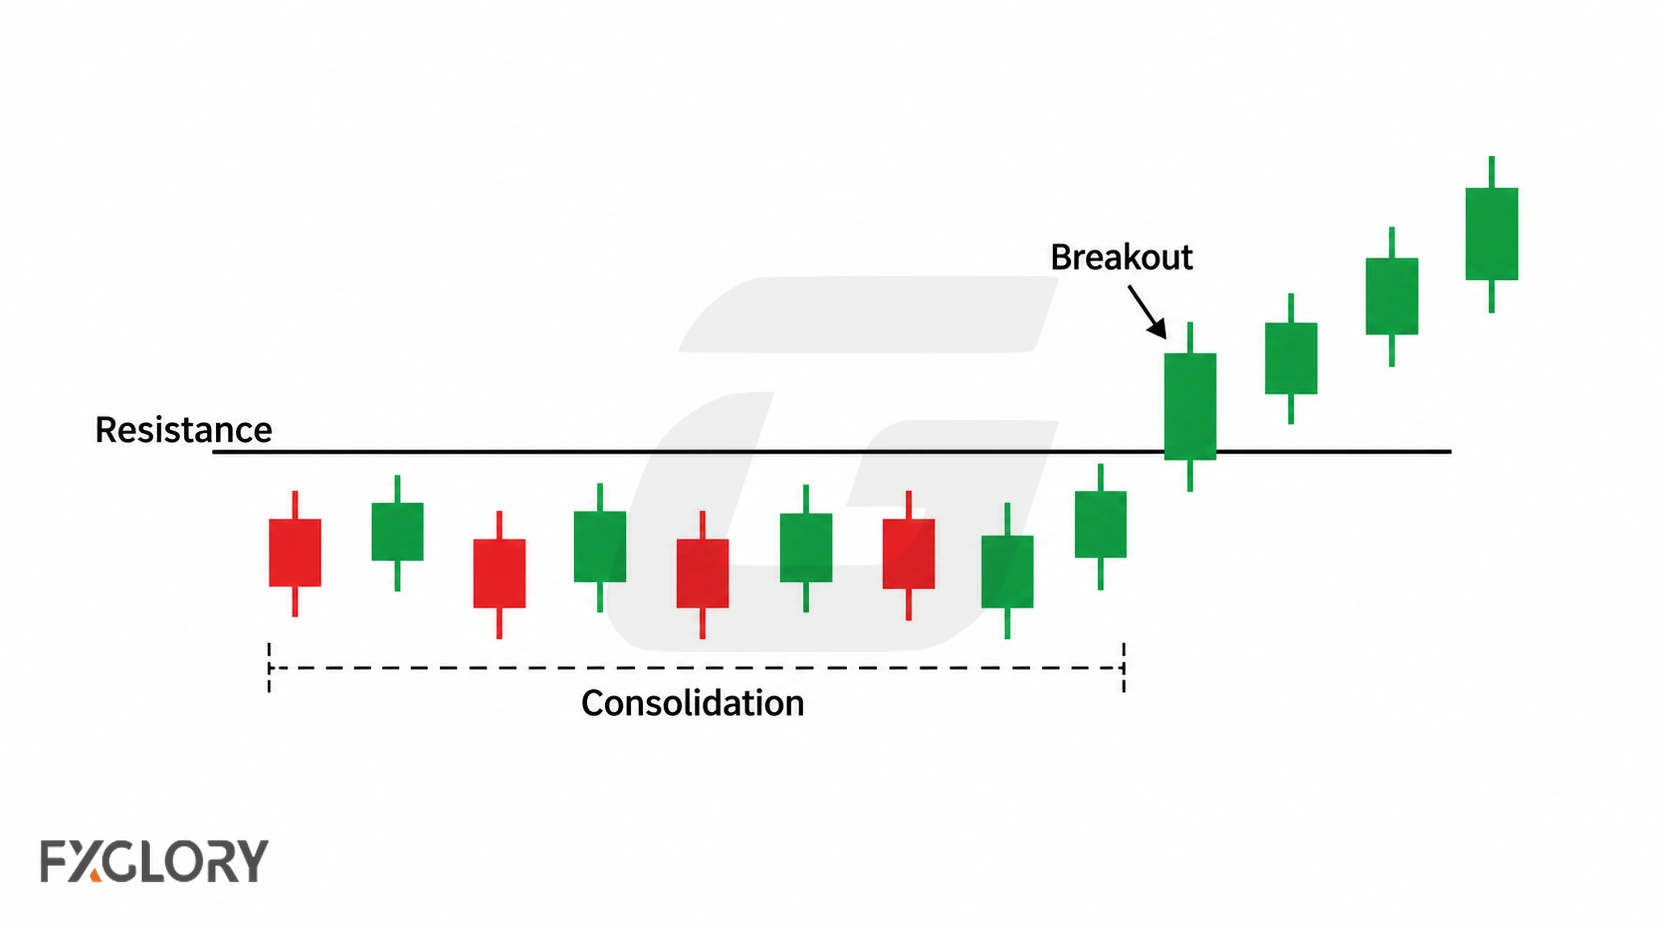
The breakout itself is only the starting point. A trader still needs a level worth trading, confirmation, entry method, invalidation point, target, spread check, risk rule, and no-trade condition. Without those rules, breakout trading becomes chasing movement after it has already happened.
This page focuses on breakout-specific decisions: how to define a level, compare immediate and retest entries, handle false breakouts, place stops, set targets, and decide when to skip the trade.
Breakout vs Breakout Trade
A breakout is a chart event. A breakout trade is a planned decision. That distinction matters because many weak trades begin with a real breakout but fail because the entry is late, the target is too close, or the stop has no logical place.
| Item | What It Means | Why It Is Not Enough Alone |
|---|---|---|
| Breakout | Price crosses a previously marked support, resistance, range, trendline, channel, or pattern boundary; some methods require a completed close to qualify | An intrabar break may reverse, and even a completed close can leave too little target room after costs |
| Breakout confirmation | A specified condition such as a completed close beyond the level; a retest, sustained trading outside, and subsequent follow-through are distinct later observations when required | Waiting for more evidence can improve definition but can also leave a late entry |
| Breakout trade | The trader has an entry, stop, target, risk limit, and cancel rule | The plan can still be invalid if spread, volatility, or news risk changes conditions |
For the full entry-and-exit framework behind a breakout trade, use the entry and exit strategy guide. A breakout trigger should never be separated from its stop, target, time rule, and invalidation rule.
Why Forex Breakouts Happen
Breakouts can occur in different contexts. Some appear after quiet consolidation; others coincide with active sessions, economic announcements, or trend continuation after a pause. Triggered stops, changes in positioning, and shifting liquidity can contribute to movement, but a price chart alone cannot establish which mechanism caused a particular breakout.
The reason matters because each breakout type behaves differently. A quiet compression breakout may need volatility expansion. A news breakout may move fast but become hard to manage. A trend-continuation breakout may work only if the wider trend remains intact.
| Possible Breakout Context | What It Can Look Like | Main Risk |
|---|---|---|
| Range compression | Price holds inside a narrow range before expanding | False break if volatility does not follow through |
| Session activity | Movement increases around a planned trading window | Opening volatility can create fakeouts |
| Trend continuation | Price pauses, then breaks in the direction of the trend | Late entry after most of the move has already happened |
| Reversal breakout | Price breaks a structure that supported the previous move | The break may become a trap if the wider condition is unclear |
| News or data event | Price breaks quickly after an announcement | Spread, speed, and slippage can change beyond the plan |
| Possible stop activity near a crowded level | Price spikes beyond an obvious high or low; the chart does not reveal the orders responsible | The move may return inside the range rather than establish a sustained break |
For session planning, choose the trading window before choosing the breakout level. Breakouts around active sessions need different handling than breakouts that appear in flat or thin conditions.
How To Judge A Breakout Level
A breakout level should be judged before price reaches it. If the level only becomes obvious after the candle has already moved, the trader may be fitting the chart around the trade instead of trading a planned structure.
Level quality matters because a weak level can create a real breakout that still has poor trading value. The level may be too close to the next obstacle, too messy to define, too tight after spread, or redrawn after the move has already happened.
| Level-Quality Check | Better Version | Weak Version |
|---|---|---|
| Defined early | The level is marked before price reaches it | The level is drawn after the breakout candle appears |
| Clear reactions | Price has reacted around the area enough to make the level visible | Random touches are used to force a line |
| Room beyond the level | There is space before the next support, resistance, or structure obstacle | The breakout runs directly into the next nearby level |
| Range quality | The range is wide enough after spread but not so wide that the stop becomes unrealistic | The range is too tight for cost or too wide for risk |
| Line discipline | Trendlines and channels are not redrawn after price moves | The boundary is adjusted until the breakout looks valid |
| Timeframe agreement | The level is visible on the trading timeframe and still makes sense in context | The level exists only on one noisy lower-timeframe candle |
Forex Breakout Decision Sequence
A forex breakout strategy should follow the same order each time. If the trader begins with a moving candle and builds the reason afterward, the trade cannot be reviewed clearly.
| Step | Decision | Continue Only If |
|---|---|---|
| 1. Level quality | Support, resistance, range, trendline, channel, or pattern boundary is clear before the break | The level is visible and not invented after price moves |
| 2. Market condition | The market is trending, ranging, compressing, expanding, or unclear | The breakout type fits the condition |
| 3. Breakout type | Immediate break, close confirmation, retest, squeeze, ORB, trendline, or pattern breakout | The entry method is known before the move |
| 4. Confirmation | Price closes, retests, holds, expands, or follows through according to the rule | The confirmation is not late or forced |
| 5. Stop | The invalidation point is known before entry | The stop is based on structure or volatility |
| 6. Target | The objective is realistic after spread and nearby obstacles | The trade has room to develop |
| 7. Risk | Position size, margin, and daily limit fit the account rules | The trade does not break risk limits |
| 8. Cancel rule | The trade is skipped if price returns inside, spread changes, or the setup becomes late | The trader can avoid chasing a weakened breakout |
Immediate Entry vs Retest Entry
Breakout traders usually face one main choice: enter as price breaks, or wait for price to retest the broken level. Both choices have tradeoffs.
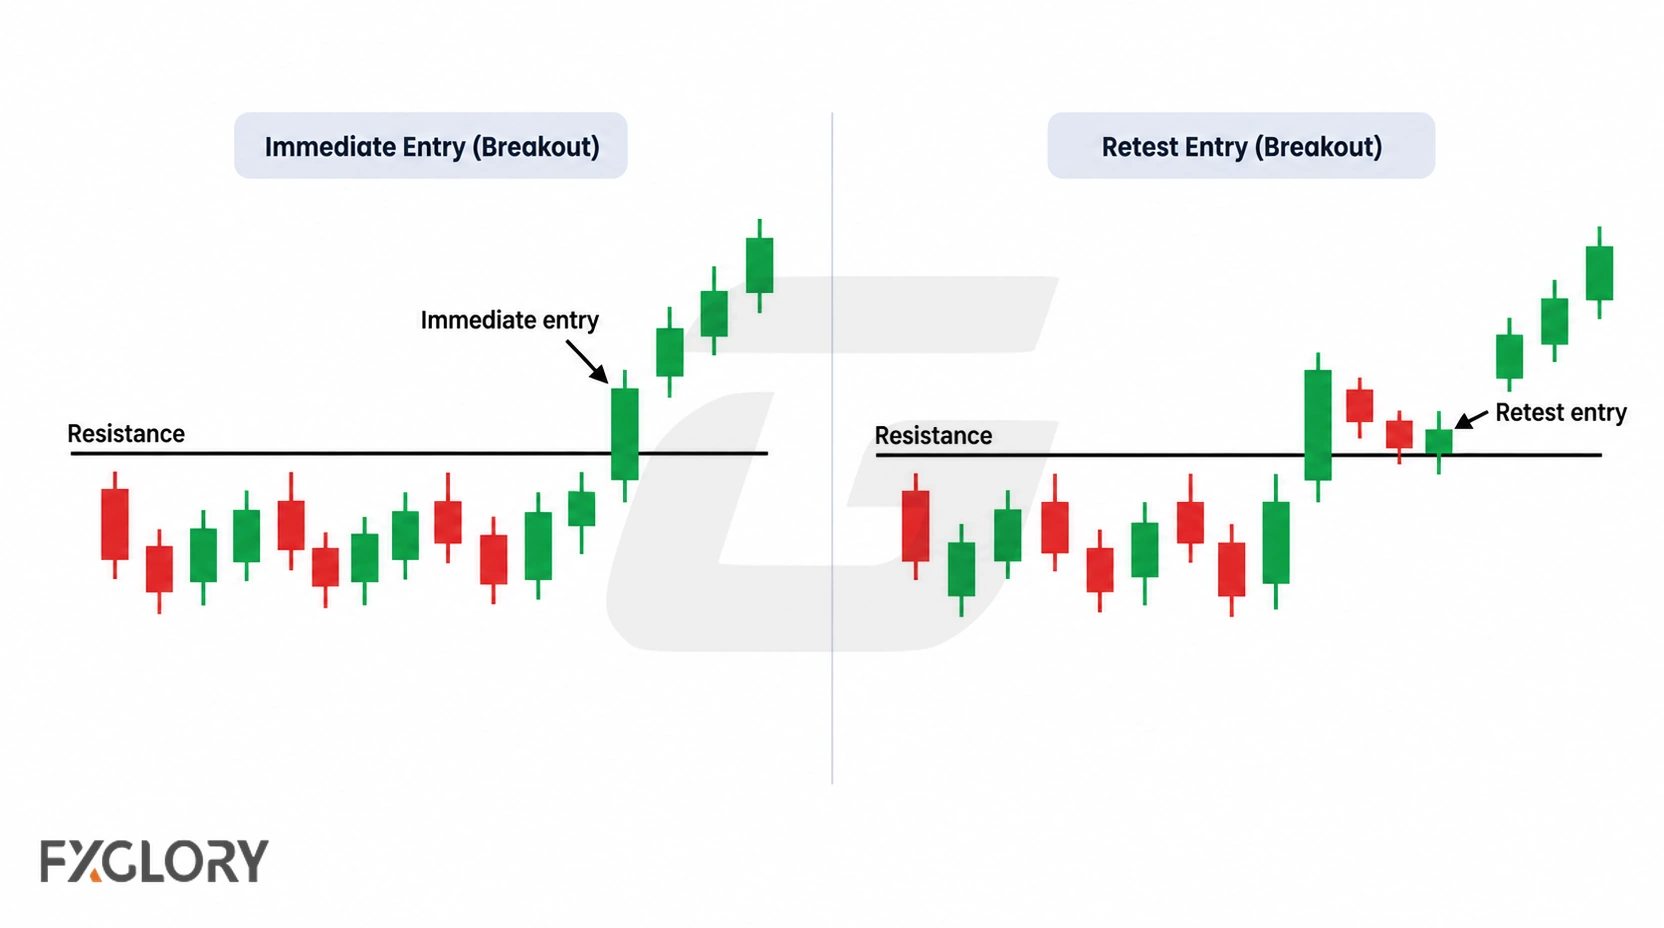
| Entry Type | How It Works | Potential Strength | Main Weakness |
|---|---|---|---|
| Immediate breakout entry | Trader enters as price breaks through the planned level | Can participate if momentum continues without a retest | Higher fakeout and late-entry risk |
| Close-confirmation entry | Trader waits for a candle to close beyond the level | Filters some weak touches of the level | Confirmation can arrive after price has already moved too far |
| Pending stop entry | Order is placed beyond the level before price reaches it | Can define the trigger in advance | May be triggered by a spike or poor conditions |
| Retest entry | Trader waits for price to return to the broken area and hold | Can provide clearer structure and stop placement | The retest may never happen |
Breakout And Retest Strategy
A breakout and retest strategy first requires a break of a premarked level, then a return toward that area. After a break above resistance, the trader assesses whether the old resistance can act as support; after a break below support, whether the old support can act as resistance. A touch alone is not a successful retest: the plan must specify the completed-candle or price-structure condition that constitutes holding. If the area fails and price moves back inside the original structure, the trader applies the predefined invalidation or cancellation rule.
For a detailed treatment of entry triggers and failed retests, see the break and retest strategy.
| Retest Part | Better Version | Weak Version |
|---|---|---|
| Broken level | The level was defined before the breakout | The level is drawn after price moves |
| Retest behavior | Price returns to the broken area and reacts under a written rule | Any touch of the level becomes an entry |
| Invalidation | Stop is placed where the retest idea is wrong | Stop is moved wider after the retest fails |
| Target | Target is based on structure, measured move, volatility, or next level | Target is chosen because the trader wants a large move |
| Missed retest | No trade is taken if price never returns to the planned area | Trader chases because the retest did not happen |
False Breakout And Fakeout Rules
A false breakout happens when price moves beyond a level but fails to continue and returns inside the prior range, pattern, or structure. Orders clustered near visible levels and changes in liquidity may contribute, but the chart alone does not prove why a particular break failed.
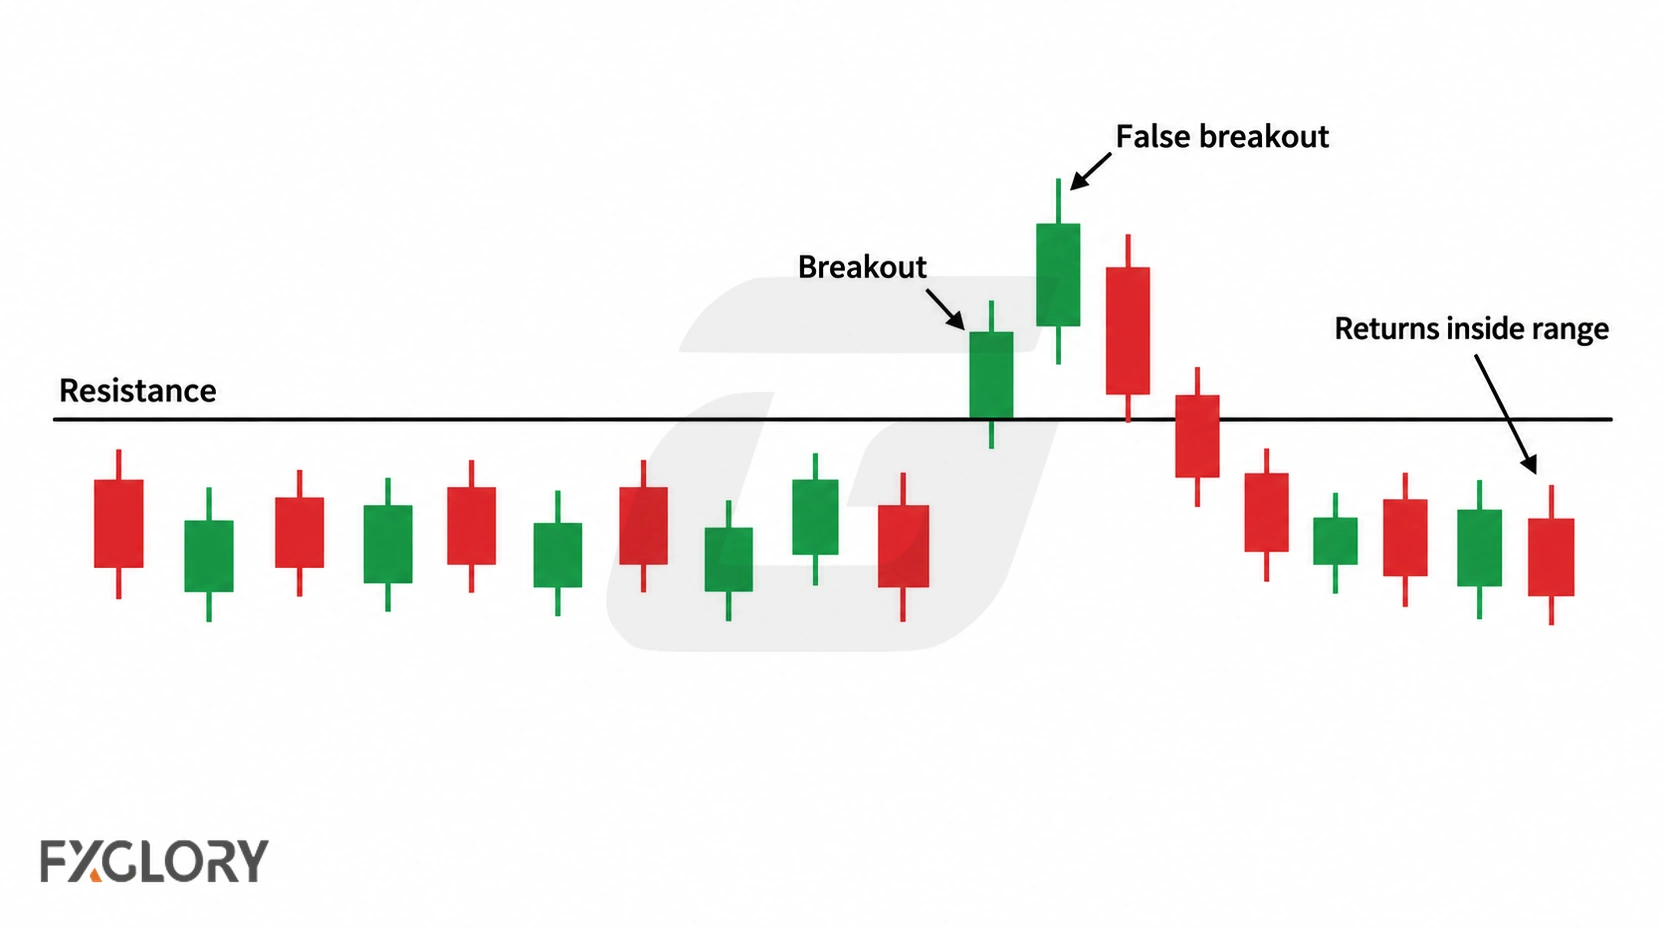
The goal is not to avoid every fakeout. That is unrealistic. The goal is to decide before entry what counts as breakout failure and what action follows.
| False-Break Clue | What It Suggests | Possible Rule |
|---|---|---|
| Price breaks and closes back inside | The breakout did not hold beyond the structure | Skip or exit according to the written rule |
| No follow-through | Price moves beyond the level but stalls immediately | Use a time stop or cancel rule |
| Weak retest | The broken level does not hold as support or resistance | Do not treat the retest as valid |
| Spread widens | Cost and execution conditions may have changed | Skip if the target is no longer realistic |
| News spike | Movement may be fast but difficult to manage | Follow event-risk rules before entry |
| Late candle | Price has already traveled toward the target | Avoid entering after the move is extended |
Common Forex Breakout Strategy Types
Breakout setups can come from several structures. The structure should be clear before the breakout appears. If the trader only sees the pattern after the candle has moved, the setup may be too easy to force.
| Breakout Type | How It Forms | What To Watch | Skip When |
|---|---|---|---|
| Horizontal range breakout | Price breaks above resistance or below support | Close, retest, range height, next level | The range is unclear or too tight after spread |
| Trendline breakout | Price breaks a trendline that has guided recent movement | Retest, structure change, momentum follow-through | The trendline is forced through weak points |
| Channel breakout | Price breaks beyond a rising, falling, or sideways channel | Channel quality, volatility expansion, retest behavior | Channel boundary is redrawn after the break |
| Triangle or wedge breakout | Price compresses inside narrowing structure and then breaks | Direction, follow-through, target room | Break occurs into nearby support or resistance |
| Opening range breakout | Price breaks the high or low of a planned session range | Session definition, false break, time stop | The session window was not defined before trading |
| Squeeze breakout | Volatility compresses before expansion | Band/channel compression, expansion, direction confirmation | Trader enters before direction is defined |
| Moving-average or Donchian-style breakout | Price breaks above or below a dynamic or high/low reference | Trend filter, range width, false-signal control | The signal appears in a flat market |
| News breakout | Price breaks rapidly after economic or market news | Spread, speed, slippage, execution risk | The plan does not allow trading event volatility |
For 15-minute opening-range context, review the M15 strategy guide. For compression-style breakouts, use the Bollinger Band squeeze strategy and the TTM squeeze strategy as deeper supporting pages.
Indicators For Breakout Confirmation
Indicators can help review breakout conditions, but they should not replace the breakout structure. A breakout indicator should answer one question: trend strength, volatility, momentum, direction filter, recent high/low range, or stop realism.
| Indicator | Breakout Role | Weak Use |
|---|---|---|
| ADX | Reviews trend strength or whether the market is gaining directional force | ADX is used as a buy or sell signal by itself |
| ATR | Reviews volatility, stop distance, and target realism | ATR is used to justify a stop that is too wide for the plan |
| RSI or MACD | Reviews momentum support or exhaustion near the breakout | Momentum confirms after the move is already late |
| Moving average | Filters direction or trend context before the breakout | Every moving-average break becomes a trade |
| Bollinger Bands or Keltner Channels | Reviews compression, expansion, and channel behavior | Every band or channel break is treated as a valid breakout |
| Donchian-style high/low channel | Reviews whether price is breaking beyond a recent high or low range | Every new high or low is traded without checking range quality, spread, or false-breakout rules |
For trend-strength confirmation, use the ADX forex trading strategy page. For volatility and stop-distance logic, use the ATR forex strategy framework. For channel-based movement, review the Keltner Channel forex strategy.
Forex Volume And Breakout Confirmation
Many breakout guides discuss volume confirmation. In spot forex, that needs careful handling because there is no single centralized exchange volume feed for the entire market. Platform volume may be based on tick activity or broker-feed data rather than total global forex volume.
Feed-specific tick activity can help compare the frequency of price updates around a breakout, but it is not a direct measurement of global spot-forex traded volume. Neither higher nor lower tick volume identifies the initiating side of transactions or proves who supports the move. For more detail, see the forex tick volume indicator guide.
| Volume Question | Careful Interpretation | Weak Interpretation |
|---|---|---|
| Did activity increase near the breakout? | More price updates or activity were recorded by that particular feed | Assume it proves global forex volume or one-sided buying or selling |
| Did the retest happen on lower activity? | Fewer tick updates may indicate less recorded quote activity on this feed, without identifying buying or selling pressure | Assume lower tick volume proves that opposing traders are absent |
| Did price break without activity support? | It may deserve caution if the plan uses volume-style filters | Reject or accept the trade without checking price structure |
Entry, Stop, And Target Rules
A breakout setup should define the entry, stop, target, and invalidation point before the order is placed. If those rules appear only after the breakout candle has moved, the trade is probably too reactive.
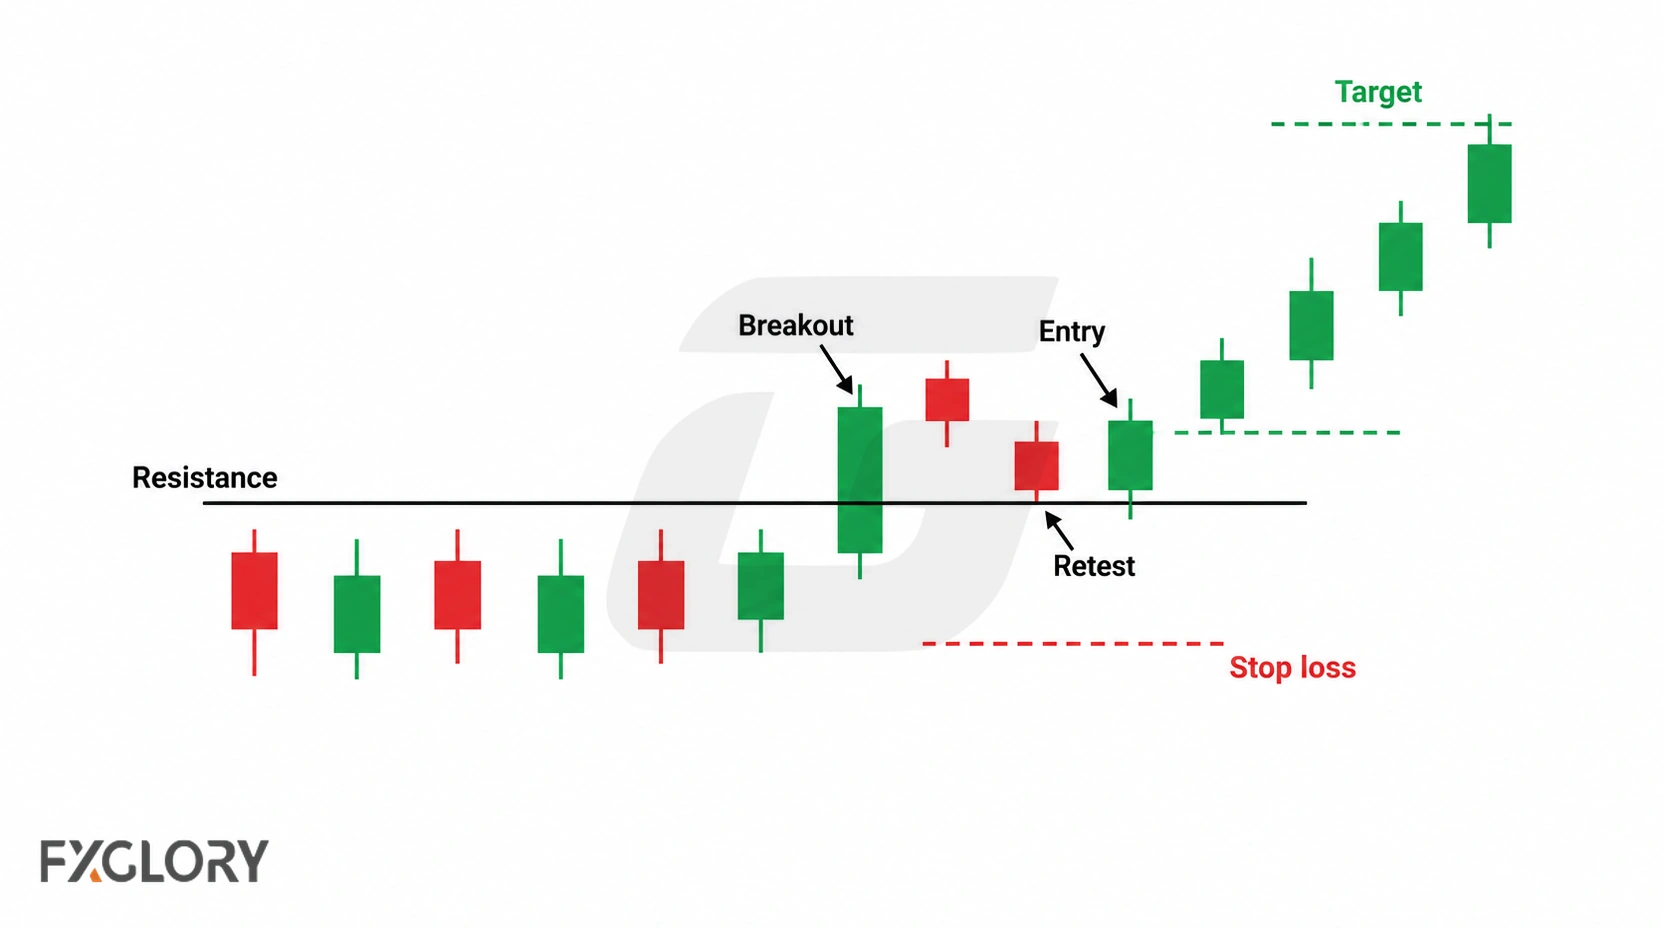
| Rule Area | Possible Rule | Weak Version |
|---|---|---|
| Entry | Immediate break, close confirmation, pending order, or retest entry is chosen before the setup | Entry is chosen after price has already moved |
| Stop | Stop goes beyond the broken level, failed retest, breakout candle, range boundary, or volatility invalidation | Stop is placed where the loss feels comfortable |
| Target | Target is based on next support or resistance, range height, measured move, ATR, partial exit, trail, or time rule | Target is chosen because the trader wants a large move |
| Time rule | Trade is closed or reviewed if follow-through does not appear within the planned window | A stalled breakout becomes an unplanned hold |
| Cancel rule | Trade is canceled if price returns inside, spread changes, or entry becomes late | Trader enters because the breakout almost worked |
Short-term breakout targets can be sensitive to cost. Check the spread conditions that affect small-target trades before accepting a breakout. When stop distance, position size, leverage exposure, and margin need to be reviewed together, use the margin calculator before the order is placed.
Risk Rules And No-Trade Conditions
Breakout trading can create emotional re-entry because failed breaks often look as if they may work on the next attempt. Risk rules should be written before the first trade, not after the first fakeout.
| No-Trade Condition | Why It Matters | Action |
|---|---|---|
| Level is unclear | The breakout is too easy to force | Skip until structure is clear |
| Entry is late | Price may already be near the target area | Wait for a new setup or retest |
| Spread is unsuitable | The target may be weak before entry | Skip the trade |
| No stop logic | The trader cannot define where the breakout is wrong | Do not enter |
| Break returns inside | The breakout may have failed | Follow the false-break rule |
| News risk changes conditions | Spread, speed, and volatility can shift quickly | Follow the event-risk rule |
| Daily stop reached | More breakouts can become revenge trades | Stop trading for the session |
| Correlated exposure increases | Several breakout trades may create the same directional risk | Reduce or skip overlapping exposure |
For account-level risk limits, use the forex risk-management strategy page. For platform workflow, review FXGlory trading platforms before relying on pending orders, stop management, or fast breakout execution.
Backtesting Notes For Forex Breakout Strategy
This numerical review uses one hypothetical educational rule model: a daily 20-candle range close-breakout setup with ATR range filters, a short compression filter, completed daily candle confirmation, ATR-based stop placement, a 1.5R target comparison, a false-break exit, and spread/slippage sensitivity. It does not test breakout-and-retest entries, opening-range breakouts, squeeze systems, trendline breaks, channel breaks, news breakouts, or discretionary breakout confirmation.
The model reviews EURUSD, GBPUSD, USDJPY, AUDUSD, USDCAD, and USDCHF on daily candles using public yfinance OHLC data where available. The breakout range is defined before the signal using the highest high and lowest low of the previous 20 completed daily candles. The signal requires a completed daily close, and the planned entry occurs at the next daily open.
For exact reproduction, the original script must establish which completed bar supplies each ATR(14) value, how the stop buffer and costs are applied at entry and exit, and how gaps are handled at daily opens. The summarized rules do not resolve those implementation details; they should not be guessed or silently altered.
| Rule Area | Educational Model Rule |
|---|---|
| Strategy type | Daily horizontal range close-confirmation breakout |
| Range high | Highest high of the previous 20 completed daily candles |
| Range low | Lowest low of the previous 20 completed daily candles |
| Valid range width | At least 1.00 ATR(14) and no more than 4.00 ATR(14) |
| Compression filter | The previous 5 completed daily candles must have a combined high-low range no more than 0.80 of the 20-candle range width |
| Long breakout | Completed daily close at least 0.10 ATR(14) above the range high and no more than 1.25 ATR(14) beyond it |
| Short breakout | Completed daily close at least 0.10 ATR(14) below the range low and no more than 1.25 ATR(14) beyond it |
| Expansion filter | Signal candle true range at least 1.10 ATR(14) |
| Close-location filter | Long signals close in the upper 35% of the candle range; short signals close in the lower 35% |
| Entry | Next daily open after the completed breakout candle |
| Stop | Beyond the breakout signal candle extreme with a 0.25 ATR(14) buffer |
| Target comparison | Fixed 1.5R target from entry |
| False-break exit | Exit at daily close if price closes back inside the old 20-candle range after entry |
| Maximum holding review | 20 daily candles after entry |
The review records trade count, win rate, average win in R, average loss in R, expectancy in R, profit factor, maximum drawdown in R, worst losing streak, average holding period, pair-level behavior, direction-level behavior, exit reasons, and spread/slippage sensitivity.
| Cost Input | Assumptions Used |
|---|---|
| Spread | 0.5, 1.5, and 3.0 pips |
| Slippage | 0.1, 0.5, and 1.0 pips per side |
| Baseline comparison | 1.5-pip spread and 0.5-pip slippage per side |
| Swap and rollover | Not included |
Educational Sensitivity-Test Results
The hypothetical backtest used public yfinance daily OHLC data from 2016-06-29 through 2026-06-29 where available. The baseline cost assumption used a 1.5-pip spread and 0.5-pip slippage per side. The baseline result was negative, with expectancy of -0.0898R and total net result of -2.8741R.
| Metric | Baseline Result |
|---|---|
| Number of trades | 32 |
| Win rate | 25.0% |
| Average win | 1.37R |
| Average loss | -0.5764R |
| Expectancy | -0.0898R |
| Profit factor | 0.7922 |
| Maximum drawdown | -4.4815R |
| Worst losing streak | 7 |
| Average holding period | 1.25 daily candles |
| Median holding period | 1.0 daily candles |
| Total net result | -2.8741R |
Using the reported rounded average win of 1.37R and average loss magnitude of 0.5764R, the break-even win rate at those same average outcomes would be approximately 29.6% (0.5764 / (1.37 + 0.5764)). The observed 25% win rate was lower. This is an arithmetic illustration derived from the published figures, not an additional backtest result.
| Pair | Trades | Win Rate | Expectancy | Profit Factor | Max Drawdown | Total Net R |
|---|---|---|---|---|---|---|
| EURUSD | 10 | 40.0% | 0.2841R | 2.1288 | -1.188R | 2.8411R |
| GBPUSD | 3 | 33.33% | 0.4259R | 12.0786 | -0.0307R | 1.2776R |
| USDJPY | 4 | 25.0% | -0.1949R | 0.6422 | -1.1456R | -0.7798R |
| AUDUSD | 5 | 0.0% | -0.4537R | 0.0 | -2.2254R | -2.2687R |
| USDCAD | 2 | 50.0% | 0.698R | 22.2587 | 0.0R | 1.396R |
| USDCHF | 8 | 12.5% | -0.6676R | 0.2015 | -4.4232R | -5.3404R |
| Direction | Trades | Win Rate | Expectancy | Profit Factor | Max Drawdown | Total Net R |
|---|---|---|---|---|---|---|
| Long | 16 | 25.0% | -0.0434R | 0.885 | -2.4027R | -0.6951R |
| Short | 16 | 25.0% | -0.1362R | 0.7203 | -3.975R | -2.179R |
| Spread (pips) | Slippage Per Side (pips) | Expectancy | Profit Factor | Max Drawdown | Total Net R |
|---|---|---|---|---|---|
| 0.5 | 0.1 | -0.0197R | 0.9489 | -3.7944R | -0.6305R |
| 0.5 | 0.5 | -0.0509R | 0.8748 | -4.0998R | -1.6277R |
| 0.5 | 1.0 | -0.0898R | 0.7922 | -4.4815R | -2.8741R |
| 1.5 | 0.1 | -0.0587R | 0.8575 | -4.1761R | -1.8769R |
| 1.5 | 0.5 | -0.0898R | 0.7922 | -4.4815R | -2.8741R |
| 1.5 | 1.0 | -0.1288R | 0.719 | -5.3198R | -4.1206R |
| 3.0 | 0.1 | -0.1171R | 0.7401 | -4.9656R | -3.7467R |
| 3.0 | 0.5 | -0.1482R | 0.6854 | -5.9101R | -4.7438R |
| 3.0 | 1.0 | -0.1872R | 0.6235 | -7.0908R | -5.9903R |
| Exit Reason | Count |
|---|---|
| false break close | 13 |
| stop first same bar | 1 |
| stop loss | 10 |
| target 1 5r | 8 |
Testing And Review Before Live Trading
A forex breakout strategy should be reviewed on historical examples or demo conditions before it is used with real funds. The purpose is not to find perfect breakouts. The purpose is to check whether the same level rules, confirmation rules, stop rules, target rules, and false-breakout rules can be followed repeatedly.
Record both taken and skipped trades. Skipped trades matter because many breakout losses come from late entries, weak levels, unclear stops, and repeated re-entries after failed breaks.
- Record the level or pattern before the breakout appears.
- Record the breakout type: horizontal, trendline, channel, squeeze, ORB, retest, or news-driven.
- Record whether the entry was immediate, close-confirmed, pending, or retest-based.
- Record whether the stop and target were known before entry.
- Record whether spread, margin, and position size were checked before entry.
- Record whether price returned inside the structure and how the rule handled it.
- Compare trades that followed the plan with trades that broke it.
Forex Breakout Strategy Checklist
Before a breakout becomes a trade, each item below should already be clear.
- Define the breakout level before price reaches it.
- Check whether the market is trending, ranging, compressing, expanding, or unclear.
- Choose the entry type before the breakout: immediate, close confirmation, pending order, or retest.
- Check whether spread and volatility still fit the target.
- Define the stop where the breakout idea becomes invalid.
- Choose position size only after the stop distance is known.
- Set the target by structure, range height, measured move, ATR, partial exit, trail, or time rule.
- Write the false-breakout rule before entry.
- Skip the trade if price has already moved too far from the planned area.
- Skip the trade if news risk changes spread or speed beyond the plan.
- Stop trading when the daily loss, drawdown, or trade-count rule is reached.
- Review whether the trade followed the plan, not only whether it made or lost money.