Current weekly forecast: This outlook covers 18–24 October 2026 and remains valid until 24 October 2026, unless its stated invalidation condition is triggered earlier.
In brief
AUD/USD retains a bearish weekly bias as negative D1 momentum and bearish H4 structure outweigh mixed closes and stable volatility.
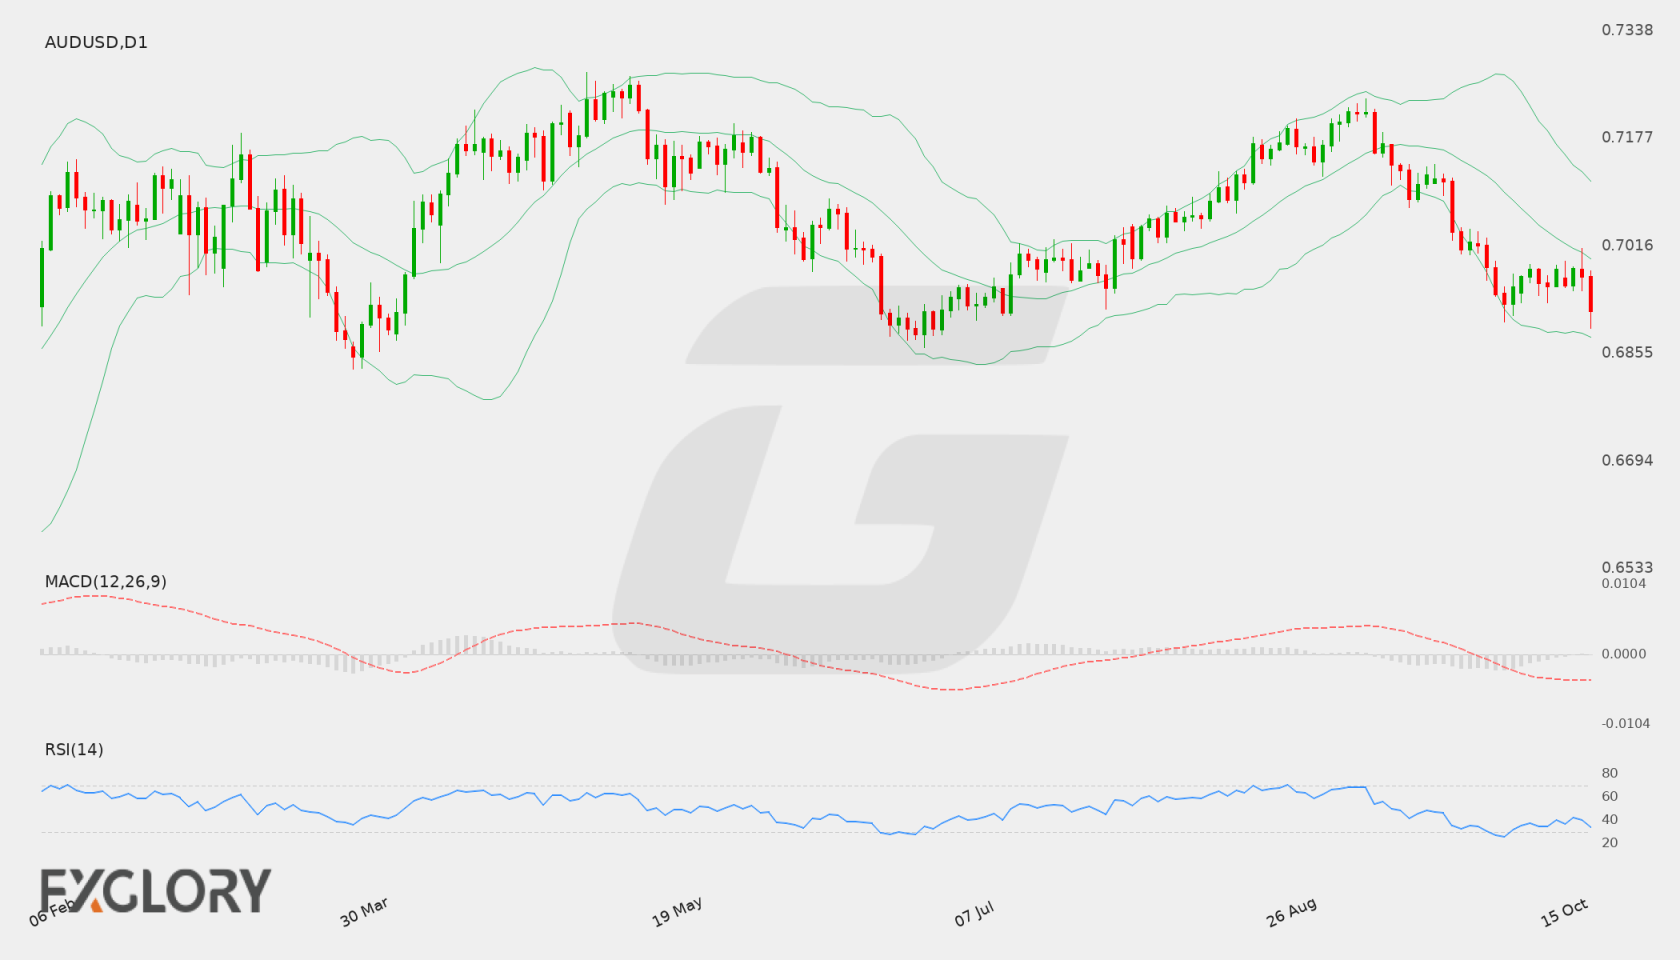
The weekly thesis is led by the D1 trend state, which is bearish, with the 0.69194 close below the EMA20 at 0.69978, EMA50 at 0.70396, SMA200 at 0.70411 and Bollinger middle band at 0.69966. Negative momentum reinforces that structure: RSI(14) is 33.7 and MACD remains below its signal, with a histogram of -9.2e-5.
The picture is not without counterpressure. D1 closes are mixed, the SMA200 slope is rising, and stable volatility does not imply directional acceleration. H4 remains bearish but its positive MACD histogram of 3.5e-5 and RSI of 46.98 show that tactical downside pressure is not fully uniform. The key weekly framework is support at 0.68928 and 0.68639, against resistance at 0.69586 and 0.69884.
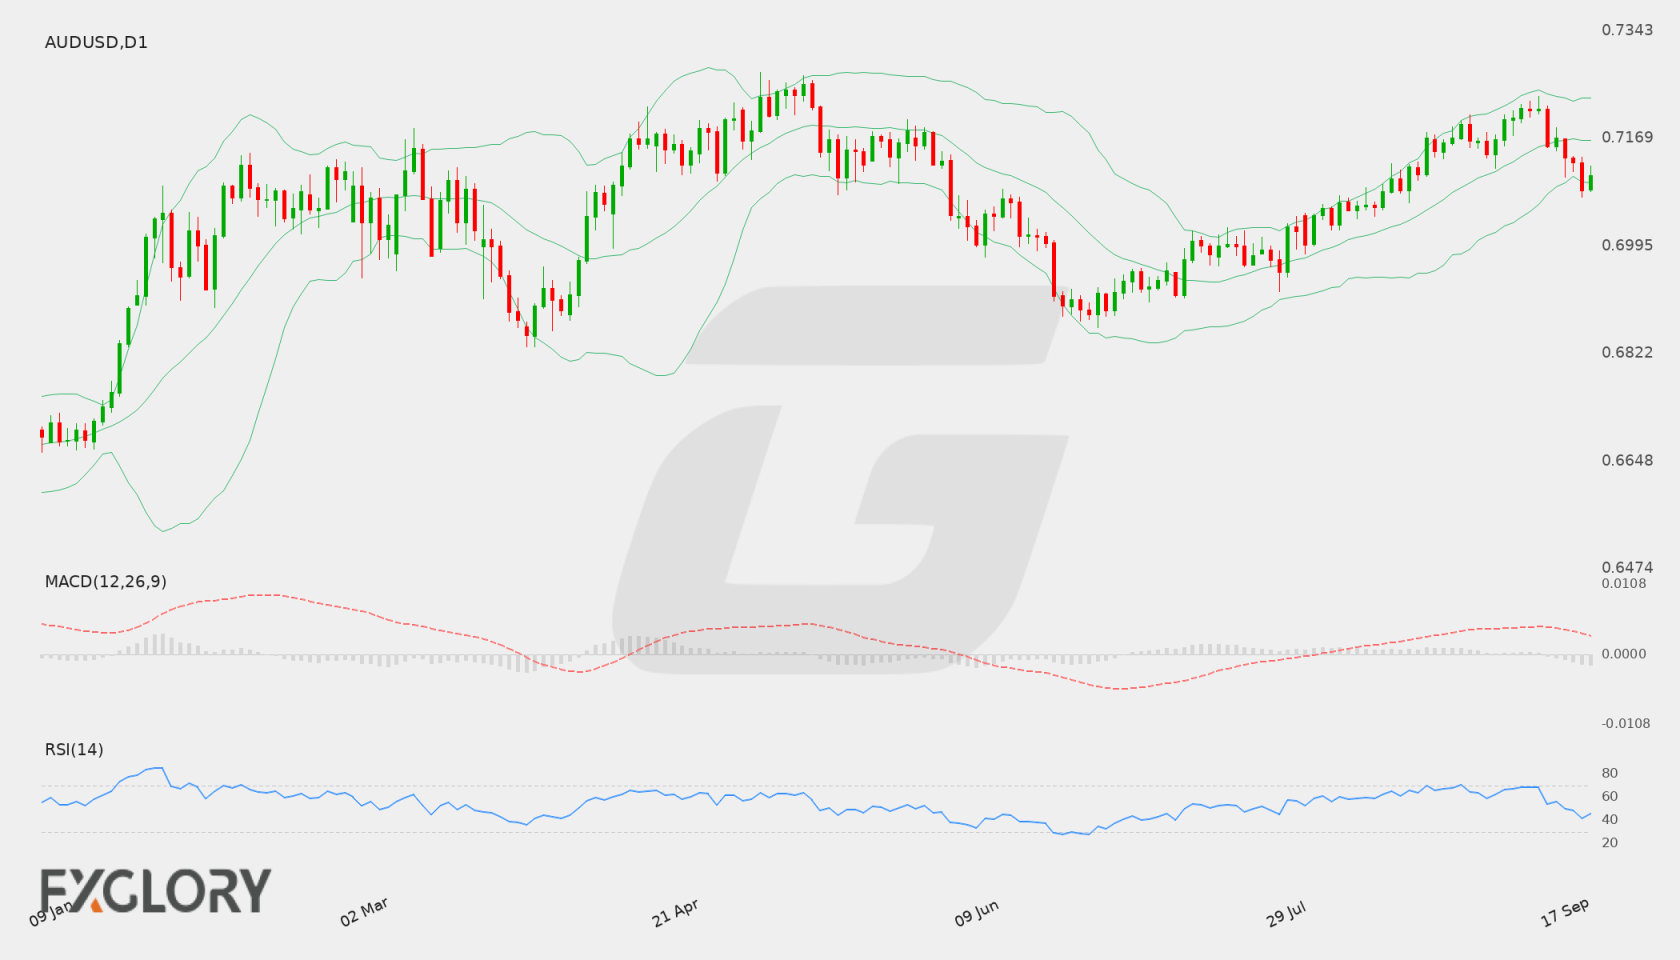
AUD/USD D1 technical-analysis context for the weekly forecast. Chart data captured 18 October 2026.
AUD/USD has a bearish weekly bias as negative D1 momentum supports the bearish trend, while bullish H4 conditions create a tactical countertrend risk.
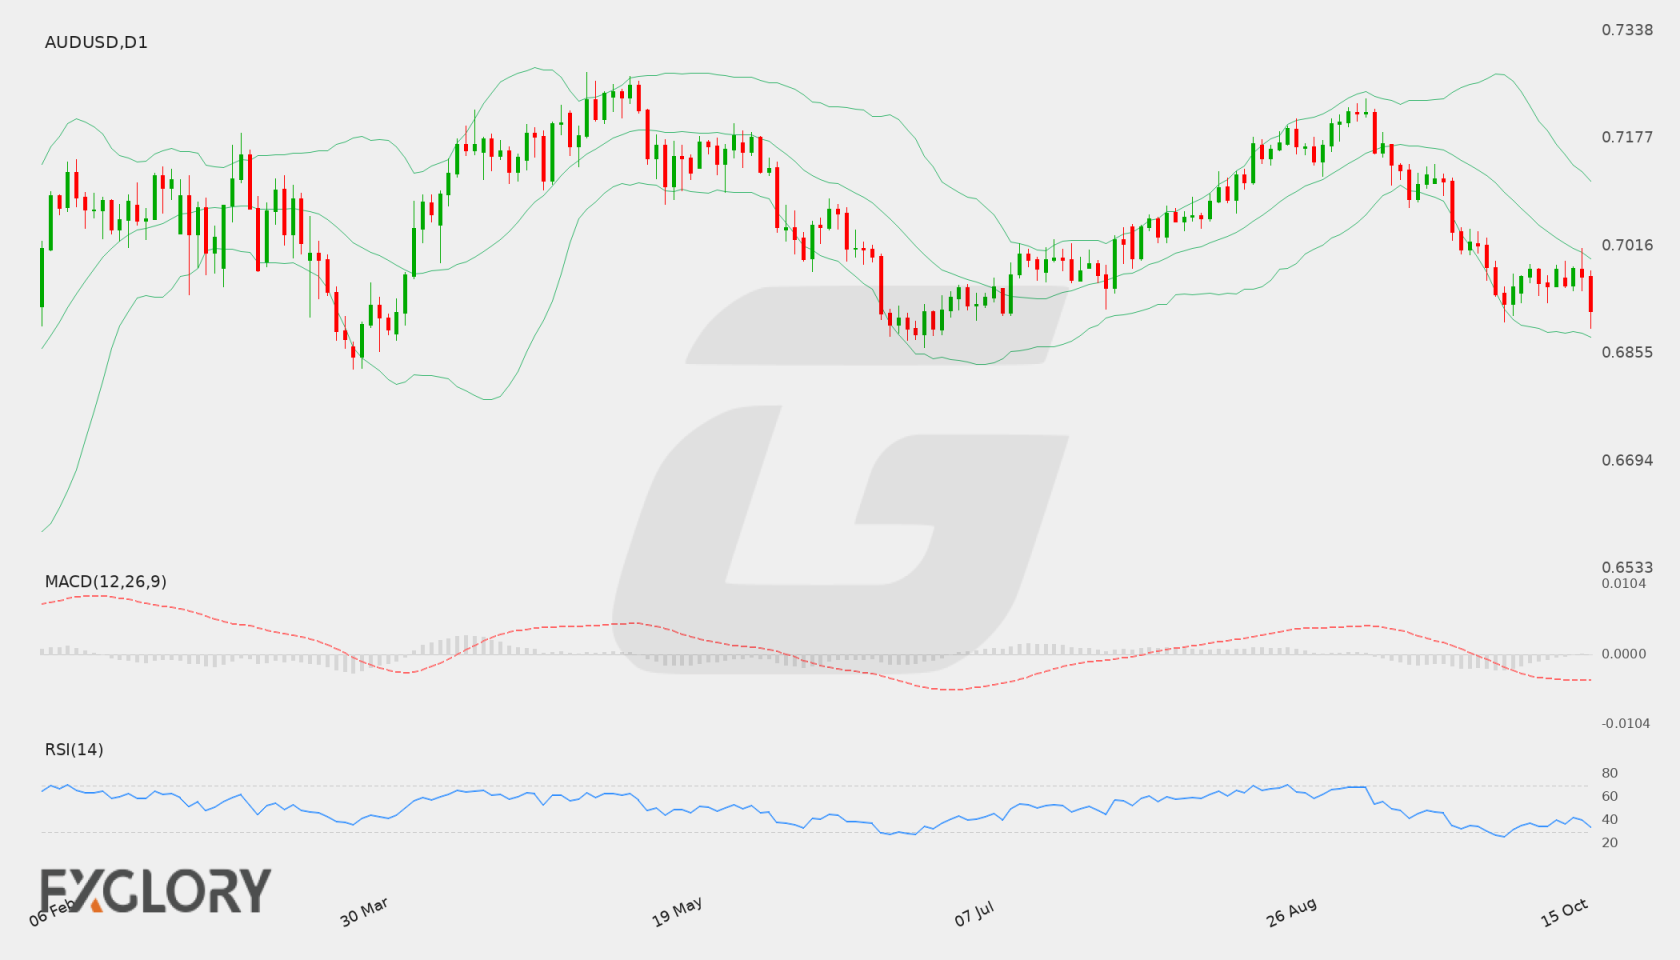
The D1 framework remains the controlling influence: the trend state is bearish, momentum is negative, the EMA50 slope is falling, and the reference close at 0.69562 is below the EMA20, EMA50 and SMA200 readings. The mixed D1 close sequence prevents the structure from being treated as one-sided.
H4 currently leans bullish, with positive MACD readings and price above its middle Bollinger level, so a recovery toward the resistance area remains a credible alternative. The weekly thesis would be materially weakened by one completed D1 close above 0.70393; support at 0.6921 and 0.68865 remains central to the bearish path.
AUD/USD D1 technical-analysis context for the weekly forecast. Chart data captured 16 October 2026.
Fundamental drivers for AUD/USD (AUDUSD) this week center around key United States economic releases that could sway currency valuation and broader market sentiment. Significant attention will be on the ISM Services PMI and the FOMC Meeting Minutes, alongside Unemployment Claims and preliminary readings for University of Michigan Consumer Sentiment and Inflation Expectations. Shifts in US economic activity and monetary policy considerations highlighted in these releases may guide market participants evaluating the pair.
Price Action:
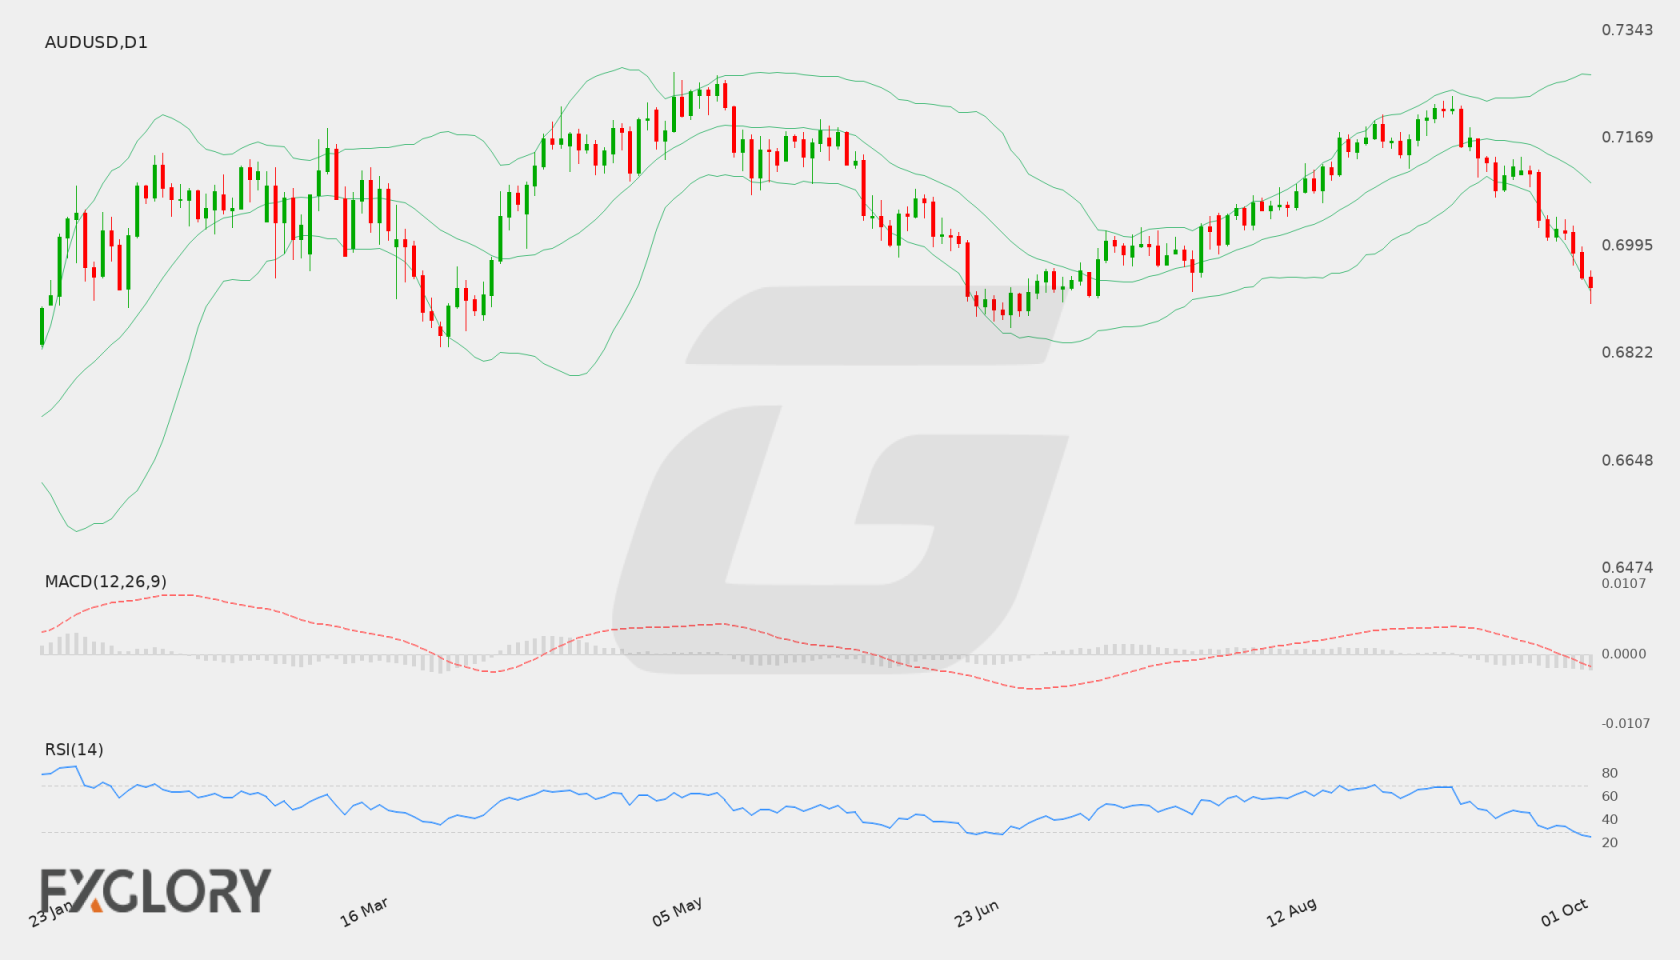
AUD/USD (AUDUSD) has exhibited a persistent downward trajectory across recent daily sessions, sliding from levels above 0.7200 down to the latest daily close at 0.69298. Consecutive lower closes highlight consistent selling interest, leaving the pair testing lower ground relative to its broader daily range.
Key Technical Indicators:
Bollinger Bands: Daily Bollinger Bands show a middle band baseline at 0.70969, an upper band at 0.72722, and a lower band at 0.69216. AUD/USD is currently pressing directly against its lower band, closing at 0.69298, which reflects pronounced downward momentum and band expansion.
RSI: The 14-period Daily RSI is currently reading 25.57. This level places AUD/USD in oversold territory below the standard 30 benchmark, signaling strong downside pressure while remaining an indicator of extended conditions rather than a guaranteed rebound.
MACD: The daily MACD for AUD/USD stands at -0.00428, remaining in negative territory. This negative value indicates that downward momentum continues to dominate price action on the daily timeframe.
Support and Resistance:
Key technical levels for AUD/USD (AUDUSD) are defined by support at 0.69025 and primary resistance at 0.72364. The middle Bollinger Band at 0.70969 also acts as an intermediate technical reference point on the daily chart.
News to Watch for AUDUSD This Week:
ISM Services PMI: This release measures activity in the services sector and provides an updated snapshot of overall business health.
FOMC Meeting Minutes: The central bank records detail policy deliberations and present perspectives regarding future interest rate paths.
Unemployment Claims: The weekly count of jobless filings provides timely insight into labor market trends.
Prelim UoM Inflation Expectations: This indicator measures anticipated price changes from the consumer perspective.
Prelim UoM Consumer Sentiment: The preliminary confidence survey reflects household views on personal finances and broader economic conditions.
Weekly Outlook and Consideration:
The weekly outlook for AUD/USD (AUDUSD) on the daily chart remains influenced by bearish technical momentum, with the pair closing at 0.69298. Prices hover near the lower Bollinger Band at 0.69216 and close to immediate support at 0.69025. Although a 14-day RSI of 25.57 highlights oversold conditions and MACD sits at -0.00428, overhead resistance at 0.72364 remains distant. Potential market volatility may develop around high-impact US economic events, including the ISM Services PMI and FOMC Meeting Minutes.
Disclaimer: The analysis provided for AUD/USD is for informational purposes only and does not constitute investment advice. Traders are encouraged to perform their own analysis and research before making any trading decisions. Market conditions can change quickly, so staying informed with the latest data is essential.
The fundamental environment for AUD/USD is influenced by central bank communications from Australia alongside key economic activity indicators from the United States. Traders are closely monitoring the economic outlook from the Reserve Bank of Australia and US manufacturing trends to gauge potential shifting interest rate expectations and broad risk sentiment across global currency markets.
Price Action:
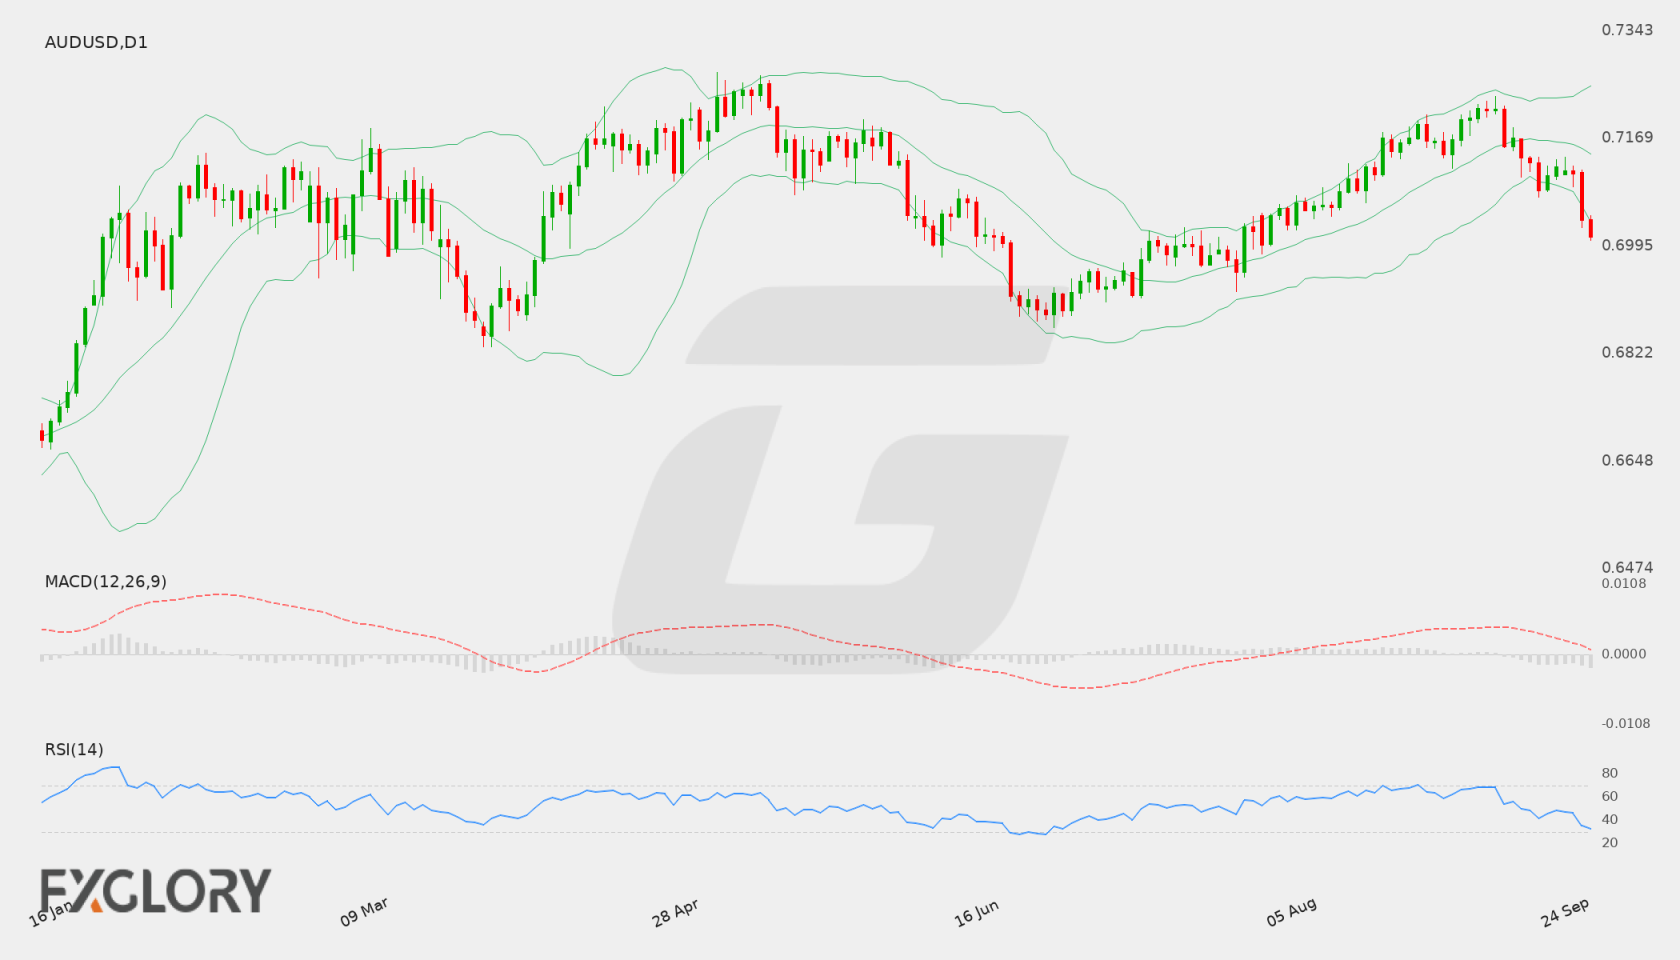
On the Daily (D1) chart, AUD/USD (AUDUSD) has exhibited persistent downward movement over recent trading sessions. Price action shows a decline from recent higher levels above 0.7200, eventually bringing the currency pair down to close at 0.70109, maintaining a clear short-term bearish tone.
Key Technical Indicators:
Bollinger Bands: The Bollinger Bands display a middle band around 0.71440, with the upper band positioned at 0.72537 and the lower band at 0.70343. The latest daily close of 0.70109 has breached below the lower band, signaling intense downside selling momentum and potential extension past standard volatility boundaries.
RSI: The 14-day Relative Strength Index (RSI) stands at 32.49. Moving close to the oversold threshold of 30, the indicator highlights strong prevailing downward momentum while suggesting that heavy selling could eventually trigger technical consolidation.
MACD: The Moving Average Convergence Divergence (MACD) line registers at -0.00129. Remaining in negative territory below the zero line, the MACD reinforces the ongoing bearish momentum currently dominating daily price developments.
Support and Resistance:
Key technical benchmarks for AUD/USD identify primary support at 0.69052, which serves as a major downside target should selling continue. On the upside, overhead resistance is situated at 0.72364, marking a significant barrier for any prospective bullish recoveries.
News to Watch for AUDUSD This Week:
RBA Press Conference: Provides insights into the monetary policy stance and economic projections of the Australian central bank.
ISM Manufacturing PMI: Measures operational health in the US manufacturing sector to offer direction on US economic strength.
ISM Manufacturing Prices: Highlights inflation dynamics within US manufacturing supply chains that could influence monetary policy.
Weekly Outlook and Consideration:
The weekly technical outlook for AUD/USD remains leaning toward the downside based on Daily chart signals. The pair closed at 0.70109, breaking below the lower Bollinger Band (0.70343) while supported by a negative MACD of -0.00129 and an RSI reading of 32.49. Continued selling pressure may drive price action toward the primary support level at 0.69052. Conversely, if oversold conditions prompt a corrective bounce, initial upside momentum could aim back toward the middle Bollinger Band near 0.71440 before approaching the main resistance level at 0.72364. Upcoming economic updates like the RBA Press Conference and US manufacturing reports will be critical factors determining market direction.
Disclaimer: The analysis provided for AUD/USD is for informational purposes only and does not constitute investment advice. Traders are encouraged to perform their own analysis and research before making any trading decisions. Market conditions can change quickly, so staying informed with the latest data is essential.
AUD/USD fundamental dynamics continue to be shaped by interest rate expectations and economic indicators from both Australia and the United States. Key domestic factors include monetary policy announcements and inflation metrics, while US employment data and price indices provide critical direction for the exchange rate.
Price Action:
On the daily (D1) chart, AUD/USD recently experienced a retreat from the 0.7216 area toward 0.7086 before closing at 0.71088. Recent daily candles show short-term selling pressure after the pair was unable to sustain momentum above the 0.7200 handle.
Key Technical Indicators:
Bollinger Bands: The Daily Bollinger Bands feature a middle band at 0.71660, an upper band at 0.72342, and a lower band at 0.70978. Trading at 0.71088, AUD/USD is positioned near the lower band, reflecting recent downside momentum below the 20-day moving average.
RSI: The 14-day RSI stands at 45.61, placing AUD/USD in a neutral zone below the 50 level. This suggests modest bearish momentum without signaling oversold conditions.
MACD: The daily MACD indicator registers a value of 0.00112. Although remaining slightly above the zero line, the reading shows diminishing bullish momentum following the recent pullback from recent highs.
Support and Resistance:
Key daily technical levels reveal primary support at 0.68639 and upper resistance at 0.72364. Additionally, the lower Bollinger band around 0.70978 provides immediate technical structure.
News to Watch for AUDUSD This Week:
Cash Rate: This decision directly impacts borrowing costs and yields for the Australian dollar.
RBA Rate Statement: Provides insights into monetary policy outlook and economic evaluation from the central bank.
RBA Press Conference: Offers clarification on recent rate decisions and future policy trajectories.
CB Consumer Confidence: Reflects US consumer sentiment which can influence consumer spending and dollar valuation.
JOLTS Job Openings: Indicates labor market demand and economic strength in the United States.
CPI y/y: Measures annual inflation pressure in Australia affecting interest rate expectations.
Trimmed Mean CPI m/m: Tracks core inflation trends by excluding extreme price shifts.
CPI m/m: Signals monthly changes in consumer goods and services prices.
ADP Non-Farm Employment Change: Estimates private sector payroll additions prior to official employment data.
Core PCE Price Index m/m: Serves as a key inflation metric tracked by the Federal Reserve.
Final GDP q/q: Reflects the overall economic growth rate for the United States.
ISM Manufacturing PMI: Assesses activity levels within the US manufacturing sector.
Average Hourly Earnings m/m: Tracks wage growth trends which influence inflationary pressure.
Non-Farm Employment Change: Evaluates job creation outside the farming sector as a major indicator of US labor health.
Unemployment Rate: Highlights the percentage of the US workforce that is unemployed.
Weekly Outlook and Consideration:
AUD/USD enters the week trading near 0.71088, positioned below its daily middle Bollinger band of 0.71660 and close to the lower band at 0.70978. With an RSI of 45.61 and a MACD of 0.00112, technical indicators align with a neutral-to-soft tone. A sustained move above 0.71660 could encourage a retest of resistance at 0.72364, while continued pressure below the middle band keeps focus on support at 0.68639. Upcoming economic releases from both economies are likely to drive near-term directional bias.
Disclaimer: The analysis provided for AUD/USD is for informational purposes only and does not constitute investment advice. Traders are encouraged to perform their own analysis and research before making any trading decisions. Market conditions can change quickly, so staying informed with the latest data is essential.