AUDUSD Forecast

AUD iconUSD icon
AUD/USD

Australian Dollar vs US Dollar

AUD/USD Live Price

0.70655
-0.03%

AUD/USD Forecast — 21 May 2026

Time Zone: GMT +3

Time Frame: 4 Hours (H4)

Fundamental Analysis:

The AUDUSD H4 technical and fundamental analysis is expected to remain highly sensitive to upcoming PMI, employment, and inflation expectation releases from Australia, alongside key US economic indicators and Federal Reserve commentary. On the Australian side, traders are closely monitoring Manufacturing PMI, Services PMI, Consumer Inflation Expectations, Employment Change, and the Unemployment Rate, all of which are critical indicators for evaluating the strength of the Australian economy and future Reserve Bank of Australia monetary policy decisions. Stronger Australian economic data could provide temporary support for the AUD; however, slowing employment or weaker PMI readings may intensify bearish pressure on the pair. On the USD side, attention remains focused on the Philadelphia Fed Manufacturing Index, Jobless Claims, Building Permits, Housing Starts, PMI releases, and speeches from Federal Reserve officials. Overall, the current AUDUSD daily analysis and forex forecast suggests that stronger US economic sentiment combined with weakening Australian momentum could continue favoring the US Dollar in the medium term.

Price Action:

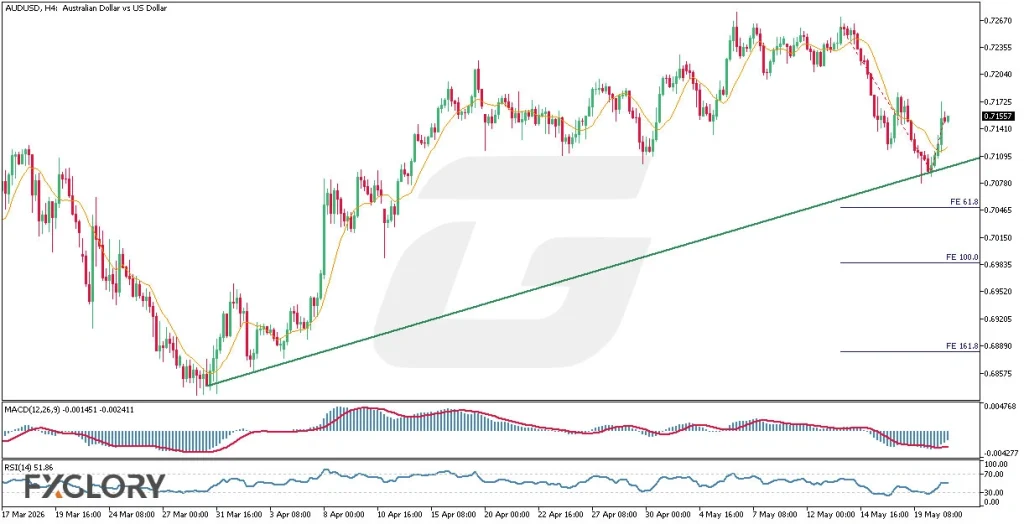
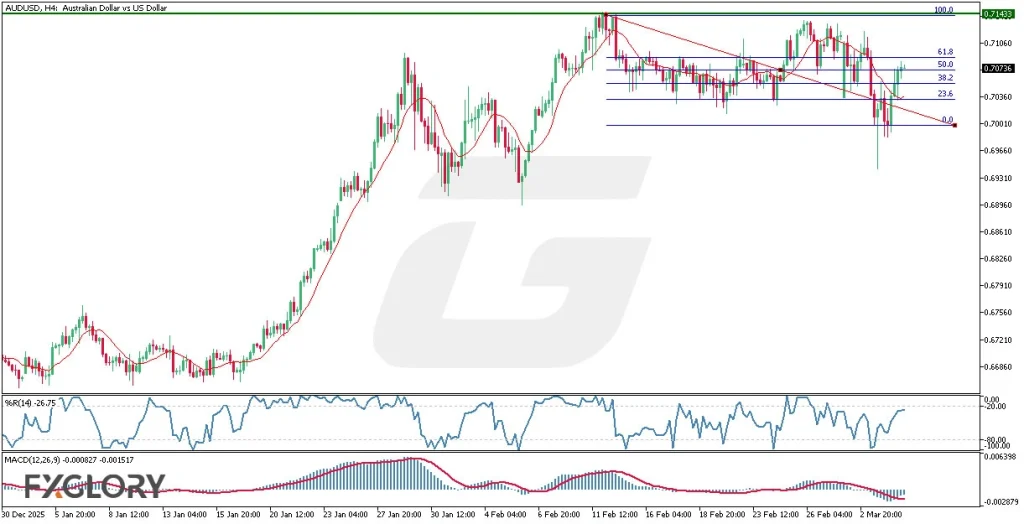
The AUDUSD H4 price action analysis shows that despite the pair maintaining a strong bullish structure for a prolonged period, the candles have recently entered a corrective bearish phase. After sharply declining toward the ascending support trendline, the market managed to bounce upward temporarily as buyers defended the support area. However, the recent recovery appears relatively weak, and the candles are once again beginning to gravitate lower toward the support line. In addition, the formation of a hidden bearish divergence on the chart suggests that bearish continuation pressure remains active beneath the surface. Based on the current AUDUSD H4 chart analysis, a stronger downside move and a possible breakdown below the support trendline may become increasingly probable if selling momentum accelerates further.

Key Technical Indicators:

Moving Average (10): The 10-period Moving Average is currently positioned below the candles and continues moving upward, reflecting that the broader bullish structure has not yet been fully invalidated. However, the narrowing distance between the candles and the moving average suggests weakening bullish momentum and increasing downside pressure.

MACD (12,26,9): The MACD currently reads -0.001451 and -0.002411, indicating that bearish momentum remains dominant despite the recent upward correction. Although the histogram shows signs of slight recovery, the MACD line remaining below the signal line continues supporting the bearish outlook in the current AUDUSD H4 technical analysis.

RSI (14): The RSI is currently at 51.86, positioning the market near neutral territory. This suggests that while the market still retains some bullish strength, momentum has weakened considerably compared to the previous uptrend, allowing room for additional bearish pressure if sellers regain control.

Support and Resistance:

Support: The nearest support level is located around 0.70870, aligning with the ascending bullish support trendline that has repeatedly supported price rebounds.

Resistance: The immediate resistance zone appears near 0.71557, followed by the stronger resistance area around 0.72040, where previous bearish reactions intensified.

Conclusion and Consideration:

The current AUDUSD H4 technical analysis and price action forecast reflects weakening bullish momentum after a prolonged upward trend, with the market increasingly vulnerable to a bearish continuation move. While the ascending support trendline continues holding for now, the hidden bearish divergence combined with weakening MACD momentum suggests that a breakdown below support could become more likely in upcoming sessions. Technical indicators such as the RSI and Moving Average continue reflecting a market in transition between bullish recovery and renewed bearish pressure. Fundamentally, upcoming Australian employment and PMI releases alongside major US economic data and Federal Reserve speeches may significantly increase volatility and determine the pair’s next directional move.

Disclaimer: The analysis provided for AUD/USD is for informational purposes only and does not constitute investment advice. Traders are encouraged to perform their own analysis and research before making any trading decisions on AUDUSD. Market conditions can change quickly, so staying informed with the latest data is essential.

AUDUSD-H4-Technical-and-Fundamental-Analysis-for-05.21.2026

AUD/USD Forecast — 4 May 2026

Time Zone: GMT +3

Time Frame: 4 Hours (H4)


Fundamental Analysis:

The AUDUSD currency pair is likely to remain sensitive to both Australian Dollar and US Dollar fundamental analysis today, with traders focusing on RBA-related guidance, Australian household spending data, US PMI releases, JOLTS job openings, trade balance, New Home Sales, Fed speakers, and broader geopolitical risk headlines. Stronger-than-expected US ISM Services PMI, S&P Global Services PMI, labor-market data, or hawkish comments from Fed officials could support the USD and pressure the AUD/USD H4 chart outlook. On the AUD side, a hawkish RBA tone, resilient household spending, or stronger inflation-related commentary could help the Australian Dollar recover against the US Dollar. However, ongoing Middle East and Strait of Hormuz tension may increase safe-haven demand for the USD, making today’s AUD-USD daily technical and fundamental analysis especially dependent on risk sentiment, price action confirmation, and intraday volatility.

Price Action:

AUDUSD H4 is showing a loss of upside pressure after price failed near the first resistance zone around 0.7200, where several candles printed rejection wicks around the upper Bollinger Band. The latest candles suggest a mild bearish shift, with a rejection candle followed by a small two-candle selling sequence and a lower-high formation, pointing to short-term profit taking rather than a confirmed trend reversal. Price is currently hovering near the upper Fibonacci retracement area and close to the 23.6% level, meaning the AUDUSD price action analysis remains in a sideways-to-bullish consolidation phase unless sellers break the nearby support zone. A sustained move below 0.7150 may expose the mid-Fibonacci support area, while holding above this level could keep the pair supported for another bullish retest.

Key Technical Indicators:

Bollinger Bands(14): The AUD-USD H4 Bollinger Bands show price rejecting from the upper band near resistance, signaling a loss of bullish pressure. Price remains in the upper half of the bands, but a move below the middle band would support a deeper bearish correction.

MACD(12,26,9): The MACD is still above the zero line, suggesting the broader momentum has not fully turned bearish. However, the fading histogram and flattening lines indicate weakening upside momentum and possible short-term consolidation.

RSI(14): The RSI is around 46, showing that AUD/USD momentum has cooled into neutral-to-slightly-bearish territory. Since the RSI is not oversold, sellers still have room to push price lower if support breaks.

Support and Resistance:

Support: Immediate support is located around 0.7150, near the 23.6% Fibonacci zone and the recent consolidation area on the AUDUSD H4 chart. A deeper support area is seen around 0.7100, aligning with the 38.2% and 50.0% Fibonacci retracement levels if bearish momentum increases.

Resistance: Immediate resistance is located around 0.7200, where the price recently rejected near the upper Bollinger Band and the 0.0% Fibonacci area. A confirmed breakout above 0.7225 could reopen bullish continuation potential toward fresh higher highs on the AUDUSD H4 technical chart.

Conclusion and Consideration:

The AUDUSD H4 technical and fundamental analysis shows that the pair remains in a broader recovery structure, but short-term upside pressure is weakening after rejection near the 0.7200 resistance area. Bollinger Bands, MACD, RSI, and Fibonacci retracement levels all suggest that AUDUSD may enter a consolidation or mild bearish correction phase unless buyers defend the 0.7150 support zone. Fundamental catalysts from US PMI, JOLTS, trade balance, housing data, Fed speeches, RBA communication, and geopolitical risk headlines could create sharp volatility in the AUDUSD daily chart analysis. Traders should monitor whether price holds above support for a renewed bullish attempt or breaks lower toward the 38.2% and 50.0% Fibonacci retracement zones.

Disclaimer: The analysis provided for AUD/USD is for informational purposes only and does not constitute investment advice. Traders are encouraged to perform their own analysis and research before making any trading decisions on AUDUSD. Market conditions can change quickly, so staying informed with the latest data is essential.

FXGlory-Daily-Analysis-AUDUSD-H4-Technical-and-Fundamental-Analysis-for-05.05.2026

AUD/USD Forecast — 29 April 2026

Time Zone: GMT +3

Time Frame: 4 Hours (H4)

Fundamental Analysis:

The AUDUSD H4 technical and fundamental analysis is strongly influenced by today’s Australian CPI data and several major US economic releases. For the Australian Dollar, inflation figures are highly important because stronger-than-expected CPI can increase expectations for tighter Reserve Bank of Australia policy, supporting the AUD. On the US side, traders are watching Building Permits, Housing Starts, Durable Goods Orders, Goods Trade Balance, Wholesale Inventories, Crude Oil Inventories, and the FOMC-related events. Strong US data or a hawkish Federal Reserve tone could support the USD and pressure the AUDUSD price action. Therefore, today’s AUDUSD daily analysis suggests that volatility may increase, especially if inflation or Fed signals surprise the market.

Price Action:

The AUDUSD H4 price action analysis shows that after a strong bullish momentum, the pair has reached a key resistance area between 0.71716 and 0.71982. Although the candles managed to break this zone once, the price is still struggling to hold firmly above it, showing short-term indecision. The broader chart structure remains mostly bullish, with buyers continuing to defend higher levels after the recent upward move. Current candles are consolidating near the resistance zone, which may act as a decision area for the next trend direction. If buyers regain momentum, the AUDUSD H4 forecast could favor bullish continuation after this temporary pause.

Key Technical Indicators:

Bollinger Bands: The candles are trading above the middle Bollinger Band, supporting the bullish structure. The expanding bands suggest rising volatility and the possibility of trend continuation.

MACD: The MACD values at 0.000804 and 0.000484 show that bullish momentum remains present. However, the modest gap between the lines suggests buyers may need stronger confirmation.

Williams %R: The Williams %R reading at -24.60 indicates that the pair is close to overbought territory. This supports bullish strength, but also warns of possible short-term hesitation near resistance.

Support and Resistance:

Support: The key support level is located at 0.71716, which now acts as the nearest price floor if the pair pulls back from the current zone.

Resistance: The main resistance level stands at 0.71982, marking the upper boundary of the current resistance area on the AUDUSD H4 chart.

Conclusion and Consideration:

The overall AUDUSD H4 technical analysis shows that the pair remains in a bullish structure, but price is currently facing resistance near the 0.71716–0.71982 zone. Bollinger Bands expansion supports the possibility of continued volatility, while MACD still reflects positive momentum. However, the Williams %R reading near overbought territory suggests that traders should be cautious about chasing the move without confirmation. Fundamentally, Australian CPI data and US economic releases may create strong movement in the AUDUSD chart daily analysis. A confirmed breakout above resistance could support bullish continuation, while failure to hold this area may trigger a corrective pullback.

Disclaimer: The analysis provided for AUD/USD is for informational purposes only and does not constitute investment advice. Traders are encouraged to perform their own analysis and research before making any trading decisions on AUDUSD. Market conditions can change quickly, so staying informed with the latest data is essential.

AUDUSD-H4-Technical-and-Fundamental-Analysis-for-04.29.2026

AUD/USD Forecast — 30 March 2026

Time Zone: GMT +3

Time Frame: 4 Hours (H4)

Fundamental Analysis:

The AUD/USD H4 technical and fundamental analysis today is heavily influenced by upcoming high-impact USD news, particularly multiple speeches from Federal Reserve officials including John Williams, Austan Goolsbee, and Michael Barr. These events are critical as they may provide forward guidance on US monetary policy, with any hawkish tone likely to strengthen the USD and pressure the AUDUSD pair lower. Additionally, key US economic indicators such as the House Price Index (HPI), CB Consumer Confidence, Chicago PMI, and JOLTS Job Openings will shape market sentiment, reinforcing USD strength if data beats expectations. On the geopolitical front, statements regarding US-Iran tensions could increase risk aversion, typically benefiting the USD as a safe-haven currency. Overall, the fundamental outlook in this AUD USD daily analysis H4 suggests bearish pressure driven by USD strength and cautious market sentiment.

Price Action:

The AUDUSD H4 price action analysis indicates a bearish trend structure, with the pair forming lower highs and lower lows over recent sessions. The price has recently faced rejection near a short-term resistance zone and is now moving downward with increasing bearish momentum. The candlestick structure shows a series of bearish candles dominating the recent price movement, signaling strong seller control. Additionally, the pair appears to be breaking below a consolidation range, suggesting continuation of the downtrend in this AUD-USD technical analysis H4 forecast.

Key Technical Indicators:

Ichimoku Cloud: The price is trading below the Ichimoku cloud, confirming a strong bearish trend in this AUDUSD H4 technical analysis. The Tenkan-sen is below the Kijun-sen, reinforcing bearish momentum, while the cloud ahead is widening, indicating increasing trend strength. The lagging span is also below price action, supporting further downside potential. This setup suggests continued bearish pressure in the short term.

MACD (12,26,9): The MACD values are at -0.003337 and -0.003389, indicating negative momentum with the MACD line below the signal line. The histogram is also in negative territory, confirming increasing bearish momentum. This suggests that selling pressure is strengthening, and the current downtrend is likely to continue. Traders should watch for further divergence or expansion in histogram bars for confirmation.

RSI (14): The RSI is currently at 32.34, approaching oversold territory but not yet fully exhausted. This indicates strong bearish momentum while still leaving room for further downside movement. The RSI suggests that the market is under selling pressure, though a short-term corrective bounce could occur if oversold conditions are reached. Overall, RSI aligns with the bearish outlook in this AUD USD H4 price action analysis.

Support and Resistance:

Support: Immediate support is located near 0.6835, aligning with the 61.8% Fibonacci retracement and recent swing lows.

Resistance: Nearest resistance is seen around 0.7155, corresponding to recent rejection zones and minor consolidation highs.

Conclusion and Consideration:

This AUD/USD H4 technical and fundamental analysis highlights a strong bearish trend supported by price action structure, Ichimoku cloud positioning, and momentum indicators such as MACD and RSI. The pair is likely to continue its downward movement toward key Fibonacci levels unless a significant fundamental catalyst shifts sentiment. Traders should closely monitor upcoming USD news releases and Federal Reserve speeches, as they may increase volatility and reinforce USD strength. In this AUDUSD daily analysis H4 forecast, the bias remains bearish while below key resistance levels, with potential continuation toward lower support zones.

Disclaimer: The analysis provided for AUD/USD is for informational purposes only and does not constitute investment advice. Traders are encouraged to perform their own analysis and research before making any trading decisions on AUDUSD. Market conditions can change quickly, so staying informed with the latest data is essential.

AUDUSD_H4_Technical and Fundamental analysis for 03.31.2026

AUD/USD Forecast — 5 March 2026

Time Zone: GMT +2

Time Frame: 4 Hours (H4)

Fundamental Analysis:

In today’s AUDUSD fundamental analysis, the USD may be the main volatility driver due to Initial Jobless Claims, Challenger Job Cuts, and potential hawkish/dovish signals from FOMC member Michelle Bowman, all of which can quickly shift rate expectations and USD demand. The EIA Natural Gas Storage report may also influence USD sentiment through the inflation/energy channel. On the AUD side, the listed Australian indicators are key drivers longer term, but with their next releases scheduled later, near-term AUDUSD H4 moves may lean more on risk sentiment and the USD news flow.

Price Action:

From the AUDUSD H4 price action view, after topping near 0.71433, price formed a lower-high bearish structure before entering a stronger bullish correction that pushed back above the Fibonacci 50.0 area. If buying pressure holds, price may test the 61.8 retracement next, and a clean breakout above the nearby resistance zone would strengthen the bullish continuation scenario. Rejection from that area would keep the move classified as a corrective rebound within the broader H4 pullback.

Key Technical Indicators:

Moving Average (10): The MA(10) is below the candles, supporting short-term bullish momentum; a close back under it would signal fading buying pressure.

Williams %R (14): This reading shows price is near the top of its recent range and buyers are active; approaching overbought territory means pullback risk increases if momentum stalls.

MACD (12,26,9): MACD remains negative (recent bearish bias), but improving momentum could lead to a bullish shift; a renewed drop would confirm the rebound is only a correction.

Support and Resistance:

Support: The nearest support sits around 0.70010, a key swing-zone that aligns with the lower boundary of the recent move and a critical area for bullish defense. A deeper support reference is the long lower-wick reaction area just below this zone, which signals demand stepping in on dips.

Resistance: The first meaningful resistance is around 0.70736, which lines up with the mid-range ceiling and prior reaction structure. Above that, the 0.71060–0.71433 region represents the higher resistance band (Fibonacci upper levels and the prior peak), where sellers previously regained control.

Conclusion and Consideration:

This AUDUSD H4 technical analysis and forecast highlights a market transitioning from a lower-high bearish phase into a stronger bullish correction, now attempting to extend toward the Fibonacci 61.8 area. As long as price holds above the short-term MA(10) and Williams %R stays supported, buyers may continue pressing higher—but the still-negative MACD suggests caution until momentum fully confirms. From a technical and fundamental chart daily analysis, USD-side catalysts (Jobless Claims and Fed speaker tone) can quickly accelerate either a breakout above resistance or a rejection back toward support, so risk management around the listed levels remains essential.

Disclaimer: The analysis provided for AUD/USD is for informational purposes only and does not constitute investment advice. Traders are encouraged to perform their own analysis and research before making any trading decisions on AUDUSD. Market conditions can change quickly, so staying informed with the latest data is essential.

AUDUSD_H4_Technical_and_Fundamental_Analysis_For_02.05.2026

1AUD = –––USD –––%
AUDUSD
Loading chart...