
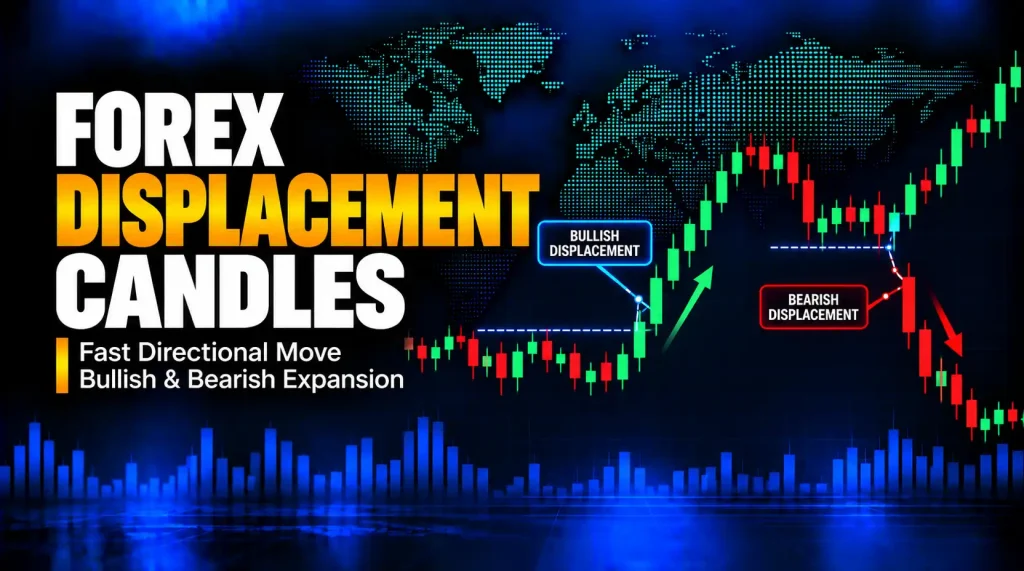
What Is Displacement in Forex Trading?
Displacement in forex describes a relatively fast, decisive price move in one direction, often visible as one unusually large candle or a short run of strong candles. In price-action and Inner Circle Trader (ICT) / smart-money-concepts (SMC) terminology, traders look for it when a currency pair moves away from a range or significant level with more force than the recent candles. The word describes what price did, not who traded or whether the move will continue.
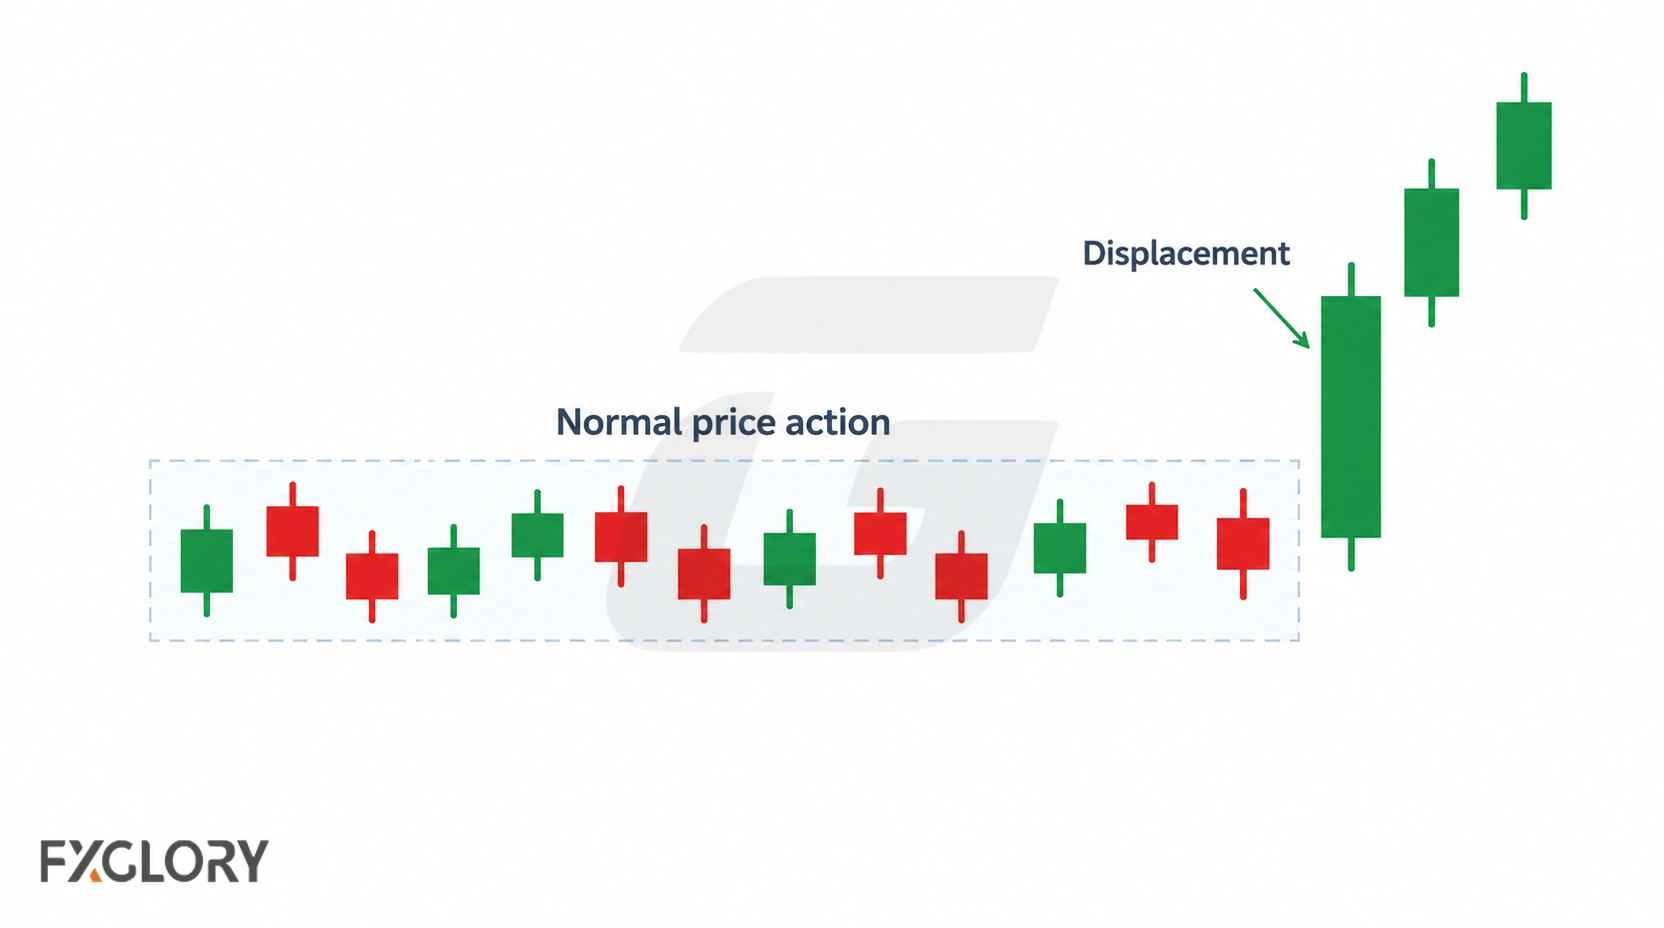
For example, EUR/USD may spend several 15-minute candles moving only a few pips at a time, then print a much larger bullish candle that closes beyond a previously marked swing high. That is a candidate bullish displacement. A similarly decisive downward move is bearish displacement. Neither event is a complete trading strategy or evidence of a guaranteed reversal or breakout.
Displacement is therefore different from volatility in general. Volatility describes how much prices fluctuate; displacement emphasizes a one-sided move relative to nearby price action. A volatile period can alternate between long bullish and bearish candles without producing a convincing directional leg.
How to Identify a Displacement Candle
Do not decide from candle size alone. Start by choosing one currency pair and timeframe, then compare the move against recent candles on that same chart. The strongest candidates combine a relatively large real body, decisive directional closing prices, a quick move away from an important area and a context that makes the move meaningful.
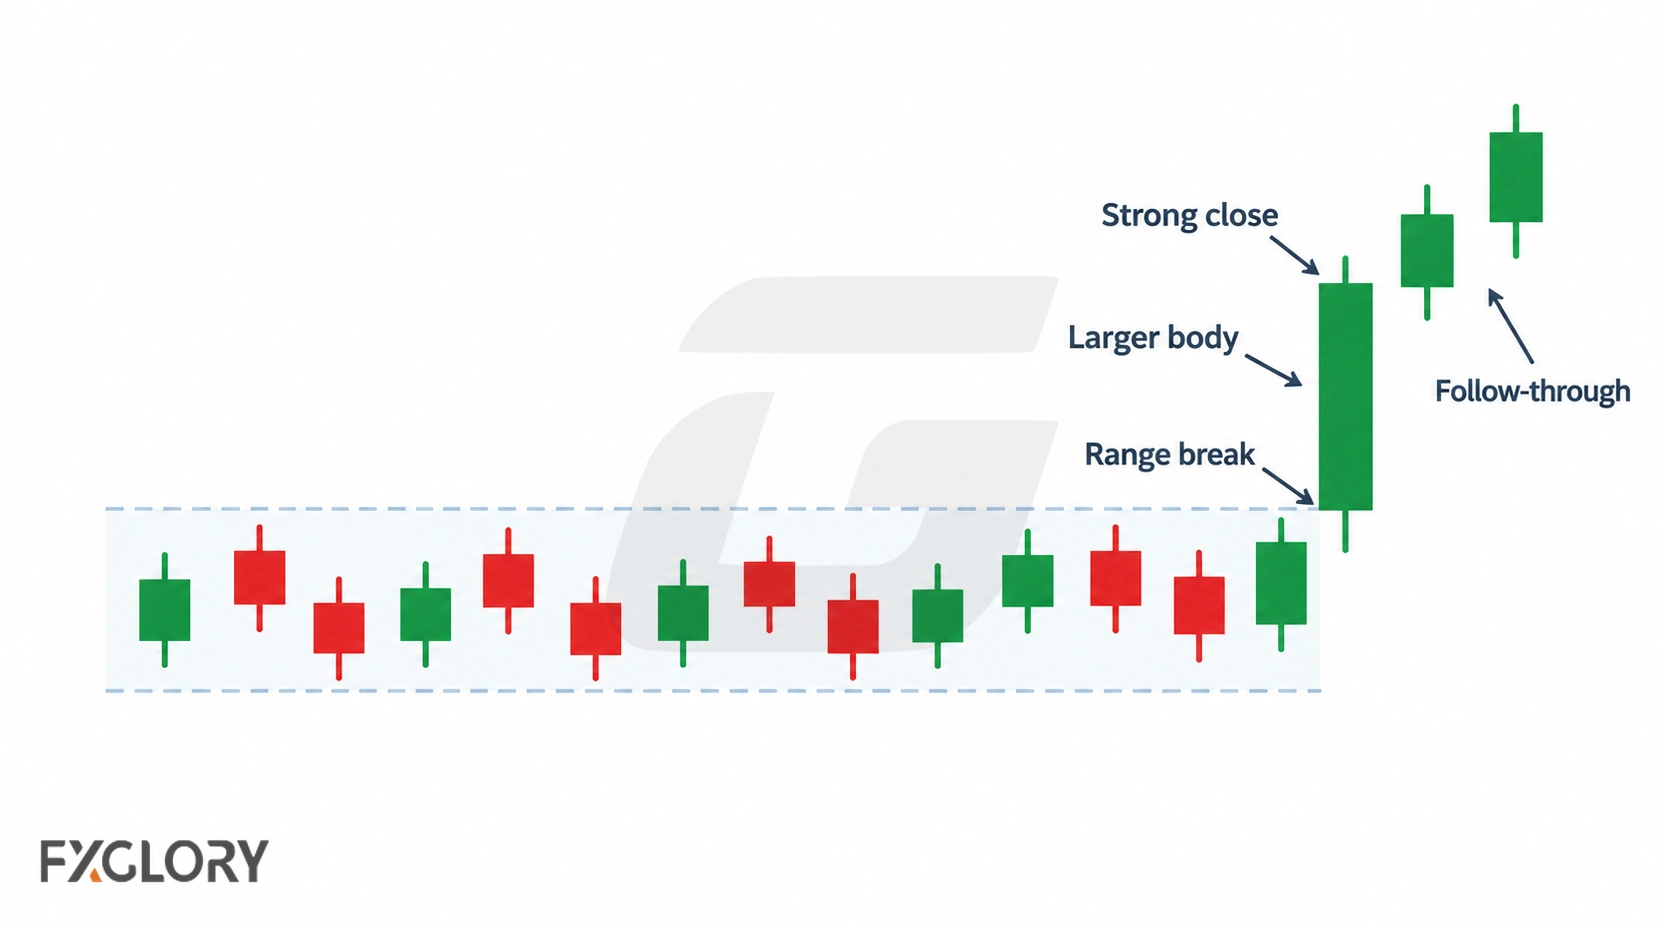
| Feature | What to examine | Important limitation |
|---|---|---|
| Body size | The absolute distance between open and close compared with nearby candle bodies | No universal minimum pip count or body-size multiplier |
| Close and wicks | Closes toward the directional end; limited counter-directional rejection | Large wicks or a sharp reversal can weaken the interpretation |
| Pace | A marked distance traveled over one or several candles | Timeframe changes the apparent size and speed |
| Location | Departure from a range or a significant swing, support or resistance area | A sudden move in the middle of congestion may have little structural value |
| Follow-through | Whether subsequent closes hold the move or rapidly give it back | Follow-through is unknown when the first candle closes |
One candle or three candles?
Some ICT teaching frameworks emphasize several consecutive large-bodied candles, often three. Other traders recognize a single exceptionally strong candle as a displacement candidate. There is no universal three-candle law: use an explicit definition when journaling or testing, and do not switch definitions after seeing the outcome. A single big candle can also be a fleeting news spike rather than sustained directional pressure.
Measure strength relative to the recent market
A 12-pip candle may stand out dramatically in one EUR/USD session and look ordinary in another. A simple educational comparison is candle real body (|close − open|) divided by the average real body of a defined number of preceding bars. This compares the candidate with local conditions, but it is only a descriptive ratio, not a validated threshold or buy/sell signal. Inspect spreads and news timing as well as the chart.
Bullish vs Bearish Displacement in Forex
What a bullish displacement candle shows
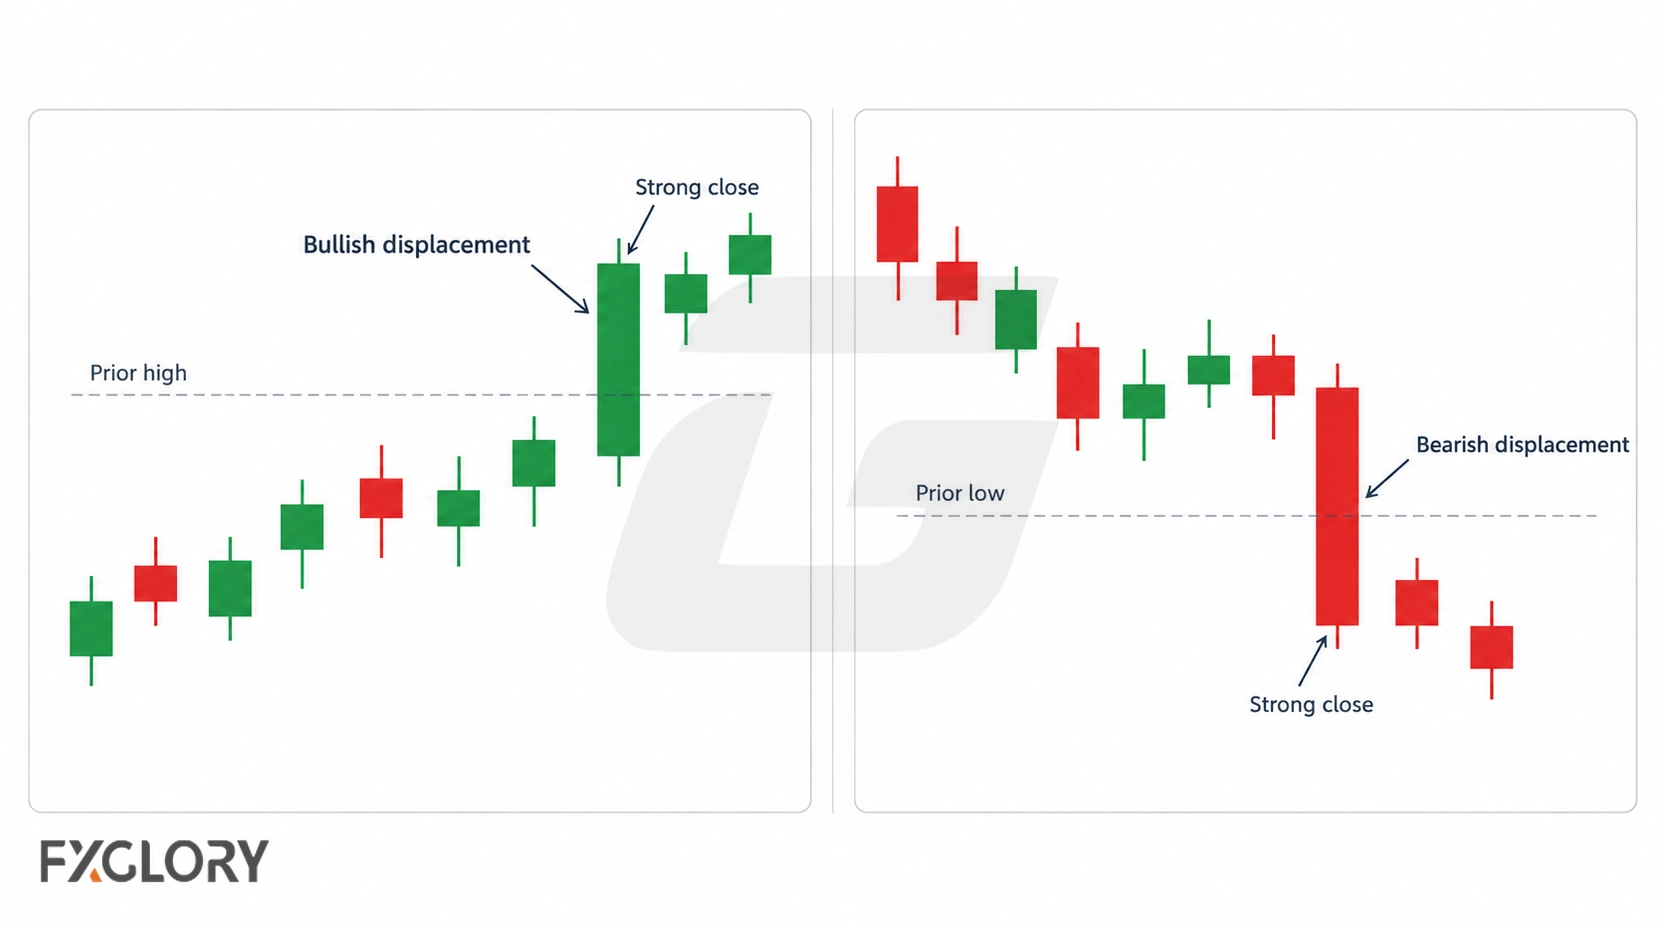
Bullish displacement is a sharp upward price expansion. A bullish candle closes above its open with an unusually large body relative to preceding candles; a series of strong upward closes can strengthen the description. If it also closes above a clearly defined prior swing high, the move may support a bullish structure-break interpretation. That still does not prove the breakout will hold.
For a candidate strong bullish displacement candle, distinguish the body from its wick: a wick that briefly trades above resistance, followed by a close back inside the prior range, is less convincing than a substantial body closing beyond that level. The location and next candles are as important as the adjective “strong.”
What a bearish displacement candle shows
Bearish displacement is the mirrored case: a sharp downward expansion, with a relatively large bearish body and a close near the lower part of the candle or a short run of dominant lower closes. A close below a prior swing low can add structural significance. A long lower wick and immediate reclaim of the broken level instead suggest rejection or a potential false break.
Both directions can appear during trends or reversals. Bullish does not always mean a new uptrend has started; bearish does not establish a lasting downtrend. The label should describe the leg first and leave the forecast open.
Displacement and Market Structure: BOS, CHoCH and MSS
Displacement becomes more informative when it is read together with forex market structure: swing highs, swing lows and which levels price has actually closed beyond.
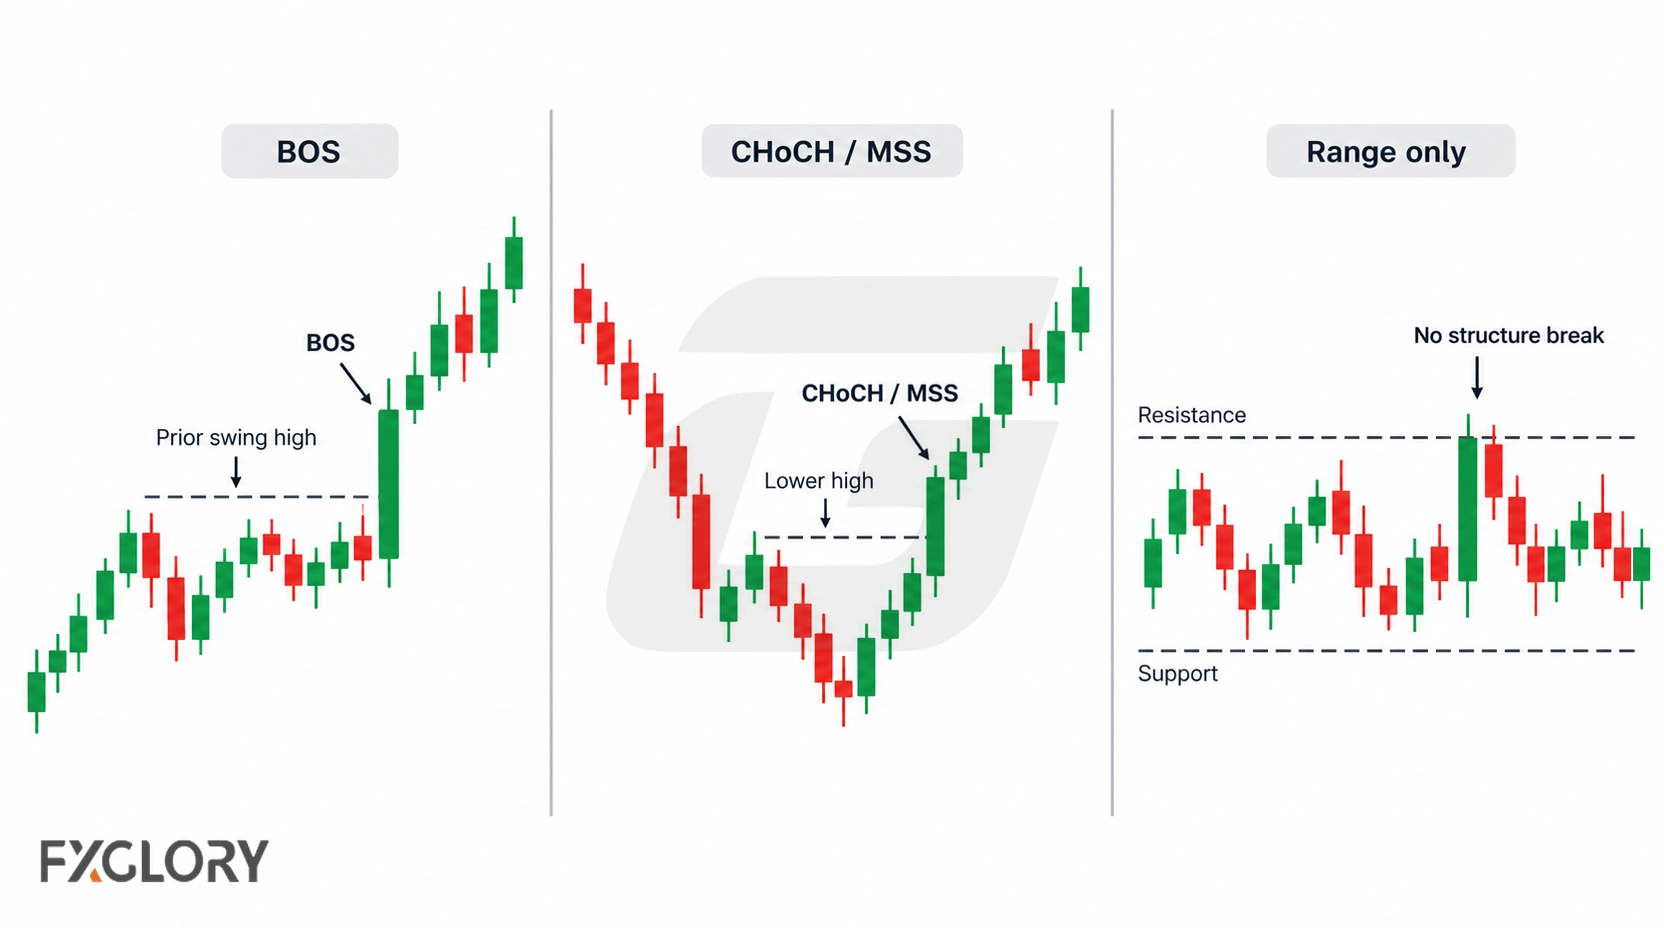
- Break of structure (BOS): a break in the direction of the prevailing structural sequence. Displacement can make that break visually decisive, but the level and prevailing trend still have to be defined.
- Change of character (CHoCH) or market structure shift (MSS): terms used in different price-action systems for an early change or shift in structure. A fast leg through an opposing swing may support that reading; terminology and confirmation rules vary between systems.
- Fast move without a structure break: displacement may occur inside a wider range. A large body alone is not a BOS or a confirmed market shift.
Mark the relevant swing before the candle forms. If a trader repeatedly chooses a different swing level after each outcome, the pattern cannot be reviewed consistently. A market-structure label also does not establish why the price moved or who placed the orders.
Displacement vs Fair Value Gaps and Order Blocks
These expressions often appear together in ICT and SMC explanations, but they describe different things. Displacement is the fast directional movement. A fair value gap (FVG) is a particular price-zone pattern, commonly identified when the first and third candles in a three-candle sequence have non-overlapping wicks. For a bullish FVG, the first candle's high is below the third candle's low; the bearish relationship is reversed. Such a gap can appear within a displacement leg, but it is not mandatory for every trader's displacement definition.
An order block is a chart zone convention, often associated with a preceding opposite-direction candle or an area at the origin of a decisive move. It is a location, not the move itself. Neither a plotted FVG nor an order-block rectangle independently verifies institutional order flow.
Displacement vs Liquidity Sweeps and Swing Failure Patterns
A liquidity sweep is a commonly used description for a temporary move through a visible swing high or low. A swing failure pattern (SFP) emphasizes the failure to maintain that break, usually with price moving back across the earlier swing level. Displacement is different: it describes the force and direction of a price leg, whether that leg occurs before, during or after a failed breakout.
For instance, EUR/USD may briefly dip beneath a prior low, then reverse sharply upward. The move below the low can be described as a sweep; the failure to remain below can be an SFP; the subsequent rapid upward candles can be bullish displacement. These are related observations, not three independent confirmations or proof that traders' stop orders caused the reversal.
FXGlory has a separate Swing Failure Pattern (SFP) lesson on failed swing breaks. The present lesson focuses on the strength of the resulting directional candle or leg rather than teaching that setup again.
Worked EUR/USD Examples: Measuring a Candidate Move
The two cases below are invented teaching examples, not a historical price record, test result or trading recommendation. Assume EUR/USD on a 15-minute chart, with a pip equal to 0.0001. Prices are illustrative single-series OHLC chart values; real platforms may chart Bid prices and show a separate Ask quote. No spread, fee, order entry or fill is being modeled.
| Chart observation | Bullish example | Bearish example |
|---|---|---|
| Prior four real bodies | 3, 4, 2, 5 pips | 3, 4, 2, 5 pips |
| Candidate open → close | 1.0820 → 1.0835 | 1.0875 → 1.0861 |
| Candidate low / high | 1.0818 / 1.0837 | 1.0859 / 1.0877 |
| Candidate real body | 15 pips upward | 14 pips downward |
| Reference swing | Prior high: 1.0830 | Prior low: 1.0865 |
| Close beyond swing | 5 pips above prior high | 4 pips below prior low |
| Body / prior average | 15 / 3.5 ≈ 4.29× | 14 / 3.5 = 4.00× |
Check the arithmetic: The four earlier candle bodies average (3 + 4 + 2 + 5) / 4 = 3.5 pips. For the bullish case, (1.0835 − 1.0820) / 0.0001 = 15 pips, and its close exceeds 1.0830 by 5 pips. For the bearish case, (1.0875 − 1.0861) / 0.0001 = 14 pips, and its close is 4 pips beneath 1.0865. Both examples have 2-pip upper and lower wicks under the stated OHLC values.
These body ratios only illustrate a transparent comparison against recent activity. Neither 4.29× nor 4.00× has a demonstrated success probability. A hypothetical confirmation check might ask whether the next 15-minute closes remain beyond the broken swing. If the bullish example quickly closes back below 1.0830, or the bearish example back above 1.0865, the original breakout interpretation is weakened. These are review conditions, not promised stop-order execution prices.
Real trade planning would additionally require a defined order type, Bid/Ask convention, entry trigger, stop/invalidation level, position size, spread/commission assumptions and a plan for slippage. Those cannot be inferred from chart bodies alone.
When a Displacement Signal Can Fail
A forceful move is easy to notice after the fact. It is harder to establish, at the time of the candle close, that the move will persist. Common failure or misinterpretation cases include:
- News-driven whipsaw: a release produces a long body that is immediately erased or followed by an opposite spike.
- Thin market conditions: limited liquidity and wider spreads make apparent momentum more difficult or costly to act on.
- False structure break: price closes beyond a swing, then promptly returns to the earlier range.
- Conflicting timeframe: a dramatic five-minute candle is just a small pullback inside a much larger hourly trend.
- Hindsight selection: the trader chooses the comparison window or swing level after knowing which move worked.
- Execution gap: charted highs and lows, order triggers and actual fills differ because of Bid/Ask quotes, commissions or slippage.
Volatility, quoted liquidity and trading-session timing may also alter candle interpretation. FXGlory's guide to why forex spreads widen explains why the same fast-moving period can increase transaction costs. An intended breakout can fail even if the chart observation itself was accurate.
Practical Displacement Checklist
Use a consistent journal template rather than hunting for ideal-looking examples after they work:
- Choose the instrument and timeframe. For example, EUR/USD on M15; do not compare its candles directly with a different timeframe.
- Mark the level beforehand. Identify the swing or trading-range boundary the market might challenge.
- Define the comparison. Record the real-body sizes of a fixed number of preceding candles; note unusual wicks and opposing closes.
- Wait for a completed candle. A partially formed candle may shrink or reverse by its close.
- Separate the observations. Was the move fast? Did it close beyond the marked level? Was an FVG present? These are separate questions.
- Describe invalidation. Decide what subsequent price action would undermine the proposed structure-break interpretation; do not claim it guarantees order execution.
- Check conditions and costs. Review nearby news, session liquidity, Bid/Ask spreads and the possibility of slippage.
- Review without hindsight. Save the chart at recognition time and compare both successful and failed cases across enough observations before drawing performance conclusions.
If the candidate is merely a large candle in noisy trading, lacks a meaningful reference level or retraces immediately, a neutral no-decision classification may be more useful than calling every burst a setup.
Key Takeaway: Displacement Describes Movement, Not Certainty
In forex trading, displacement means an unusually decisive directional leg when judged against nearby candles and market structure. Bullish and bearish versions can be studied using the same body-size, wick, closing-price and level checks. A fair value gap may accompany the move, but is not universally required; the move does not by itself prove institutional involvement or predict an entry that will work.
The practical next step is to compare saved examples objectively, distinguish structure from simple momentum, and account for spreads and execution before treating any chart pattern as part of a trading plan.