SILVER Forecast

SILVER iconUSD icon
Silver

SPOT Silver Ounce vs US Dollar

Silver Live Price

69.97700
-0.70%

Silver Forecast — 11 May 2026

Time Zone: GMT +3

Time Frame: 4 Hours (H4)

Fundamental Analysis:

The Silver H4 technical and fundamental analysis remains heavily influenced by US economic expectations and overall market sentiment toward safe-haven assets. Traders are currently monitoring the Federal Reserve Bank of Cleveland’s inflation expectations data and US Existing Home Sales figures, both of which can impact the US Dollar and precious metals volatility. Higher inflation expectations may increase demand for precious metals such as Silver as investors seek inflation hedges, while stronger US housing data could support the USD and pressure metals prices. Since Silver is highly sensitive to interest rate expectations and Dollar strength, any hawkish tone surrounding the Federal Reserve outlook may create additional volatility in the Silver H4 chart daily analysis. Overall, today’s market environment suggests that macroeconomic sentiment and US economic data may continue driving short-term XAGUSD price action.
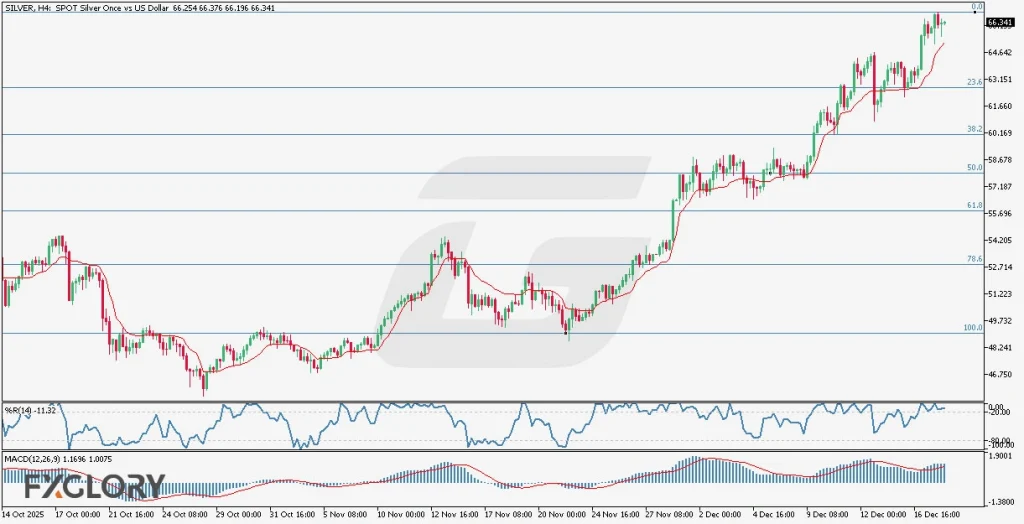
Price Action:

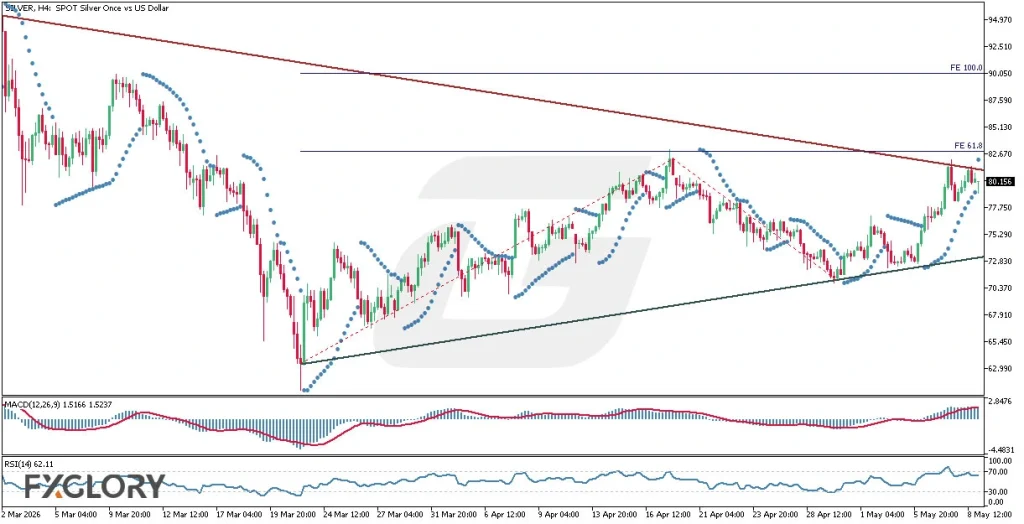
The Silver H4 price action analysis shows that despite the broader bearish trend dominating the chart over the recent period, the pair has also been forming a gradually rising support line. Previously, the candles attempted to break below this ascending support structure, but sellers failed to maintain downside momentum, leading to a strong bullish rebound from the support area. The recent bullish move has pushed the candles back toward the major descending resistance line, where price is currently testing an important breakout zone. This structure suggests the possibility of a larger symmetrical triangle formation developing on the chart. If buyers successfully break above the current resistance and maintain bullish continuation, the Silver H4 forecast could target the Fibonacci Expansion 61.8 level in the medium term.

Key Technical Indicators:

Parabolic SAR: Despite the SAR dots remaining below the candles for an extended period, a new dot has recently appeared above the latest candles. This may indicate early signs of weakening bullish momentum or the beginning of a temporary correction phase.

MACD (12,26,9): The MACD values at 1.5166 and 1.5237 show that bullish momentum remains active, although the MACD line is slightly below the signal line. This suggests that upward momentum may be slowing despite the recent bullish recovery.

RSI (14): The RSI at 62.11 supports a bullish market structure, remaining comfortably above the neutral 50 level. However, the indicator is approaching overbought territory, which may lead to temporary consolidation near resistance.

Support and Resistance:

Support: The nearest support is aligned with the rising ascending trendline, which has repeatedly triggered bullish rebounds after previous pullbacks.

Resistance: The key resistance is located near the major descending trendline, where the latest bullish candles are currently facing rejection pressure.

Conclusion and Consideration:

The overall Silver H4 technical analysis suggests that although the broader market trend has been bearish, buyers are gradually regaining strength through the formation of a rising support structure. The recent sharp rebound from support indicates that bullish sentiment remains active, especially as price approaches the major descending resistance area. Technical indicators such as RSI and MACD continue supporting bullish momentum, although the new Parabolic SAR signal warns that short-term hesitation or consolidation may occur. From a broader perspective, a confirmed breakout above the resistance trendline could significantly strengthen the bullish outlook and support a move toward the Fibonacci Expansion 61.8 target. Fundamentally, US inflation expectations and housing-related data may become important catalysts for the next move in the XAGUSD H4 technical and fundamental analysis.

Disclaimer: The analysis provided for XAG/USD is for informational purposes only and does not constitute investment advice. Traders are encouraged to perform their own analysis and research before making any trading decisions on XAGUSD. Market conditions can change quickly, so staying informed with the latest data is essential.

Silver-H4-Technical-and-Fundamental-Analysis-for-05.11.2026

Silver Forecast — 1 April 2026

Time Zone: GMT +3

Time Frame: 4 Hours (H4)

Fundamental Analysis:

Silver (XAGUSD) is currently influenced by key US economic events, including ADP Non-Farm Employment Change, Retail Sales, and PMI/ISM reports, which are critical indicators of economic strength and consumer spending. Stronger-than-expected US data typically supports the US Dollar, placing downward pressure on Silver due to their inverse relationship. Additionally, speeches from Federal Reserve officials such as Alberto Musalem and Michael Barr may introduce volatility, as hawkish tones could reinforce expectations of tighter monetary policy. Overall, today’s fundamental landscape suggests heightened volatility with a slight bearish bias unless data disappoints.

Price Action:

The H4 chart of Silver shows a clear bearish trend with a sequence of lower highs, reinforced by a descending trendline. However, recent price action indicates a bullish recovery attempt, with candles forming a tightening structure resembling a symmetrical triangle near support. Price is currently testing the trendline resistance, suggesting increasing buying pressure. A breakout above this level could shift momentum to the upside, while rejection would maintain the broader bearish outlook.

Key Technical Indicators:

Bollinger Bands (35): The Bollinger Bands have narrowed significantly, indicating low volatility and a likely upcoming breakout. Price is approaching the upper band, reflecting increasing bullish pressure.

MACD (12,26,9): The MACD shows a bullish crossover with the histogram turning positive, suggesting growing upward momentum. However, the strength of the move remains moderate and not yet fully confirmed.

Stochastic (5,3,3): The Stochastic oscillator is in the overbought zone, indicating a potential short-term pullback. Still, the strong upward slope signals that bullish momentum remains active.

Support and Resistance:

Support: Immediate support is located near the 64.40–65.00 area, aligning with the recent swing low and consolidation base.

Resistance: Key resistance is positioned around 75.30–76.00, coinciding with the descending trendline and recent highs.

Conclusion and Consideration:

Silver on the H4 timeframe shows signs of a potential bullish breakout despite the prevailing downtrend. Technical indicators suggest increasing buying momentum, supported by price compression near resistance. However, overbought conditions and upcoming US economic data could trigger volatility, so confirmation of a breakout is essential before considering further upside.

Disclaimer: The analysis provided for XAG/USD is for informational purposes only and does not constitute investment advice. Traders are encouraged to perform their own analysis and research before making any trading decisions on XAGUSD. Market conditions can change quickly, so staying informed with the latest data is essential.

FXGlory-Daily-Analysis-Image-Watermark-Final

Silver Forecast — 10 March 2026

Time Zone: GMT +2

Time Frame: 4 Hours (H4)

Fundamental Analysis:

Silver H4 remains highly sensitive to today’s USD-related fundamentals, especially the upcoming CPI and Core CPI releases, which are key indicators for inflation and future Federal Reserve policy expectations. Stronger-than-forecast inflation data could support the US Dollar and Treasury yields, which may limit upside momentum in XAG/USD and pressure Silver prices. In addition, any hawkish remarks from Fed Governor Michelle Bowman could further strengthen the Dollar and weigh on precious metals. For today’s Silver technical and fundamental analysis, inflation data and Fed commentary are the main drivers likely to shape short-term price action on the H4 chart.

Price Action:

Looking at the Silver H4 chart analysis, ever since the Silver chart went through a major bearish move, the candles have been struggling to recover from that damage, showing signs of a sideways market trend moving between 70.676 and 95.286. The previously prolonged bullish momentum is now clashing with the market’s current struggle to recover from the strong bearish impulse, and that has left the chart in an undecided structure. Recent candles show a moderate rebound toward the mid-to-upper part of the range, but price is still trading below the major resistance zone, which keeps the broader XAG/USD H4 forecast neutral rather than fully bullish. In this technical analysis for Silver H4, the current price behavior suggests consolidation with recovery attempts, not yet a confirmed breakout trend.

Key Technical Indicators:

Bollinger Bands (60): The Bollinger Bands are narrowing, signaling reduced volatility and the possibility of an upcoming expansion move. Price remains range-bound, so the next breakout or rejection will be important.

MACD (12,26,9): The MACD is still in positive territory, showing mild bullish momentum in Silver H4. However, the recovery remains limited and not strong enough to confirm a clear trend reversal.

Williams %R (14): Williams %R is near the overbought zone, indicating recent buying strength in the short term. Still, in a sideways market, this can also signal slowing momentum near resistance.

Support and Resistance:

Support: The nearest support is at 83.690, which has recently acted as a short-term stabilization zone. Below that, 70.676 remains the major H4 support level.

Resistance: The immediate resistance is at 95.286, which continues to cap bullish recovery attempts. A break above it could improve the Silver H4 bullish outlook.

Conclusion and Consideration:

This Silver H4 chart technical analysis suggests that XAG/USD is still trapped inside a broad sideways structure after a severe bearish shock, with recovery attempts visible but not yet decisive. The narrowing Bollinger Bands, positive yet modest MACD structure, and near-overbought Williams %R reading all point to a market that is rebuilding bullish pressure while still facing clear resistance and uncertainty. From a fundamental analysis perspective, upcoming USD inflation data and Fed commentary could become the trigger that decides whether Silver breaks above 95.286 or rotates back into its range. Traders following this Silver daily analysis, technical analysis, and price action forecast should watch for a confirmed H4 breakout or rejection before assuming directional continuation.

Disclaimer: The analysis provided for XAG/USD is for informational purposes only and does not constitute investment advice. Traders are encouraged to perform their own analysis and research before making any trading decisions on XAGUSD. Market conditions can change quickly, so staying informed with the latest data is essential.

Silver_H4_Technical_and_Fundamental_Analysis_For_03.11.2026

Silver Forecast — 19 February 2026

Time Zone: GMT +2

Time Frame: 4 Hours (H4)

Fundamental Analysis:

The Silver price dynamics (XAG/USD) could experience significant volatility amid today’s upcoming economic news from the United States, including the Treasury International Capital (TIC) data release, initial jobless claims, and speeches by Federal Reserve FOMC members. Hawkish comments from Fed officials, strong economic indicators, or better-than-forecast TIC data could strengthen the USD, adding bearish pressure on Silver. Conversely, any signs of economic slowdown, higher-than-expected unemployment claims, or dovish Fed statements could weaken the USD, providing fundamental support for a bullish turnaround in Silver.

Price Action:

The H4 chart of Silver displays recent bearish activity followed by increasingly weaker bearish moves, consistently nearing the descending trendline. The inverted head and shoulders pattern formation and positive regular divergence between MACD and price suggest a potential bullish reversal. Price action is currently testing resistance provided by the trendline, indicating possible imminent bullish momentum.

Key Technical Indicators:

Moving Average (21): The 21-period moving average is currently positioned below the candlesticks, suggesting that the short-term momentum has turned bullish. A sustained move above this moving average line would reinforce bullish sentiment for XAG/USD.

MACD (12,26,9): The MACD indicator is positioned at -0.6150, below the zero line, but displaying a positive regular divergence, signaling weakening bearish momentum. A bullish crossover of the MACD line above the signal line would indicate a strong buying signal and potential bullish trend initiation.

Stochastic (21,3,3): The stochastic indicator at 76.66 (main line) and 71.91 (signal line) indicates the price is approaching overbought conditions. While this suggests caution, the indicator still has room to support upward movement in the near term, reinforcing bullish potential for the Silver price.

Support and Resistance:

Support: Immediate support is located around 72.161, corresponding to recent lows and the neckline of the inverted head and shoulders pattern.

Resistance: Nearest resistance is identified at approximately 80.735, aligning with the descending trendline and recent price reaction zones.

Conclusion and Consideration:

The XAG/USD H4 chart analysis suggests increasing bullish potential, supported by price action patterns and technical indicators. Traders should closely monitor today’s USD economic releases and Fed speeches, as these events could significantly influence market sentiment and price volatility. It’s prudent to await confirmation of a bullish breakout above resistance for a safer entry point.

Disclaimer: The analysis provided for XAG/USD is for informational purposes only and does not constitute investment advice. Traders are encouraged to perform their own analysis and research before making any trading decisions on XAGUSD. Market conditions can change quickly, so staying informed with the latest data is essential.

Silver H4 Technical and Fundamental Analysis for 02.19.2026

Silver Forecast — 18 December 2025

Time Zone: GMT +2

Time Frame: 4 Hours (H4)

Fundamental Analysis:

The SILVER/USD pair today faces potential volatility driven by key upcoming economic announcements impacting the USD. Investors await crucial speeches by US President Donald Trump from the White House, where significant policy indications may directly influence currency valuations. Additionally, critical economic indicators such as the US Consumer Price Index (CPI), Initial Jobless Claims, Philadelphia Fed Manufacturing Index, and Natural Gas Storage data are due, potentially creating sharp fluctuations and setting the tone for Silver price movements.

Price Action:

Silver on the H4 timeframe illustrates a clear bullish trend characterized by strong upward momentum followed by shallow corrections. Currently, the price action indicates a minor correction phase; the Fibonacci retracement suggests a potential target at the 23.6% level. However, given recent momentum patterns, the correction could terminate before reaching this support, maintaining an overall bullish bias for SILVER-USD.

Key Technical Indicators:

Adaptive Moving Average (9): The AMA line remains firmly positioned below the candles, clearly indicating robust bullish momentum in SILVER USD price action on the H4 chart. The current stance suggests continuation of the upward trend unless a significant bearish reversal occurs.

William’s %R (14): Currently at -11.32, William’s %R indicator suggests SILVER-USD is in the overbought territory. Despite being overbought, the bullish sentiment remains strong, implying that while corrections may occur, the bullish trend is likely to persist.

MACD (12, 26, 9): The MACD indicator for SILVER/USD shows values of 1.1696 and 1.0075, indicating a bullish market condition. The MACD histogram continues to display positive momentum, supporting continued buying strength in the near term.

Support and Resistance:

Support: Immediate technical support for SILVER USD is situated at the Fibonacci retracement level of 23.6%, around 63.15, aligned with recent correction phases.

Resistance: SILVER-USD faces near-term resistance at recent highs, approximately at 66.37, marking a crucial level for bulls to break for sustained upward movement.

Conclusion and Consideration:

SILVER-USD on the H4 chart maintains a bullish outlook, reinforced by key technical indicators including the Adaptive Moving Average, William’s %R, and MACD. Traders should consider the potential impacts of forthcoming US economic announcements, which may cause increased volatility. The current bullish trend may face short-term corrections, but overall, market sentiment remains strongly positive for continued bullish price action in SILVER USD.

Disclaimer: The analysis provided for SILVER/USD is for informational purposes only and does not constitute investment advice. Traders are encouraged to perform their own analysis and research before making any trading decisions on SILVERUSD. Market conditions can change quickly, so staying informed with the latest data is essential.

Silver H4 Technical and Fundamental Analysis for 12.18.2025

1SILVER = –––USD –––%
SILVER
Loading chart...