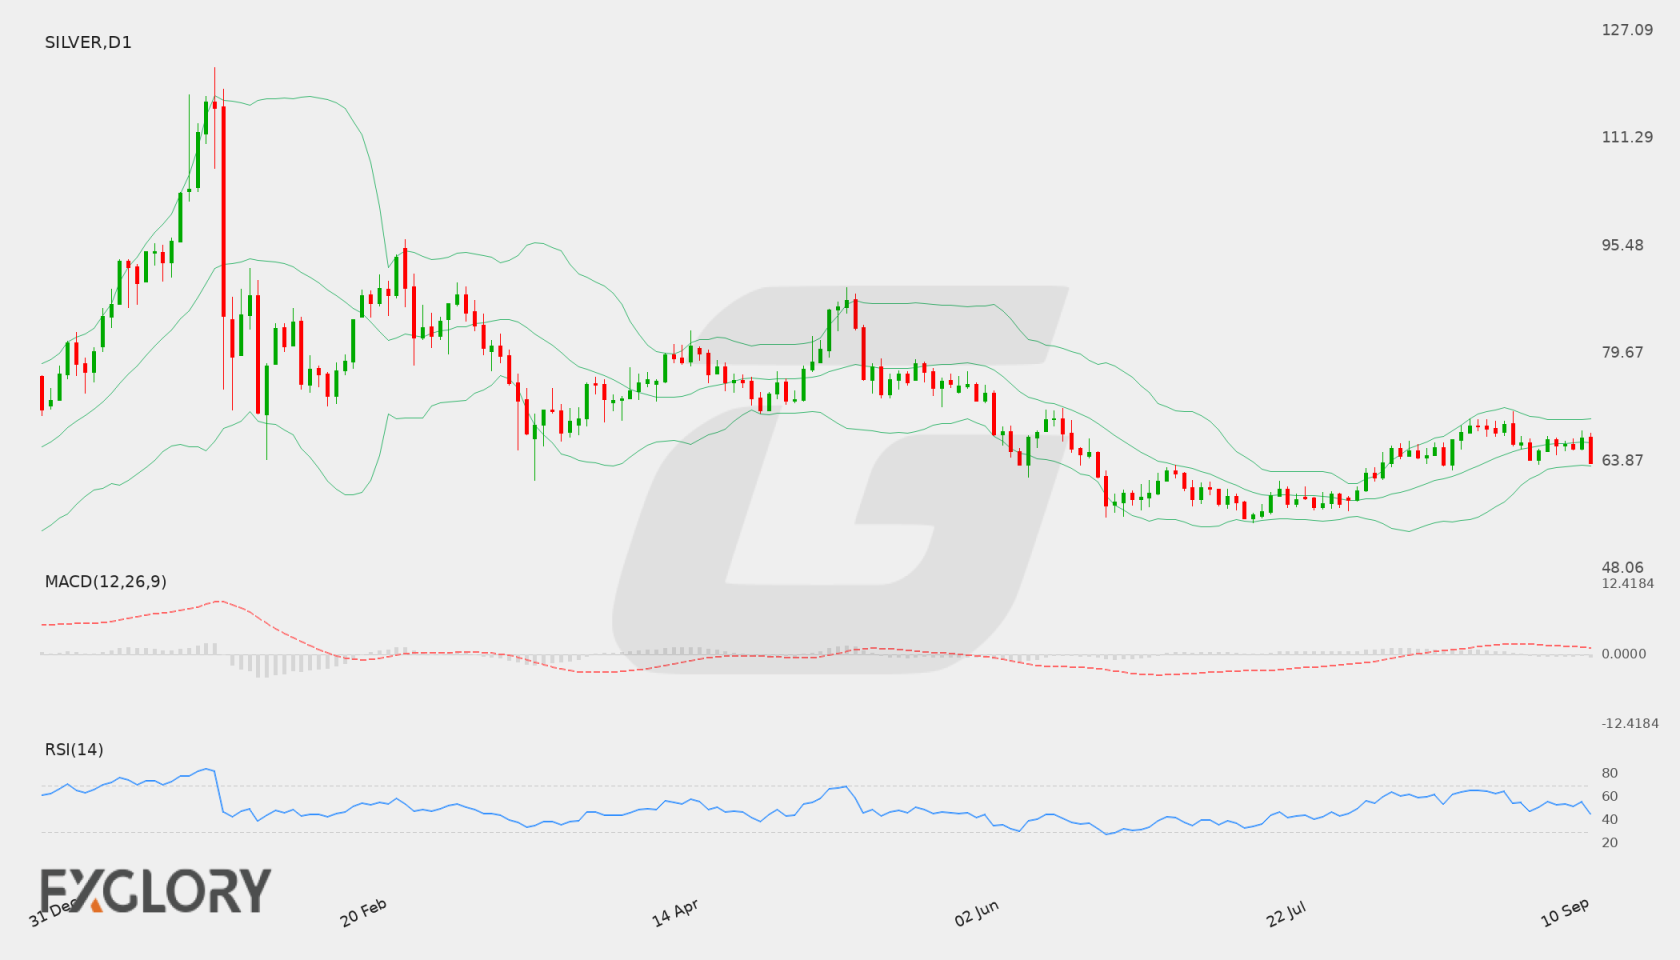
Current weekly forecast: This outlook covers 11–17 October 2026 and remains valid until 17 October 2026, unless its stated invalidation condition is triggered earlier.
Daily check — 12 October 2026: SIL/VER is at 60.82500 as of 12 Oct 2026 12:00 GMT+3. The latest completed D1 close was 60.80000 on 9 October 2026. It remains below the upper formal invalidation level 67.39191; the lower calibrated boundary 54.73485 is an extension/confirmation boundary. The authored weekly thesis remains valid.
In brief
The weekly bias is bearish as D1 structure and negative momentum align, although mixed closes and neutral H4 conditions leave room for consolidation before any decisive move.
Silver closed at 59.168, below the D1 Bollinger middle band at 62.82385 and below the EMA20 at 62.32748 and EMA50 at 63.5398. The bearish D1 trend state, falling EMA50 slope and falling SMA200 slope establish the primary weekly direction, with 57.204 and 55.688 marking the supplied downside supports.
The setup is not one-sided: D1 closes are mixed, while H4 is neutral with RSI at 54.61 and a positive MACD histogram of 0.184642. That tactical improvement can support consolidation or a countertrend test of 60.75 and 61.167, but it does not replace the controlling D1 structure.
SIL/VER D1 technical-analysis context for the weekly forecast. Chart data captured 12 October 2026.
Silver (SILVER) remains influenced by shifting macroeconomic conditions, interest rate expectations, and general market risk sentiment. Market participants continue to evaluate incoming economic data, as industrial demand dynamics and central bank monetary policy trajectories play a central role in guiding market sentiment.
Price Action:
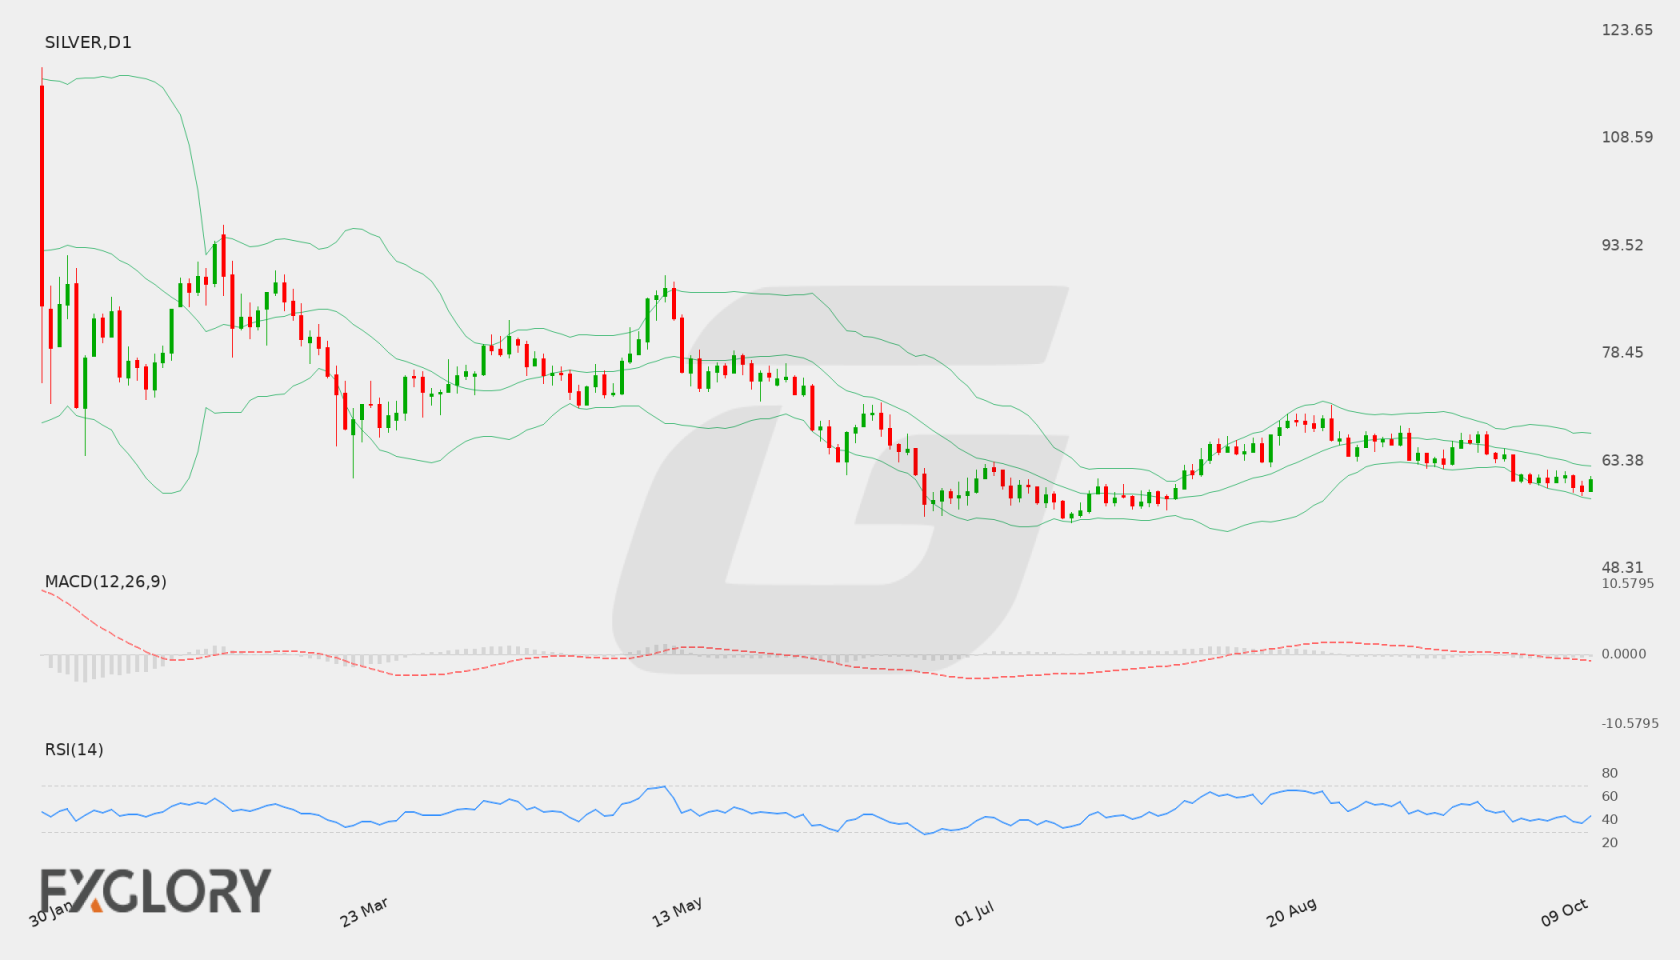
Silver (SILVER) closed the recent session at 60.968, reflecting downward pressure across recent trading days. Price action shows the market probing the lower section of its recent range, holding slightly above the recent low of 59.943 after declining from earlier session peaks.
Key Technical Indicators:
Bollinger Bands: On the Daily (D1) timeframe, Silver (SILVER) is trading at 60.968, positioning near the lower Bollinger Band of 60.058. The middle band is positioned at 64.193, while the upper band stands at 68.329, reflecting an expansion toward the lower boundary of the band structure.
RSI: The 14-day Relative Strength Index (RSI) for Silver (SILVER) is currently at 40.981. This reading sits below the neutral 50 level, showing softened buying momentum while remaining above the oversold benchmark of 30.
MACD: The Daily MACD for Silver (SILVER) prints at -0.926, indicating negative momentum. This positioning below the zero baseline confirms that recent price movement has been dominated by downward pressure.
Support and Resistance:
Key technical levels for Silver (SILVER) identify immediate support at 54.757 and primary resistance at 71.138. On an intermediate basis, the lower Bollinger Band at 60.058 serves as nearby dynamic support, with the middle band at 64.193 acting as resistance.
News to Watch for SILVER This Week:
ISM Services PMI: Economic activity data from the services sector may influence broader demand expectations for Silver.
FOMC Meeting Minutes: Detailed policy perspectives may shift interest rate outlooks and broad market sentiment.
Unemployment Claims: Weekly employment figures provide insight into economic resilience and potential risk appetite shifts.
Prelim UoM Inflation Expectations: Shifts in consumer inflation outlooks can affect hedging interest in Silver.
Prelim UoM Consumer Sentiment: Consumer confidence levels help gauge general economic strength and market risk tolerance.
Weekly Outlook and Consideration:
Silver (SILVER) trades with a cautious tone following its close at 60.968. With the MACD indicator negative at -0.926 and the daily RSI at 40.981, price action tests proximity to the lower Bollinger Band at 60.058. A sustained defense of this zone could see price attempt recovery toward the middle band at 64.193 and resistance at 71.138, whereas continued downward momentum would keep the focus on broader support at 54.757.
Disclaimer: The analysis provided for Silver is for informational purposes only and does not constitute investment advice. Traders are encouraged to perform their own analysis and research before making any trading decisions. Market conditions can change quickly, so staying informed with the latest data is essential.
Silver (SILVER) trades under the influence of broader macroeconomic trends and market sentiment. Industrial demand dynamics combined with shifting monetary expectations continue to impact investor appetite, making key economic indicators critical for near-term price direction.
Price Action:
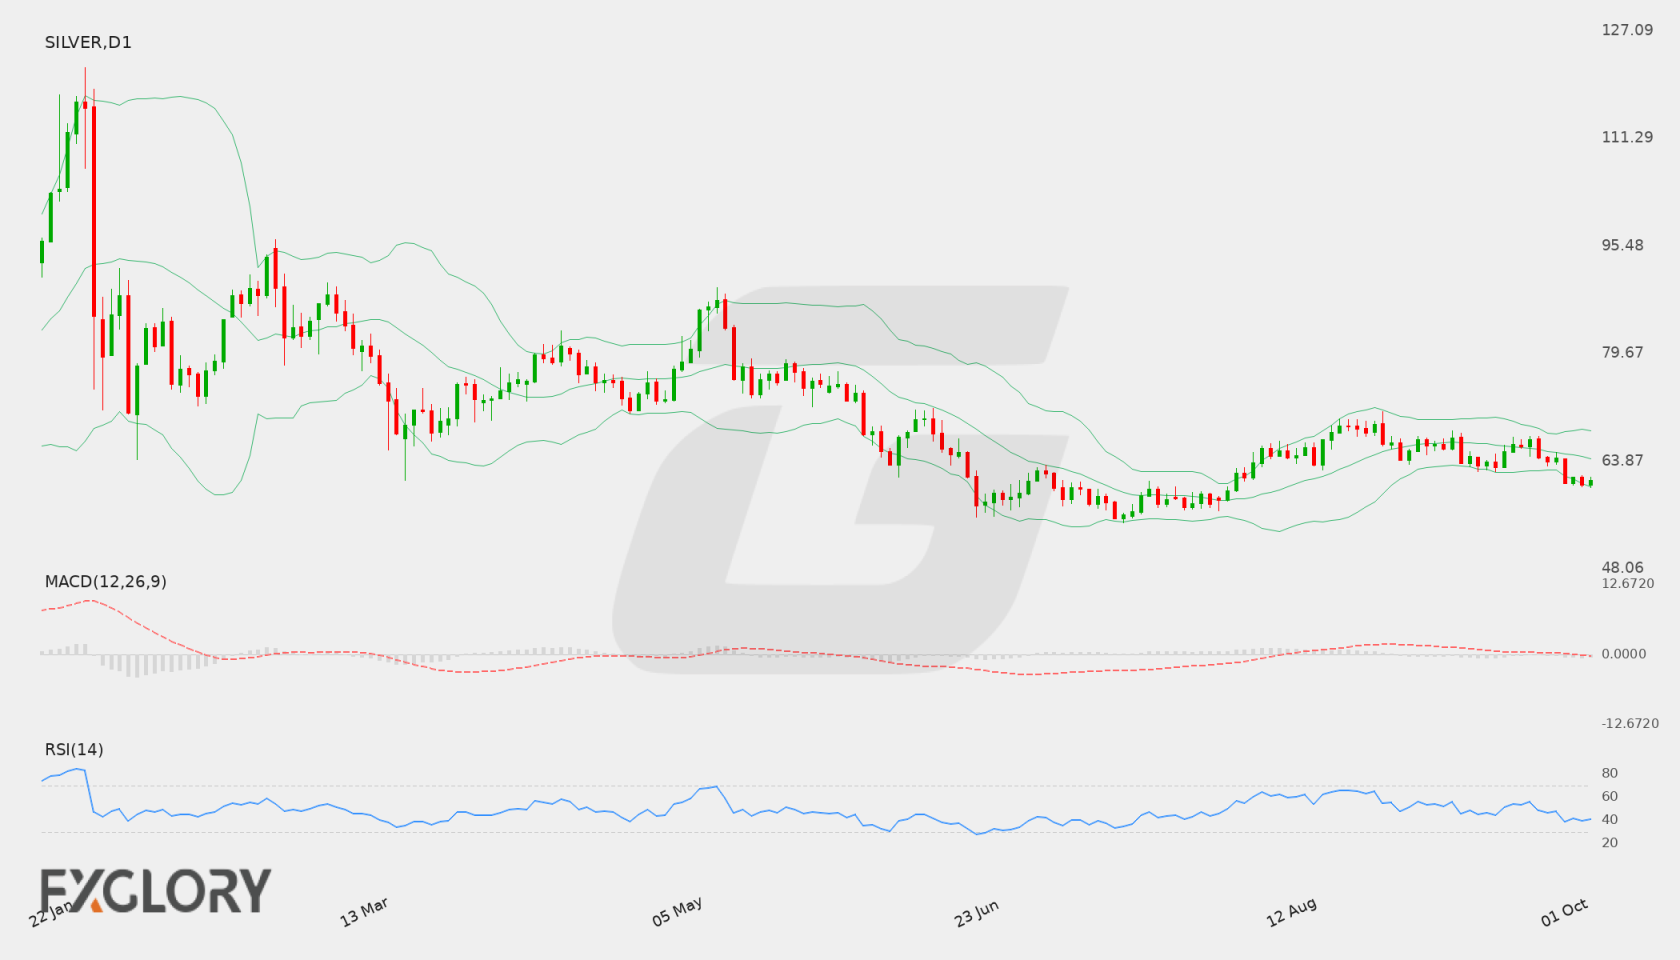
On the D1 timeframe, Silver (SILVER) recently closed at 63.814, pulling back from recent daily highs near 67.037. The price structure stays positioned between key support at 54.757 and resistance at 71.138.
Key Technical Indicators:
Bollinger Bands: The Bollinger Bands feature a middle line at 65.267, an upper band at 67.967, and a lower band at 62.567. With the last price at 63.814, Silver (SILVER) is trading in the lower half of the channel, approaching lower band support.
RSI: The 14-day Relative Strength Index (RSI) stands at 46.29. Floating below the 50 neutral midpoint, it indicates slight downside bias while remaining comfortably above oversold territory.
MACD: The MACD indicator currently sits at 0.047, remaining slightly above the zero mark. This flat, near-zero reading reflects minimal directional momentum on the daily chart.
Support and Resistance:
Key technical levels for Silver (SILVER) include major daily support at 54.757 and main resistance at 71.138, with intermediate reference points at the Bollinger lower band (62.567) and middle band (65.267).
News to Watch for SILVER This Week:
ISM Manufacturing PMI: Reflects manufacturing activity sentiment which can affect the US dollar and precious metal valuations.
ISM Manufacturing Prices: Tracks price changes in the manufacturing sector and offers insight into underlying inflation pressures.
Weekly Outlook and Consideration:
Silver (SILVER) demonstrates a consolidated stance with a minor downward bias, closing at 63.814 on the daily chart. Price action below the middle Bollinger Band (65.267) alongside an RSI of 46.29 highlights limited bullish momentum. Should selling pressure push price through the lower band zone at 62.567, technical support at 54.757 could come into play. Conversely, a breakout back above 65.267 could open momentum toward the upper resistance boundary at 71.138.
Disclaimer: The analysis provided for Silver is for informational purposes only and does not constitute investment advice. Traders are encouraged to perform their own analysis and research before making any trading decisions. Market conditions can change quickly, so staying informed with the latest data is essential.
Silver (SILVER) faces a key trading week driven by a busy economic calendar. Upcoming macroeconomic releases concerning consumer sentiment, inflation metrics, and labor market trends are likely to influence market sentiment and USD dynamics, impacting precious metals prices.
Price Action:
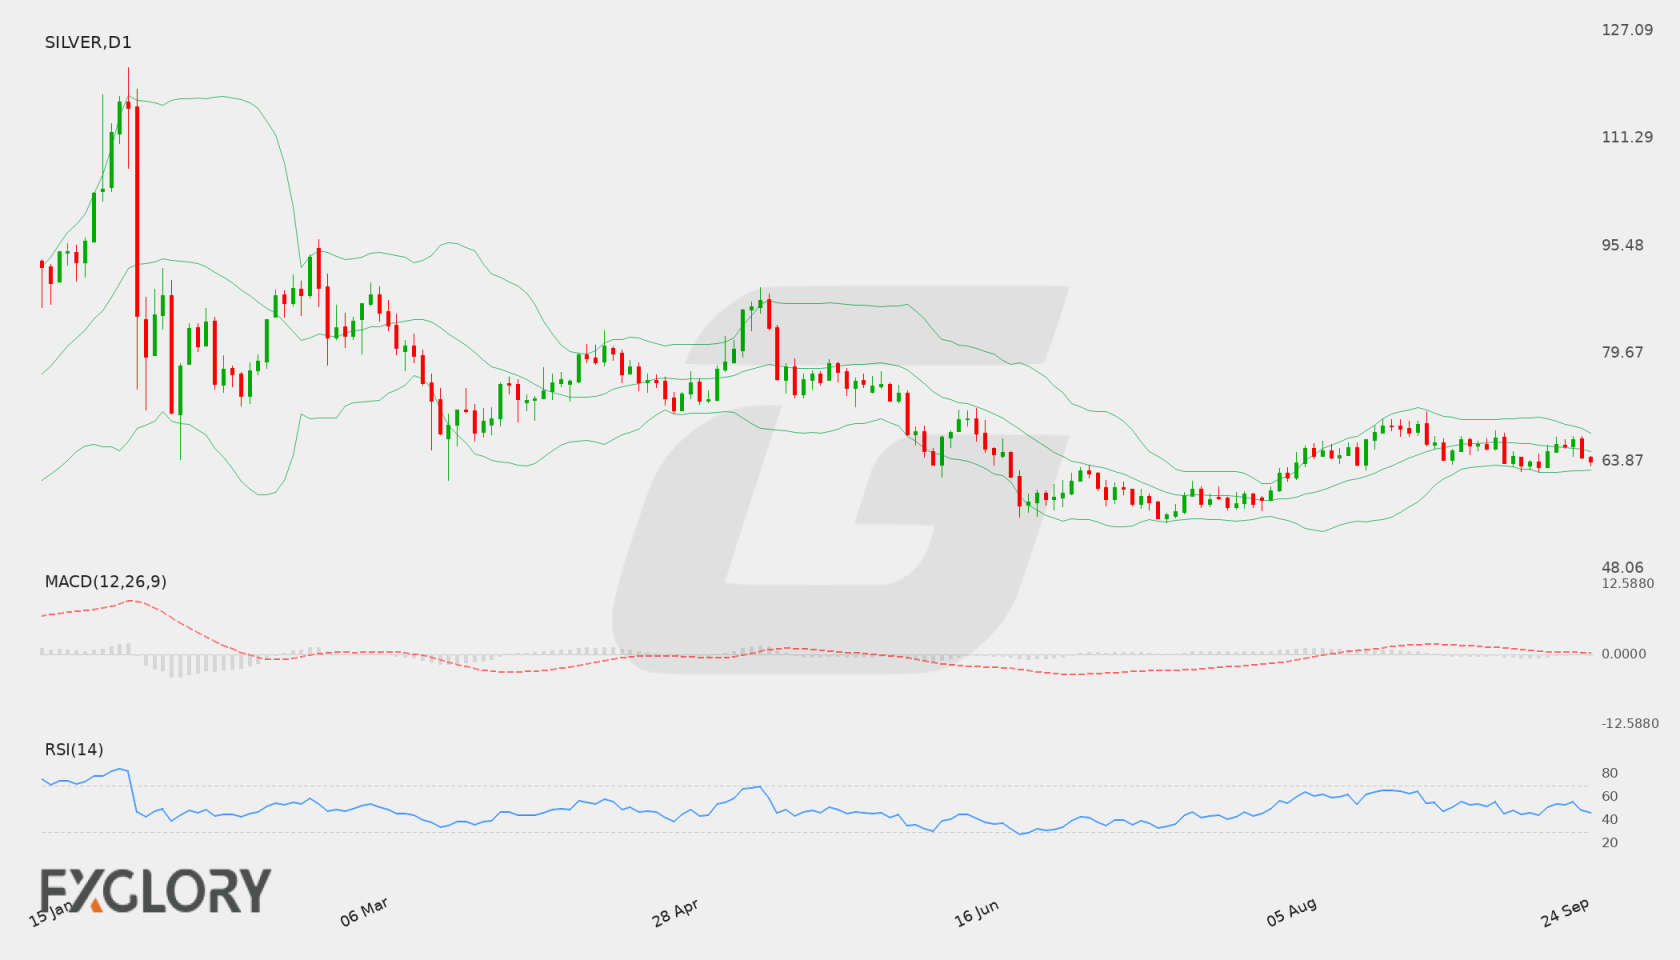
On the daily chart, Silver recently bounced from a low near 62.953 to register a close at 65.191. The price action reflects a neutral-to-recovery tone as buyers step in following recent downward pressure, maintaining price within the broader range.
Key Technical Indicators:
Bollinger Bands: The Bollinger Bands feature a middle band at 66.084, an upper band at 70.031, and a lower band at 62.138. Silver's last close at 65.191 positions the instrument just below the middle band, signaling consolidation within the band structure.
RSI: The 14-period Relative Strength Index (RSI) stands at 51.06. This value reflects a neutral market stance, indicating neither overbought nor oversold conditions on the daily timeframe.
MACD: The MACD indicator currently sits at -0.040, remaining slightly below the zero line. This minor negative reading indicates modest bearish momentum, though the shallow histogram value suggests potential stabilization.
Support and Resistance:
Key technical levels for Silver identify primary support at 54.757 and major resistance positioned at 71.138.
News to Watch for SILVER This Week:
CB Consumer Confidence: Assesses consumer sentiment which can influence economic activity and dollar valuation.
JOLTS Job Openings: Reflects labor market demand that provides insights into general economic strength.
ADP Non-Farm Employment Change: Offers an early indication of private-sector employment growth.
Core PCE Price Index m/m: Serves as a key inflation metric influencing broader rate policy expectations.
Final GDP q/q: Measures overall economic growth and potential revisions to output data.
ISM Manufacturing PMI: Provides snapshot data on manufacturing health and industrial demand.
Average Hourly Earnings m/m: Tracks wage growth trends that factor into inflation assessments.
Unemployment Rate: Indicates the percentage of unemployed workers affecting monetary policy expectations.
Weekly Outlook and Consideration:
Silver (SILVER) enters the week with balanced momentum following its close at 65.191. Bounded by technical support at 54.757 and resistance at 71.138, the asset trades near its middle Bollinger Band of 66.084. With the RSI neutral at 51.06 and the MACD at -0.040, upcoming high-impact US economic events could spark new directional momentum.
Disclaimer: The analysis provided for Silver is for informational purposes only and does not constitute investment advice. Traders are encouraged to perform their own analysis and research before making any trading decisions. Market conditions can change quickly, so staying informed with the latest data is essential.
Silver (SILVER) fundamentals remain sensitive to macroeconomic trends, interest rate expectations, and US economic performance. As a key precious metal with both industrial and investment appeal, price momentum reflects shifting investor sentiment regarding Federal Reserve policy and broad economic activity.
Price Action:
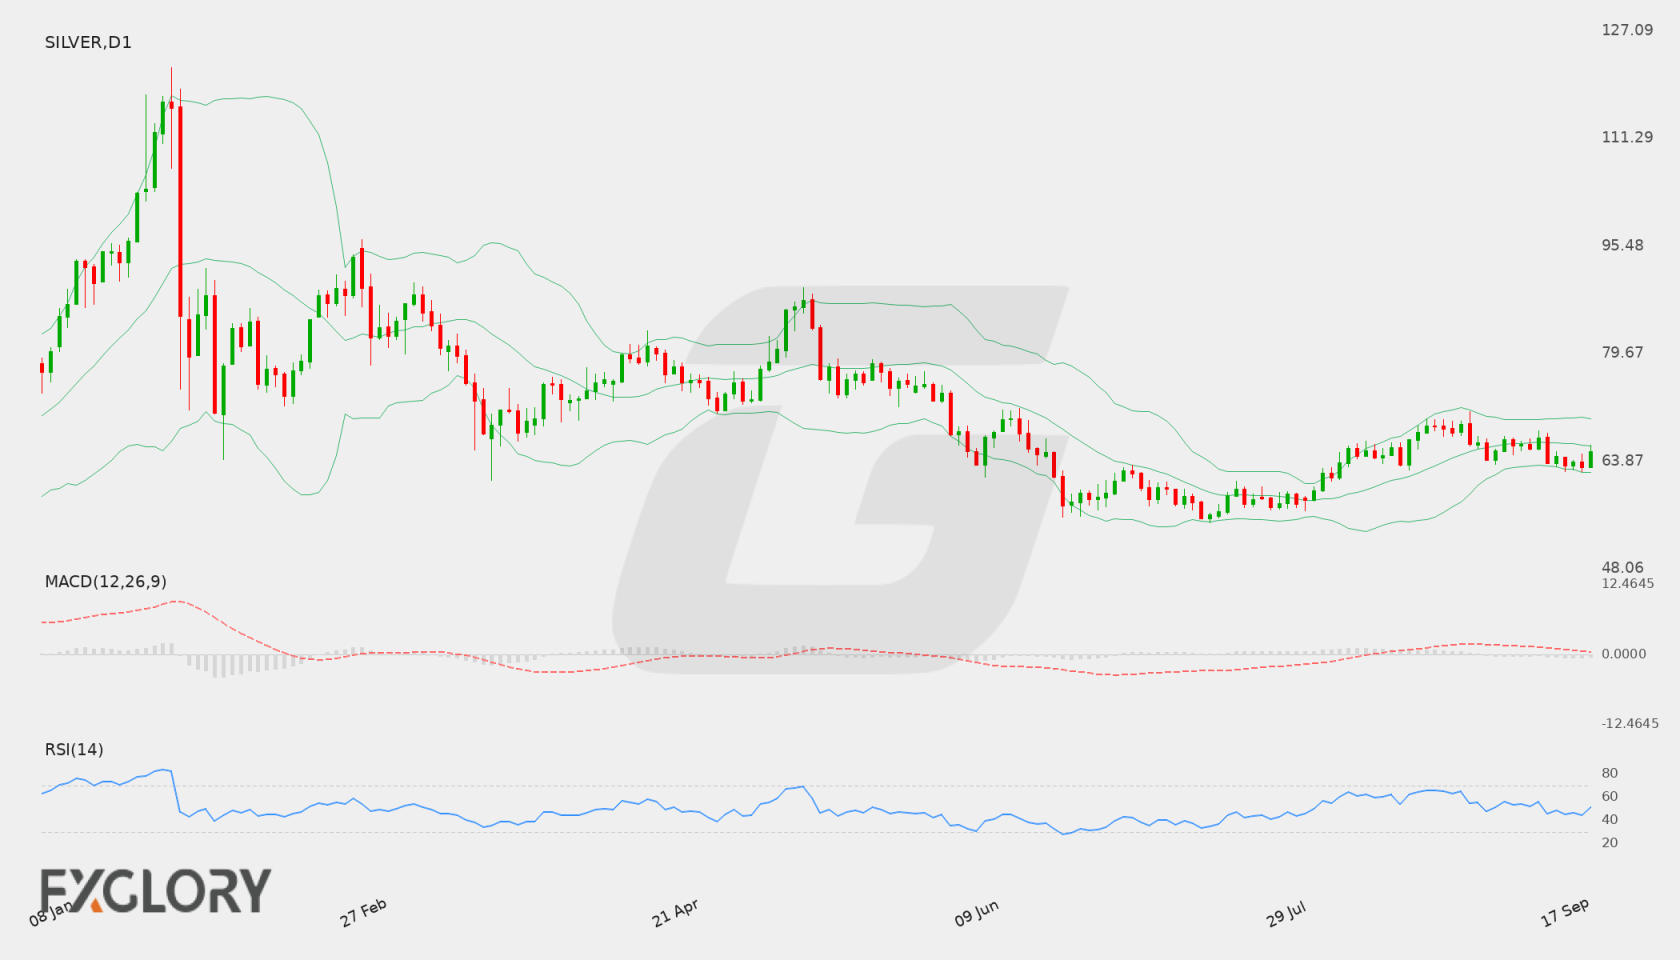
On the daily (D1) chart, Silver (SILVER) recorded a recent close of 63.562, sliding back from recent resistance at 71.138. Recent price candles reflect short-term selling momentum that has driven the price toward lower technical levels within the current trading range.
Key Technical Indicators:
Bollinger Bands: The Bollinger Bands indicator displays a middle band at 66.5506, an upper band at 70.0366, and a lower band at 63.0645. With Silver trading near 63.562, close to the lower band, price action is testing lower volatility limits, indicating potential support or room for downside expansion.
RSI: The 14-period RSI sits at 45.25, indicating neutral-to-bearish sentiment below the 50 level. This suggests modest downside bias without entering oversold territory.
MACD: The MACD value is currently at 0.6469, holding slightly above the zero line. However, declining values point to weakening bullish momentum and suggest traders should monitor for potential trend confirmation.
Support and Resistance:
Technical analysis highlights primary support at 54.757 and primary resistance at 71.138.
News to Watch for SILVER This Week:
Core Retail Sales m/m: Measures consumer spending changes excluding volatile sectors which can impact overall market sentiment.
Retail Sales m/m: Tracks broad US retail activity to gauge consumer health and economic momentum.
FOMC Economic Projections: Details central bank expectations for interest rates, growth, and inflation outlook.
FOMC Statement: Provides key monetary policy decisions and economic assessments from policymakers.
Federal Funds Rate: Declares the official interest rate decision influencing dollar strength and asset prices.
FOMC Press Conference: Features commentary explaining monetary policy stance and future policy expectations.
Silver (SILVER) enters the week facing short-term pressure around the 63.562 close, holding between key daily support at 54.757 and resistance at 71.138. The RSI at 45.25 and price position near the lower Bollinger Band of 63.0645 highlight cautious market sentiment. A clear bounce above the 66.5506 middle band could re-energize bullish momentum, while a break below current lower levels may keep the focus on broader support.
Disclaimer: The analysis provided for Silver is for informational purposes only and does not constitute investment advice. Traders are encouraged to perform their own analysis and research before making any trading decisions. Market conditions can change quickly, so staying informed with the latest data is essential.