

USD/ZAR holds an upward technical trajectory above 16.37628, with buyers targeting resistance at 16.46856 and 16.83936.
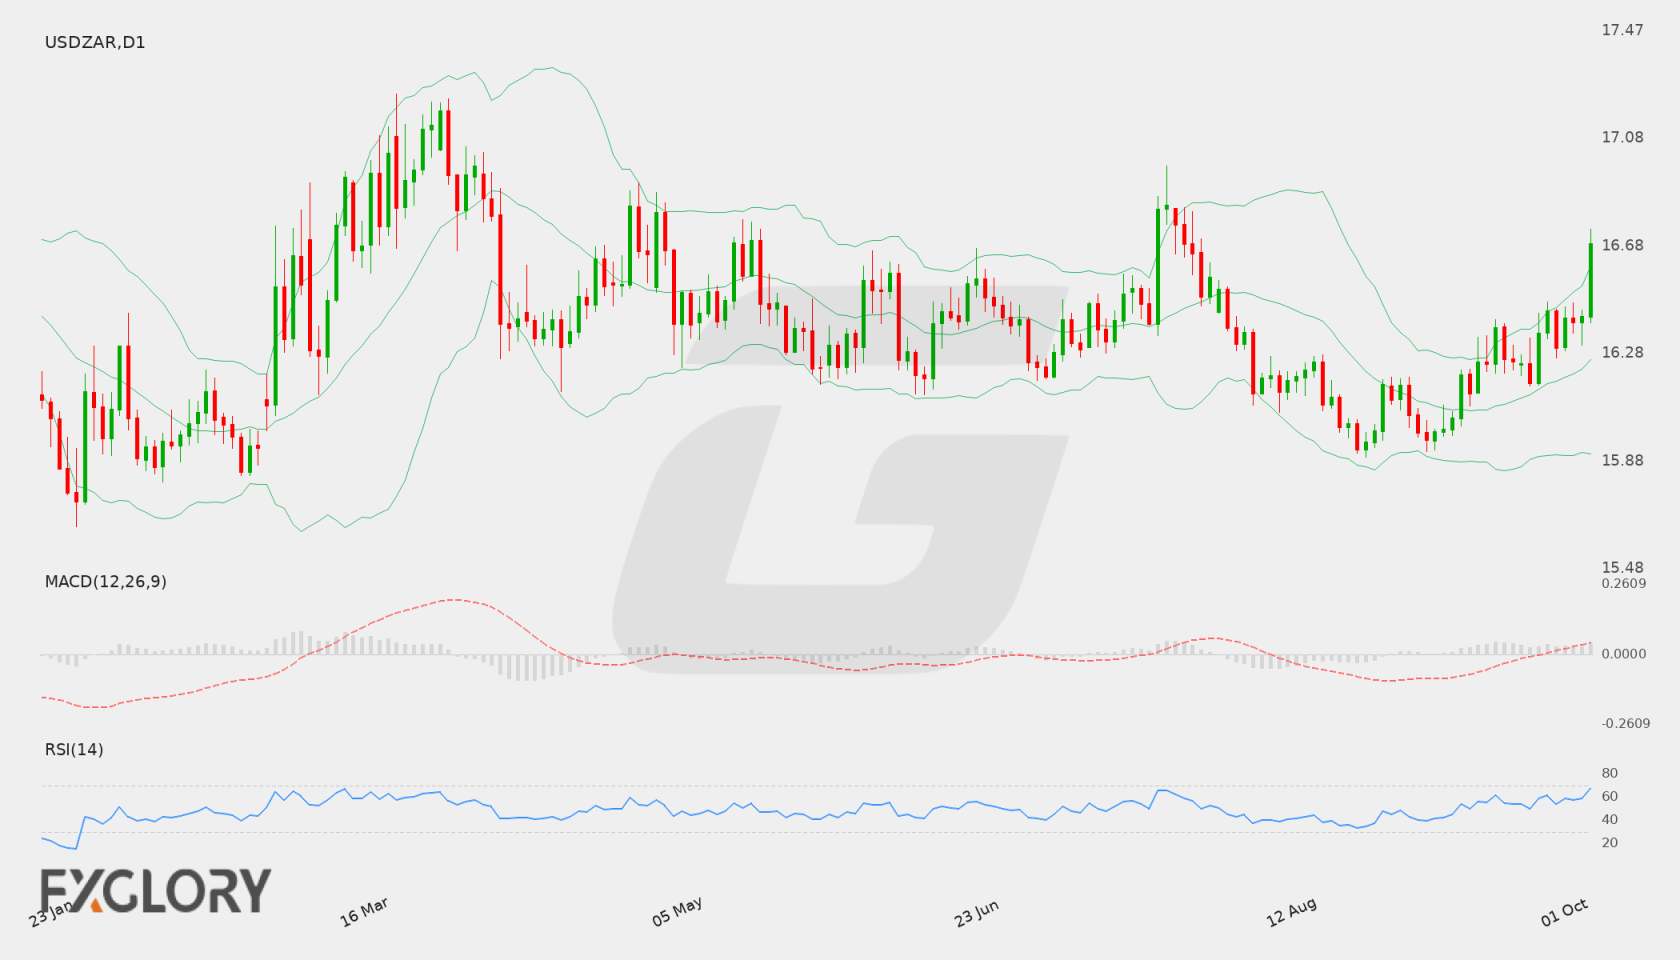
USD/ZAR Weekly Forecast at a Glance
In brief
USD/ZAR maintains a bullish bias toward 16.83936 while holding above support at 16.37628.
USD/ZAR closed the prior session at 16.40765, positioned firmly above the D1 200 SMA at 16.37628. Bullish alignment across daily and four-hour moving averages supports a continued move toward primary resistance at 16.46856 and secondary resistance at 16.83936.
Downside risks remain contained while the pair stays above primary support at 16.37628 and secondary support at 16.26193. A breach below these levels would expose lower targets at 16.18889 and 16.11946.
- Bullish targets
-
- T116.83936
- T216.97254
- T317.02472
- Bearish targets
-
- T116.26193
- T216.18889
- T316.11946
- Invalidation
- One completed D1 close below 16.24582.
Selected key events
- ISM Manufacturing PMIThu, Oct 1, 2026 18:00 GMT+04:00High
- ISM Manufacturing PricesThu, Oct 1, 2026 18:00 GMT+04:00Medium
| Price at last update | 16.60857 as of 23 Oct 2026 20:25 GMT+3 |
|---|---|
| Completed D1 reference close | 16.40765 as of 29 September 2026 |
| Primary support | 16.37628 |
| Secondary support | 16.26193 |
| Primary resistance | 16.46856 |
| Bullish targets | 16.83936, 16.97254, 17.02472 |
| Bearish targets | 16.26193, 16.18889, 16.11946 |
| Formal weekly thesis invalidation | Lower 16.24582 — One completed D1 close below 16.24582 formally invalidates the bullish weekly thesis. |
Live USD/ZAR Tools
A forecast is a snapshot. These pages keep moving with the market.
- Live
Live chart & price
Watch USD/ZAR move tick by tick. Flip from the 1-minute chart to the monthly, with trading conditions right alongside.
- Live
Technical signals
Buy, sell or sit it out? Oscillators, moving averages and pivot points boiled down to one clear reading, updated live.
Economic calendar
Know what's coming before it hits the price: every scheduled release with impact, forecast and actual.
Historical data
Open, high, low and close on any timeframe from 1 minute to monthly. Test your idea, then download the data.
All USD/ZAR forecasts
Every weekly outlook in one place. Scroll back to see how earlier calls played out against the chart.
USD/ZAR Fundamental Drivers This Week
Scheduled economic events relevant to USD/ZAR during Sep 28 – Oct 3, 2026 include ISM Manufacturing PMI, ISM Manufacturing Prices. Directional impact depends on the released data relative to supplied expectations.
Scroll table sideways for more columns →
| Event | Scheduled | Importance |
|---|---|---|
| ISM Manufacturing PMI | Thu, Oct 1, 2026 18:00 GMT+04:00 | High |
| ISM Manufacturing Prices | Thu, Oct 1, 2026 18:00 GMT+04:00 | Medium |
Current USD/ZAR Price and Weekly Market Context
USD/ZAR trades at 16.40765, navigating an expanding volatility environment with daily ATR at 0.15161.
- D1 trendbullishClose vs 50 EMA and 200 SMA
- H4 tacticalbullishH4 close vs 20 and 50 EMA
- MomentumpositiveRSI and MACD histogram
- VolatilityexpandingD1 ATR change
Is USD/ZAR Bullish or Bearish This Week?
The baseline scenario favors continued bullish movement toward 16.46856 and 16.83936 as long as support at 16.37628 holds.
Scenario 1 of 3Bullish continuation
- D1 confirmation
- A D1 close above 16.46856 confirms upward continuation toward 16.83936.
- H4 tactical signal
- An H4 close above the upper Bollinger Band at 16.47862 reinforces short-term buying momentum.
- Targets
- 16.83936, 16.97254, 17.02472
- Scenario failure condition
- A daily close below 16.24582 terminates the upward momentum.
Scenario 2 of 3Base / neutral
- D1 confirmation
- Consolidation between 16.37628 and 16.46856 maintains the prevailing bullish structure.
- H4 tactical signal
- H4 price action holding above the middle Bollinger Band at 16.38592 preserves the constructive bias.
- Targets
- 16.37628 to 16.46856
- Scenario failure condition
- A daily close outside the range of 16.37628 and 16.46856 disrupts the baseline expectation.
Scenario 3 of 3Bearish reversal
- D1 confirmation
- A D1 close below 16.37628 signals a shift toward secondary support at 16.26193.
- H4 tactical signal
- An H4 close below the lower Bollinger Band at 16.29323 accelerates selling pressure.
- Targets
- 16.26193, 16.18889, 16.11946
- Scenario failure condition
- A daily close above 16.46856 neutralizes downward pressure.
USD/ZAR D1 Outlook and H4 Technical Triggers
The daily timeframe controls the weekly thesis. H4 evidence is used only for earlier confirmation, tactical warning and scenario-failure context. Complete live H4, H1 and intraday readings remain on the Technical page.
D1 Price Action and Market Structure
On the D1 timeframe, price closed at 16.40765, above the SMA 200 at 16.37628, the EMA 50 at 16.24582, and the EMA 20 at 16.24093.
H4 Tactical Triggers
On the H4 timeframe, price stands at 16.40433, situated above the EMA 20 at 16.37778 and the EMA 50 at 16.32178.
Technical Indicators at a Glance
Automated technical summary
Technical indicators reflect positive momentum across both D1 and H4 charts, supported by expanding volatility and bullish moving average alignment.
Selected snapshot: D1 with H4 tactical context. Updated 2 October 2026.
- RSI58.38Neutral
- MACDAbove signalBullish
- Bollinger Bands88% of bandUpper half
- Moving averagesAbove bothBullish
- ATR1516.1 pipsExpanding
RSI (14)
Neutral
H4 55.73
D1 RSI at 58.38 reflects constructive bullish momentum without reaching overbought territory.
- D1 RSI
- 58.38
- H4 RSI
- 55.73
MACD (12, 26, 9)
Bullish momentum
D1 MACD line at 0.05076 resides above the signal line at 0.0202, generating a positive histogram of 0.03055.
- MACD
- 0.05076
- Signal
- 0.0202
- Histogram
- 0.03055
Bollinger Bands (20, 2σ)
Upper half
Striped ends = price outside the bands.
D1 price at 16.40765 trades between the middle band at 16.18889 and the upper band at 16.47846.
- Position in band
- 88%
- Band width
- 5791.4 pips (3.58%)
Moving averages (D1)
Bullish structure
- 50 EMA16.24582Price is 1618.3 pips above (+1.00%)
- 200 SMA16.37628Price is 313.7 pips above (+0.19%)
Price holds above the EMA 20 at 16.24093, EMA 50 at 16.24582, and SMA 200 at 16.37628 on the D1 timeframe.
- D1 close
- 16.40765
- 50 EMA
- 16.24582
- 200 SMA
- 16.37628
ATR (14)
Expanding volatility
One ATR either side of the latest close. A measure of move size, not a price target.
D1 ATR of 0.15161 indicates expanding trading ranges, while H4 ATR stands at 0.06401.
- D1 ATR
- 0.15161 (0.92%)
- H4 ATR
- 0.06401 (0.39%)
Technical conclusion: The broader technical setup favors upside exploration toward 16.46856 and 16.83936 as long as price remains anchored above 16.37628.
View all live USD/ZAR oscillators, moving averages, pivot points and timeframe signals.
USD/ZAR Weekly Support, Resistance and Invalidation
| Level | Role | Timeframe | Why it matters |
|---|---|---|---|
| 16.46856 | Primary Resistance | D1 | Nearest resistance hurdle capping immediate upside progress. |
| 16.83936 | Secondary Resistance | D1 | Major overhead target and upper boundary level. |
| 16.37628 | Primary Support | D1 | Aligns with the D1 200 SMA and serves as key near-term support. |
| 16.26193 | Secondary Support | D1 | Next structural support cushion ahead of the 16.24582 level. |
These are forecast-specific market-structure levels. Formula-based Classic, Fibonacci and Camarilla pivots remain on the Technical page.
Economic News & Events to Watch for USD/ZAR This Week
Selected events may increase USD/ZAR volatility. Direction depends on the released value relative to consensus and previous results.
Scroll table sideways for more columns →
| Event | Date and time | Importance | Previous | Consensus |
|---|---|---|---|---|
| ISM Manufacturing PMI | Thu, Oct 1, 2026 18:00 GMT+04:00 | High | — | — |
| ISM Manufacturing Prices | Thu, Oct 1, 2026 18:00 GMT+04:00 | Medium | — | — |
Calendar source: FXGlory economic calendar. Retrieved 29 Sep 2026 16:13 GMT+3. View the complete USD/ZAR economic calendar.
USD/ZAR Outlook for Sep 28 – Oct 3, 2026
USD/ZAR enters the week of Sep 28 – Oct 3, 2026 with an established bullish trend, supported by D1 closes above the 16.37628 level. Positive momentum readings from RSI at 58.38 and MACD histogram at 0.03055 bolster the case for a test of 16.46856.
Market participants should monitor key support at 16.37628 and secondary support at 16.26193. Event risk centers around US manufacturing data on Thu, Oct 1, 2026 18:00 GMT+04:00, which could catalyze the next leg toward 16.83936.
Weekly Forecast Risks and What Would Change the Outlook
- Breakdown below primary support: A drop below 16.37628 threatens the bullish structure and opens the path toward 16.26193.
- US data volatility: ISM releases on Thu, Oct 1, 2026 18:00 GMT+04:00 may drive sharp swings across USD pairs.
Formal weekly invalidation: The bullish weekly thesis is formally invalidated by one completed D1 close below 16.24582. One completed D1 close above 16.83936 confirms upper structural extension and continuation.
USD/ZAR Weekly Forecast FAQs
Is USD/ZAR bullish or bearish this week?
The weekly outlook is bullish, reflecting positive momentum and upside price positioning above the 16.37628 support zone.
What scenario would strengthen for USD/ZAR this week?
The primary scenario expects price to push through 16.46856 toward 16.83936, provided that price remains above 16.37628.
What are the key USD/ZAR support and resistance levels?
Key levels are primary support at 16.37628, primary resistance at 16.46856, and secondary resistance at 16.83936.
What would invalidate this USD/ZAR forecast?
The bullish weekly thesis is formally invalidated by one completed D1 close below 16.24582.
Methodology, Data and Sources
- Price-data source: FXGlory price feed (USDZAR)
- Live quote timestamp: 23 Oct 2026 20:25 GMT+3
- Weekly analysis timestamp: 29 September 2026
- Chart timestamp: 2 October 2026 (redrawn daily)
- Daily check: Every day at 04:00 GMT+3: the latest completed D1 close is checked against the invalidation levels and the chart is redrawn.
- Technical snapshot timestamp: 29 September 2026
- Calendar-data source: FXGlory economic calendar
- Calendar retrieval timestamp: 29 Sep 2026 16:13 GMT+3
- Candle convention: FXGlory D1 and H4 candles; D1 candle dates are evaluated in UTC and invalidation uses completed D1 closes only.
- Indicator settings: D1 RSI(14), MACD(12,26,9), Bollinger Bands(20,2), EMA(50), SMA(200), ATR(14); H4 RSI/MACD/Bollinger/EMA/ATR.
- Level-selection method: Weekly D1 support/resistance levels are structural market levels. Formal invalidation uses a hard 1.00× D1 ATR(14) minimum anchor distance plus a 0.00× D1 ATR(14) outward buffer; H4 levels are tactical only.
- Weekly forecast method: D1 controls the weekly thesis; H4 supplies tactical confirmation/warning only.
