Current weekly forecast: This outlook covers 11–17 October 2026 and remains valid until 17 October 2026, unless its stated invalidation condition is triggered earlier.
In brief
The weekly bias is bearish, supported by D1 trend and negative momentum, but mixed closes and neutral H4 conditions keep consolidation risk material.
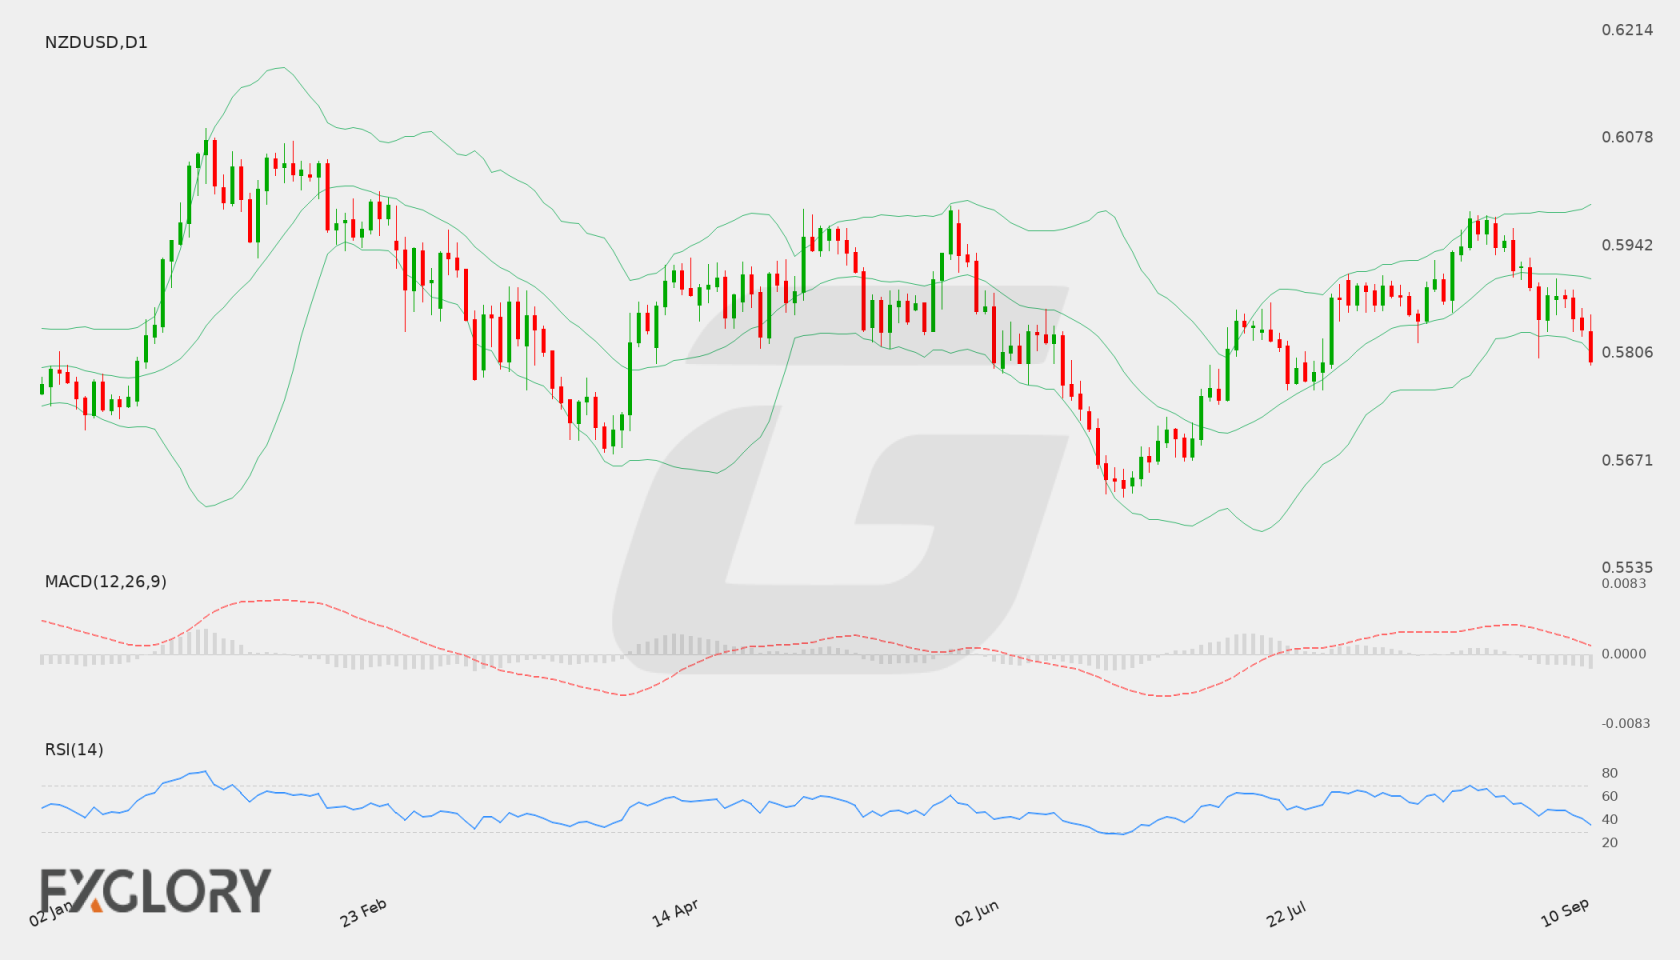
NZD/USD closed at 0.56032, below the D1 Bollinger middle level of 0.56759, the EMA20 at 0.56761, the EMA50 at 0.57514 and the SMA200 at 0.58413. The bearish D1 trend, falling EMA50 and falling SMA200 slopes establish the controlling weekly structure, while negative momentum reinforces downside pressure.
The counterpoint is tactical rather than structural: H4 is neutral, with RSI at 50.23 and a positive MACD histogram, while D1 closes are mixed. That combination can support consolidation around the supplied levels before either a move toward 0.55505 or a recovery test of 0.56264 and 0.56759 becomes more relevant.
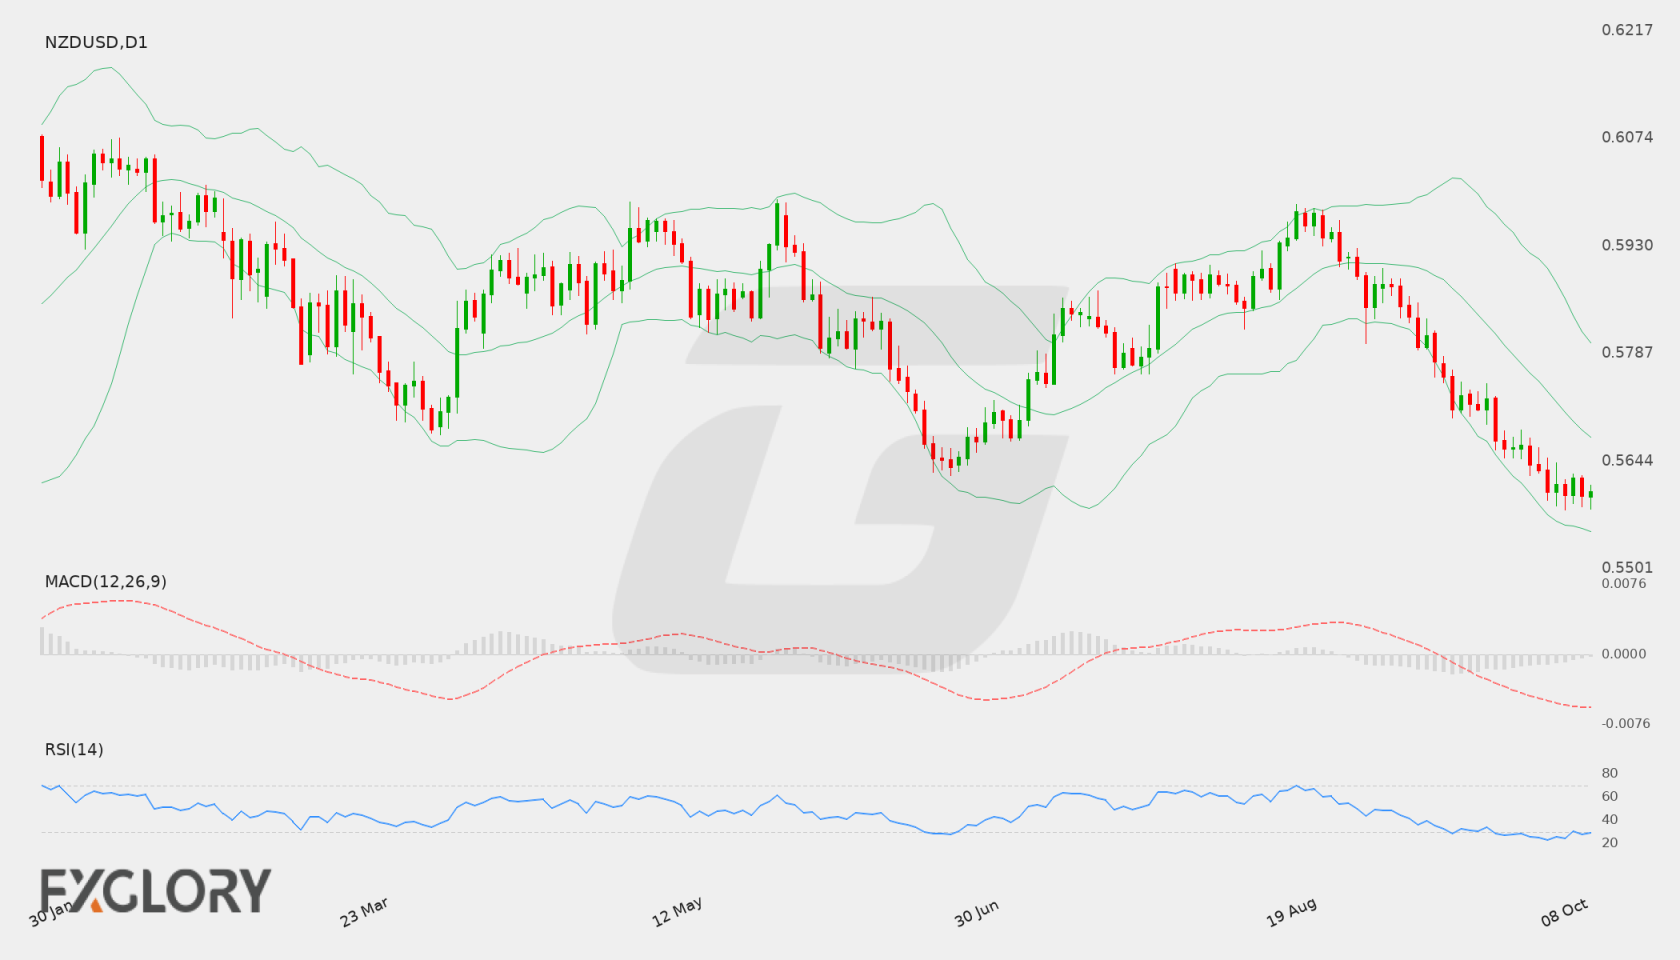
NZD/USD D1 technical-analysis context for the weekly forecast. Chart data captured 11 October 2026.
The fundamental outlook for NZD/USD (NZDUSD) is heavily guided by incoming US macroeconomic data releases and Federal Reserve communications. Upcoming reports addressing services activity, monetary policy debates, labor market shifts, and consumer inflation sentiment could significantly sway market sentiment and drive volatility in the currency pair.
Price Action:
On the daily chart, NZD/USD (NZDUSD) has experienced a sustained downward trajectory, retreating from its peak near the 0.5986 resistance level down to a recent close of 0.56036. The series of consecutive lower daily closes underscores steady selling pressure, keeping price action compressed near the lower end of its recent trading range.
Key Technical Indicators:
Bollinger Bands: The daily Bollinger Bands show the middle band positioned at 0.57362, with the upper band at 0.59001 and the lower band at 0.55723. With NZD/USD closing at 0.56036, the pair is trading well below its 20-day average and approaching the lower envelope, indicating an extended downward expansion in price volatility.
RSI: The 14-day RSI for NZD/USD is registered at 22.47, placing the pair deep within oversold territory below the 30 threshold. While this indicates strong prevailing bearish momentum, it also suggests that selling conditions are technically stretched on the daily timeframe.
MACD: The daily MACD indicator stands at -0.00617, holding in negative territory below the zero baseline. This negative value reflects sustained downward momentum in NZD/USD without any immediate confirmed technical reversal signal on the daily chart.
Support and Resistance:
Key daily support is established at 0.55916, closely followed by the lower Bollinger Band boundary at 0.55723. On the upside, immediate resistance is marked by the middle Bollinger Band at 0.57362, with primary overhead resistance standing at 0.5986.
News to Watch for NZDUSD This Week:
ISM Services PMI: Measures economic activity in the services sector and can influence demand for the currency pair.
FOMC Meeting Minutes: Provides detailed context on monetary policy perspectives and interest rate deliberations.
Unemployment Claims: Tracks weekly initial jobless claims to offer timely insight into labor market strength.
Prelim UoM Inflation Expectations: Gauges consumer inflation expectations which may influence monetary policy projections.
The broad technical setup for NZD/USD (NZDUSD) remains defensive as daily price action hovers near the 0.55916 support mark and the MACD sits in negative territory at -0.00617. However, an oversold daily RSI reading of 22.47 indicates the potential for consolidation or a technical rebound toward the middle Bollinger Band at 0.57362 if downside pressure eases. Market participants will likely track whether support at 0.55916 holds or gives way to the lower Bollinger Band at 0.55723 amid high-impact economic releases.
Disclaimer: The analysis provided for NZD/USD is for informational purposes only and does not constitute investment advice. Traders are encouraged to perform their own analysis and research before making any trading decisions. Market conditions can change quickly, so staying informed with the latest data is essential.
The NZD/USD currency pair remains under pressure as broader macroeconomic dynamics continue to weigh on market sentiment. Traders are closely evaluating economic conditions affecting both the New Zealand Dollar and the US Dollar, keeping a close eye on central bank expectations and general risk appetite.
Price Action:
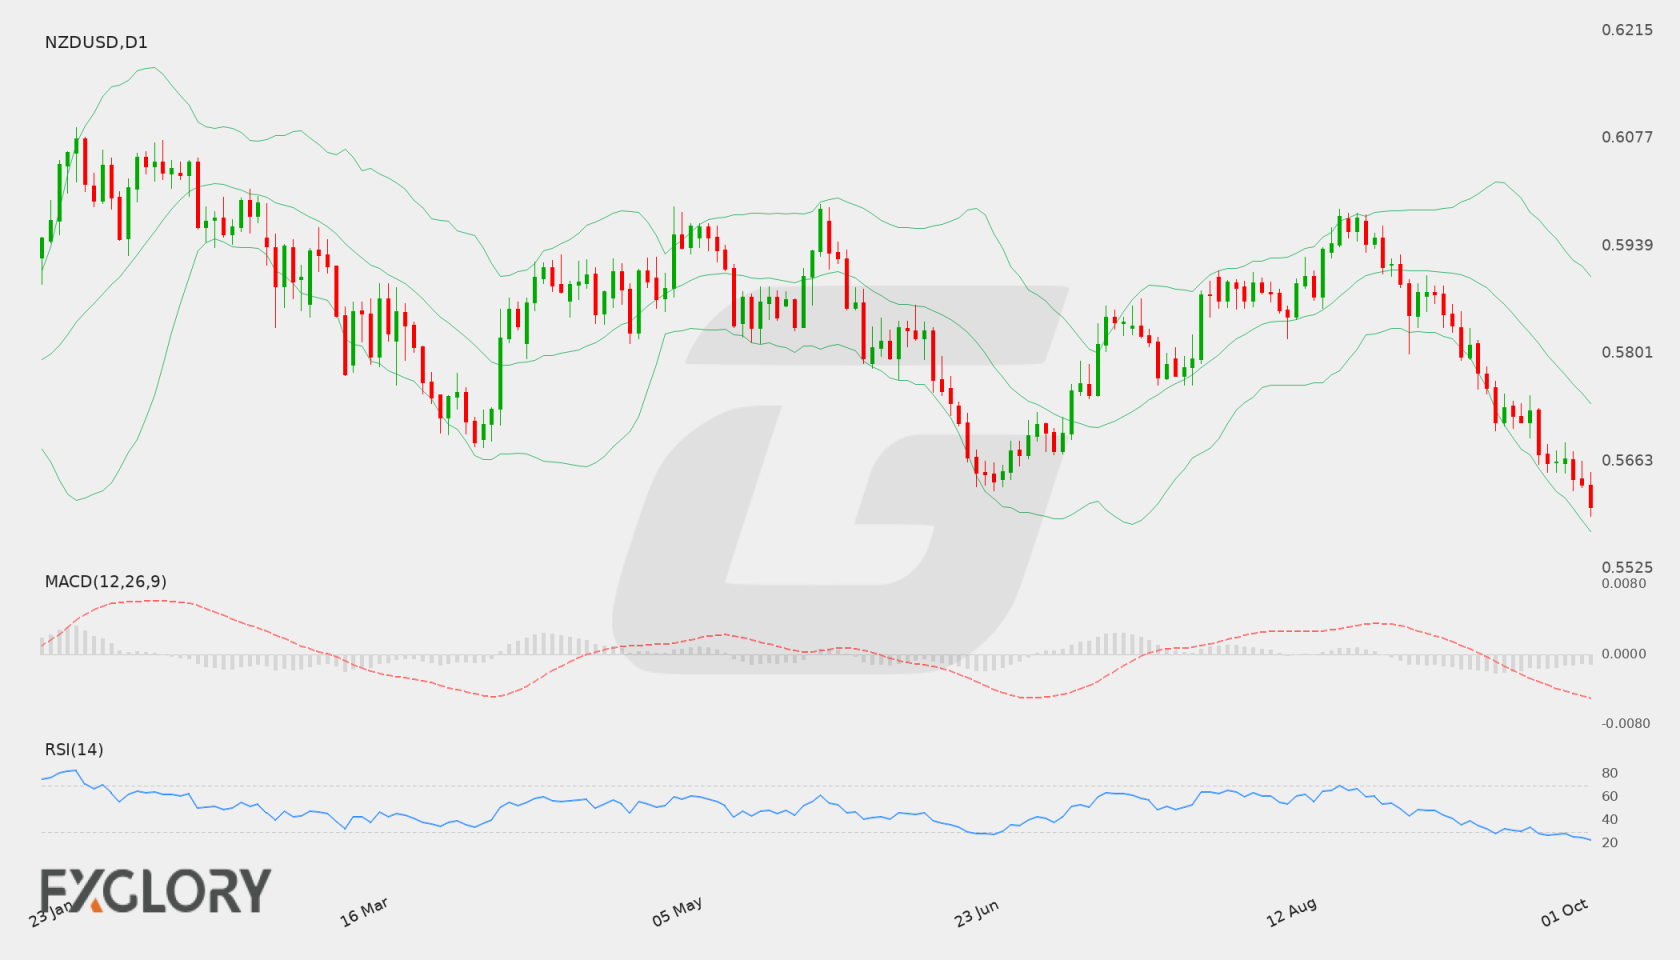
On the Daily (D1) timeframe, NZD/USD has displayed persistent weakness, declining from recent trading ranges to register a latest close at 0.56606. The series of lower daily closes reflects prevailing selling interest, compressing price action near recent session lows.
Key Technical Indicators:
Bollinger Bands: The Bollinger Bands indicator shows a middle band at 0.57984, an upper band at 0.59588, and a lower band at 0.56380. With the current close at 0.56606, NZD/USD is trading near the lower band, reflecting strong downside volatility.
RSI: The 14-period Relative Strength Index (RSI) is currently reading 27.13. Moving below the 30 level places the pair in oversold territory, suggesting that downside momentum is stretched on the daily chart.
MACD: The Moving Average Convergence Divergence (MACD) on the daily chart stands at -0.00514. This negative value indicates ongoing bearish momentum for NZD/USD as the signal remains firmly in negative territory.
Support and Resistance:
Immediate key technical support for NZD/USD is located at 0.56482, offering potential downside stabilization. On the upside, primary technical resistance is established at 0.5986.
News to Watch for NZDUSD This Week:
ISM Manufacturing PMI: Reflects the overall performance of the US manufacturing sector and can drive fluctuations in the US Dollar.
ISM Manufacturing Prices: Highlights price trends and inflationary pressures within manufacturing that may affect broader currency valuation.
Weekly Outlook and Consideration:
The D1 technical profile for NZD/USD remains tilted to the downside, underlined by a negative MACD of -0.00514 and price action anchored near the lower Bollinger Band of 0.56380. Although an RSI reading of 27.13 highlights oversold conditions that could allow for temporary consolidation, key resistance at 0.5986 presents a significant obstacle for buyers. A sustained breach of support at 0.56482 would signal further weakness, while a recovery toward the 0.57984 middle band would require renewed buying momentum.
Disclaimer: The analysis provided for NZD/USD is for informational purposes only and does not constitute investment advice. Traders are encouraged to perform their own analysis and research before making any trading decisions. Market conditions can change quickly, so staying informed with the latest data is essential.
The NZD/USD currency pair has experienced selling pressure as traders evaluate upcoming US economic data releases against overall market risk appetite. Market sentiment surrounding the New Zealand Dollar remains tied to developments in global growth expectations and US monetary policy prospects.
Price Action:
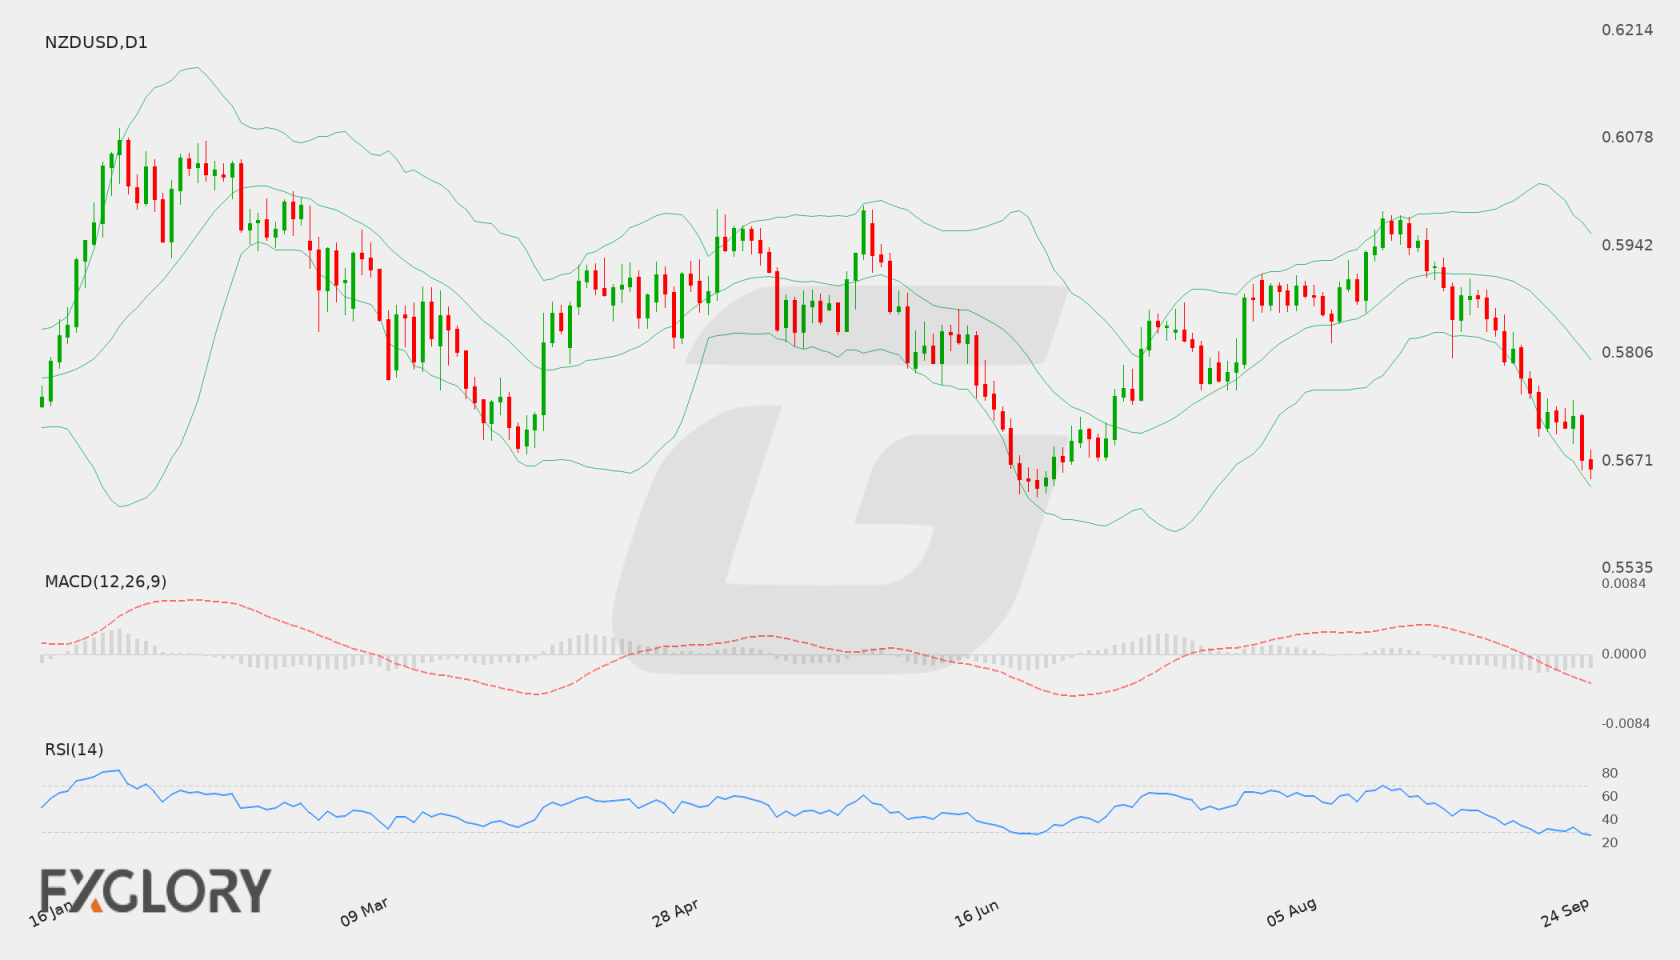
On the daily (D1) timeframe, NZD/USD shows a clear pullback from recent peaks near 0.5974 down toward the recent close around 0.57314. The recent candlestick structure indicates persistent downside pressure with a sequence of lower daily highs and lower lows.
Key Technical Indicators:
Bollinger Bands: The price is currently trading near the lower Bollinger Band at 0.57081. The middle band sits at 0.58637 with the upper band at 0.60193, highlighting an expanded volatility band aligned with recent downward price movements.
RSI: The 14-day Relative Strength Index (RSI) is recorded at 32.45, approaching oversold conditions, which indicates sustained selling momentum while opening the possibility for technical stabilization.
MACD: The daily MACD indicator sits below the signal line in negative territory at -0.00348, reflecting ongoing bearish momentum across recent trading sessions.
Support and Resistance:
Key technical support for NZD/USD is located around 0.56245, while major overhead resistance is identified at 0.5986.
News to Watch for NZDUSD This Week:
CB Consumer Confidence: Reflects consumer sentiment regarding economic conditions and could influence US Dollar trends.
JOLTS Job Openings: Highlights labor market demand and potential impacts on US monetary policy outlooks.
ADP Non-Farm Employment Change: Serves as an early indicator of private payroll trends in the United States.
Core PCE Price Index m/m: Provides critical insights into underlying inflation trends that guide monetary policy.
Final GDP q/q: Offers a comprehensive measure of US economic growth performance over the previous quarter.
ISM Manufacturing PMI: Measures purchasing manager activity to gauge health within the manufacturing sector.
Non-Farm Employment Change: Serves as a major driver of US Dollar volatility and labor market assessment.
Unemployment Rate: Indicates the percentage of the labor force actively seeking employment in the US economy.
Weekly Outlook and Consideration:
NZD/USD enters the week under technical pressure, trading around 0.57314. Technical indicators on the D1 chart, including a negative MACD and an RSI near oversold levels, underscore the prevailing bearish tone. Should downward momentum continue, testing support at 0.56245 remains a possibility, while any corrective moves higher will face resistance near 0.5986. Traders will closely watch key macroeconomic data releases for directional cues.
Disclaimer: The analysis provided for NZD/USD is for informational purposes only and does not constitute investment advice. Traders are encouraged to perform their own analysis and research before making any trading decisions. Market conditions can change quickly, so staying informed with the latest data is essential.
The NZD/USD pair faces shifts in trader sentiment as market participants evaluate incoming economic indicators and central bank policy stances. Key macroeconomic drivers, including domestic growth metrics and monetary policy decisions from the Federal Reserve, continue to dictate the pair’s overall momentum. Broader risk appetite and international trade dynamics also play a central role in guiding directional movement for the New Zealand Dollar against the US Dollar.
Price Action:
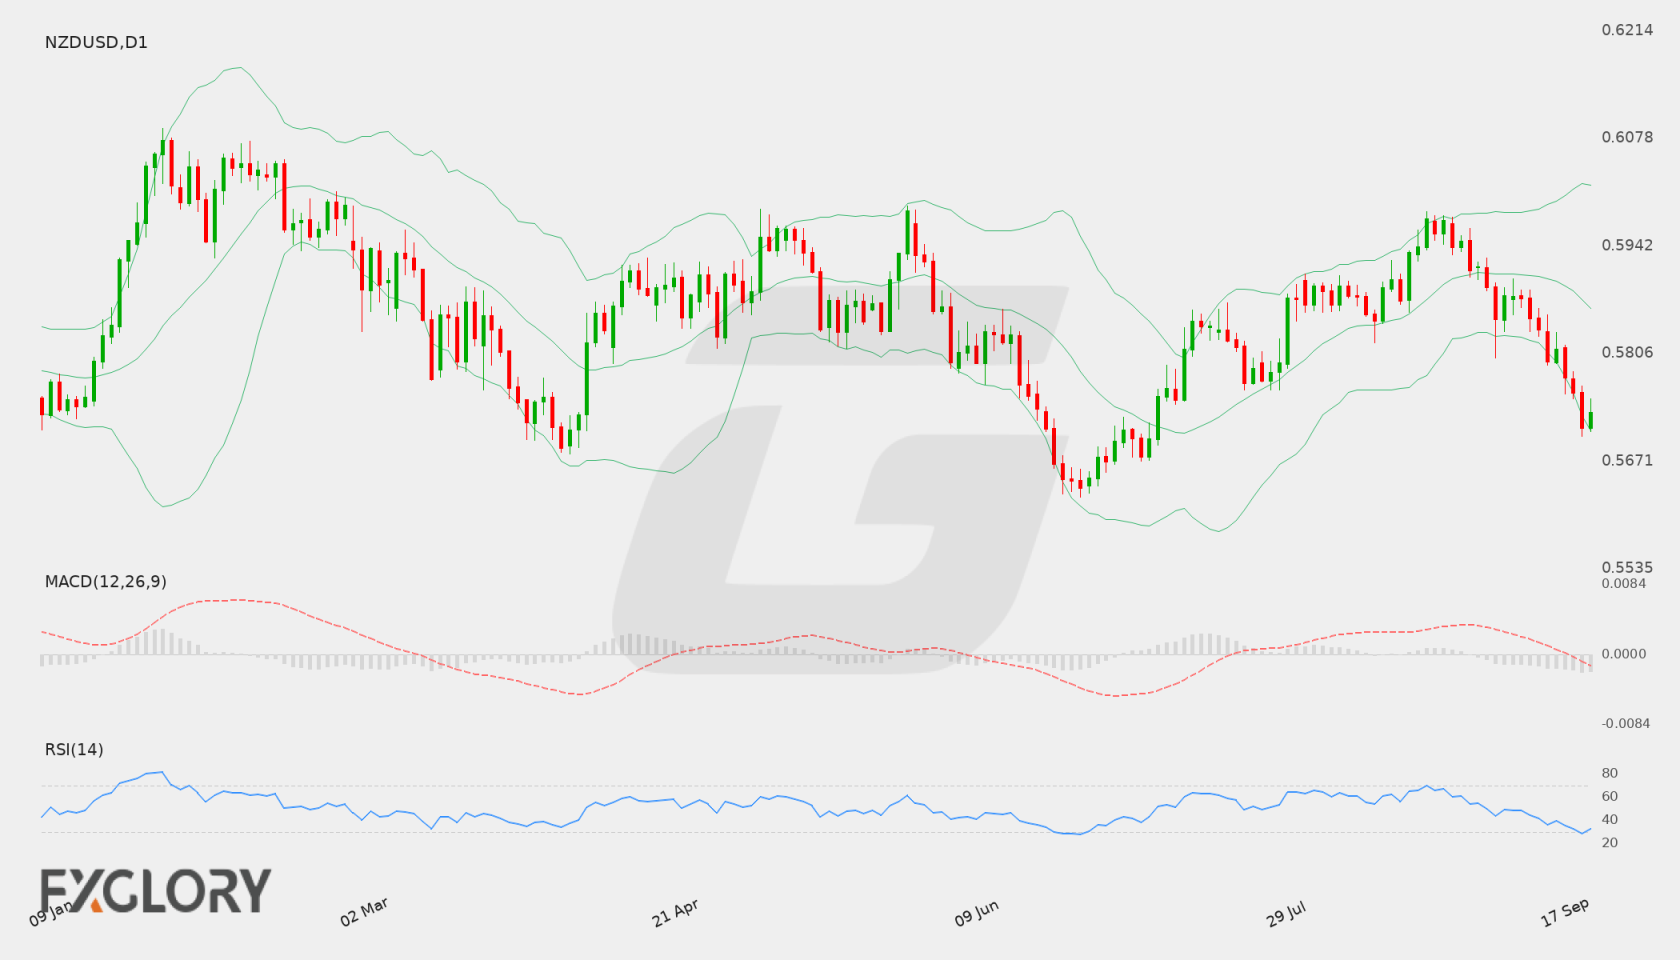
On the daily (D1) chart, NZD/USD recently closed at 0.57964 following a series of lower daily closes. The price action demonstrates downside pressure from recent highs near the 0.59700 zone, dipping back toward lower technical territory. Consecutive red daily candles indicate recent selling interest, pushing price action closer to key lower support levels while staying below key short-term moving averages.
Key Technical Indicators:
Bollinger Bands: The daily Bollinger Bands indicate heightened volatility, with the upper band positioned at 0.59950 and the lower band at 0.58074. With the last close at 0.57964, price action is currently trading slightly below the lower band, while remaining under the middle baseline of 0.59012. This positioning reflects strong downward momentum and suggests the pair is testing oversold boundary levels.
RSI: The 14-period Daily Relative Strength Index (RSI) stands at 36.12. This reading remains below the neutral 50 level, reflecting subdued bullish momentum and approaching oversold territory, though not yet signaling an extreme reversal condition.
MACD: The MACD indicator on the daily time frame shows a negative reading of -0.00067, maintaining its position below the signal line. The negative histogram underscores persistent bearish momentum in the medium term, indicating that sellers currently retain control over price direction.
Support and Resistance:
Key technical levels for NZD/USD highlight immediate daily support at 0.56245, which serves as a floor for downside attempts. On the upside, significant resistance is identified at 0.59860, marking a critical barrier that buyers must overcome to shift the prevailing trend.
News to Watch for NZDUSD This Week:
Core Retail Sales m/m: Measures changes in consumer spending excluding automotive sales, providing insight into US economic health.
Retail Sales m/m: Tracks total retail receipts to gauge overall consumer demand and economic vitality.
FOMC Economic Projections: Outlines official forward-looking expectations for interest rates and economic performance.
FOMC Statement: Delivers the central bank's official monetary policy assessment and stance.
Federal Funds Rate: Details the decision on benchmark US interest rates, directly impacting currency valuations.
FOMC Press Conference: Provides detailed commentary and insights from central bank leadership regarding future policy direction.
GDP q/q: Reflects the pace of domestic economic growth in New Zealand, influencing national currency sentiment.
Unemployment Claims: Tracks initial weekly filings for jobless benefits to evaluate US labor market strength.
Weekly Outlook and Consideration:
The weekly outlook for NZD/USD remains tilted to the downside based on daily technical indicators. Trading below the daily Bollinger middle band of 0.59012 alongside a negative MACD of -0.00067 suggests persistent selling pressure. If bears sustain momentum below 0.58000, price may extend towards the key support level at 0.56245. Conversely, any corrective pullbacks face initial hurdles near the 0.59012 middle band before testing major resistance at 0.59860.
Disclaimer: The analysis provided for NZD/USD is for informational purposes only and does not constitute investment advice. Traders are encouraged to perform their own analysis and research before making any trading decisions. Market conditions can change quickly, so staying informed with the latest data is essential.