Time Zone: GMT +3
Time Frame: Daily (D1) / Weekly Outlook
Weekly Fundamental Overview:
The NZD/USD currency pair has experienced selling pressure as traders evaluate upcoming US economic data releases against overall market risk appetite. Market sentiment surrounding the New Zealand Dollar remains tied to developments in global growth expectations and US monetary policy prospects.
Price Action:
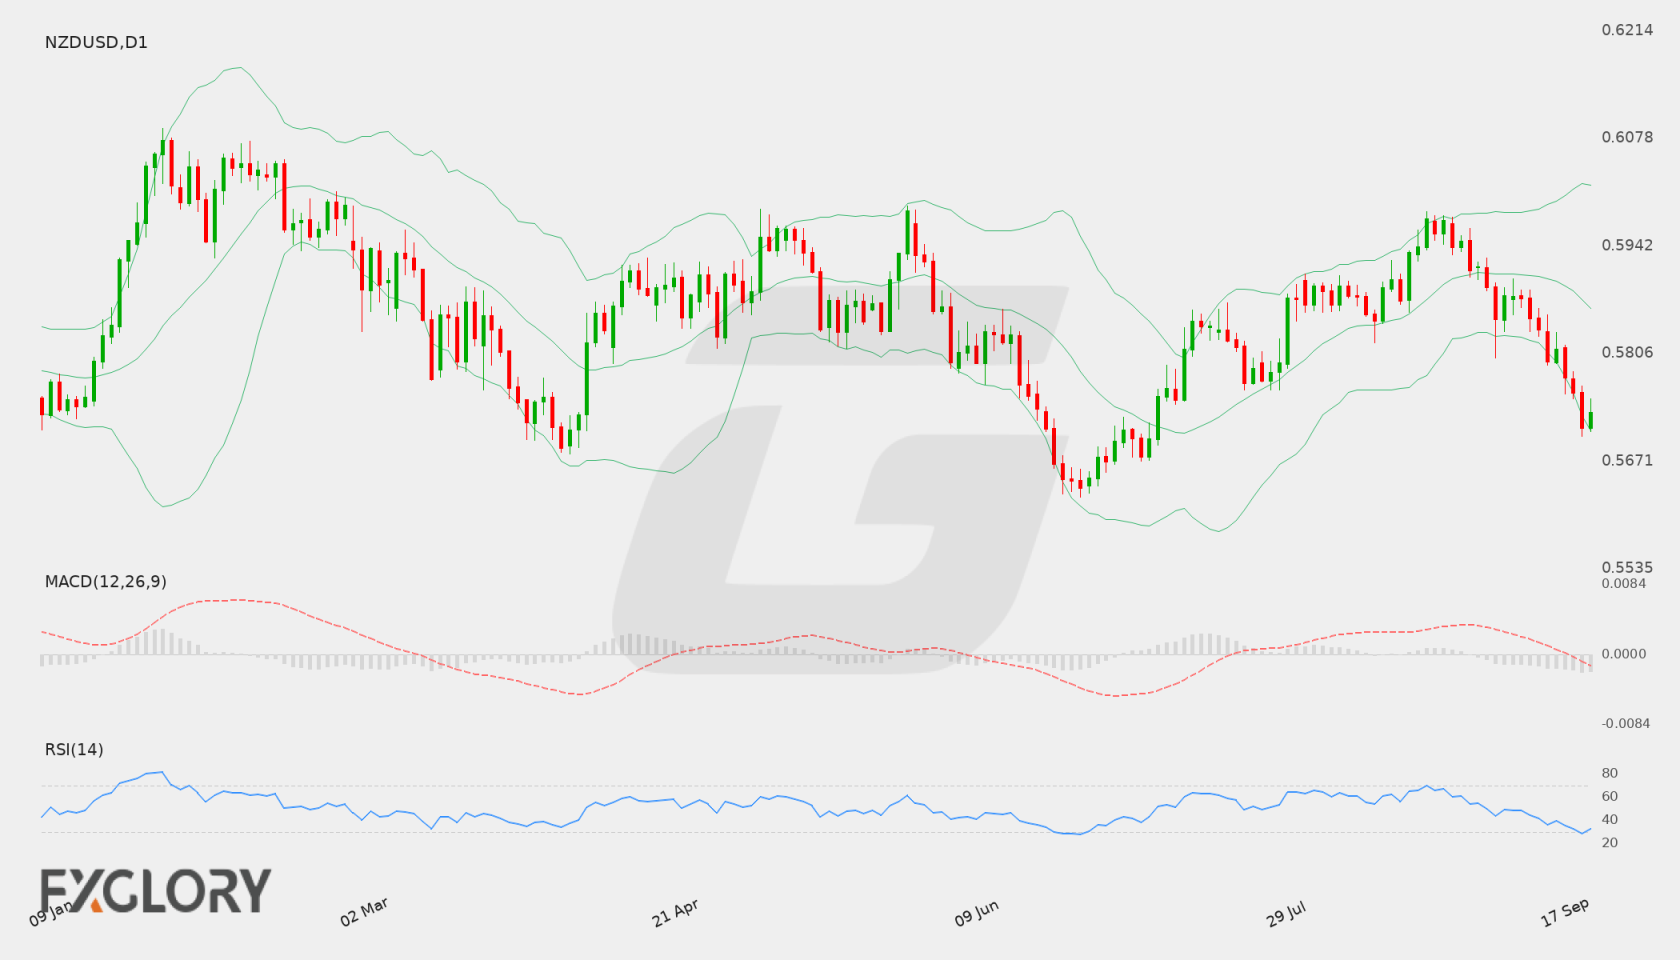
On the daily (D1) timeframe, NZD/USD shows a clear pullback from recent peaks near 0.5974 down toward the recent close around 0.57314. The recent candlestick structure indicates persistent downside pressure with a sequence of lower daily highs and lower lows.
Key Technical Indicators:
Bollinger Bands: The price is currently trading near the lower Bollinger Band at 0.57081. The middle band sits at 0.58637 with the upper band at 0.60193, highlighting an expanded volatility band aligned with recent downward price movements.
RSI: The 14-day Relative Strength Index (RSI) is recorded at 32.45, approaching oversold conditions, which indicates sustained selling momentum while opening the possibility for technical stabilization.
MACD: The daily MACD indicator sits below the signal line in negative territory at -0.00348, reflecting ongoing bearish momentum across recent trading sessions.
Support and Resistance:
Key technical support for NZD/USD is located around 0.56245, while major overhead resistance is identified at 0.5986.
News to Watch for NZDUSD This Week:
- CB Consumer Confidence: Reflects consumer sentiment regarding economic conditions and could influence US Dollar trends.
- JOLTS Job Openings: Highlights labor market demand and potential impacts on US monetary policy outlooks.
- ADP Non-Farm Employment Change: Serves as an early indicator of private payroll trends in the United States.
- Core PCE Price Index m/m: Provides critical insights into underlying inflation trends that guide monetary policy.
- Final GDP q/q: Offers a comprehensive measure of US economic growth performance over the previous quarter.
- ISM Manufacturing PMI: Measures purchasing manager activity to gauge health within the manufacturing sector.
- Average Hourly Earnings m/m: Tracks wage growth trends affecting broader inflation dynamics.
- Non-Farm Employment Change: Serves as a major driver of US Dollar volatility and labor market assessment.
- Unemployment Rate: Indicates the percentage of the labor force actively seeking employment in the US economy.
Weekly Outlook and Consideration:
NZD/USD enters the week under technical pressure, trading around 0.57314. Technical indicators on the D1 chart, including a negative MACD and an RSI near oversold levels, underscore the prevailing bearish tone. Should downward momentum continue, testing support at 0.56245 remains a possibility, while any corrective moves higher will face resistance near 0.5986. Traders will closely watch key macroeconomic data releases for directional cues.
Disclaimer: The analysis provided for NZD/USD is for informational purposes only and does not constitute investment advice. Traders are encouraged to perform their own analysis and research before making any trading decisions. Market conditions can change quickly, so staying informed with the latest data is essential.