
D1 structure and momentum lean toward the upside, but the reference close remains below primary resistance, so the weekly case depends on a completed D1 break and H4 follow-through.
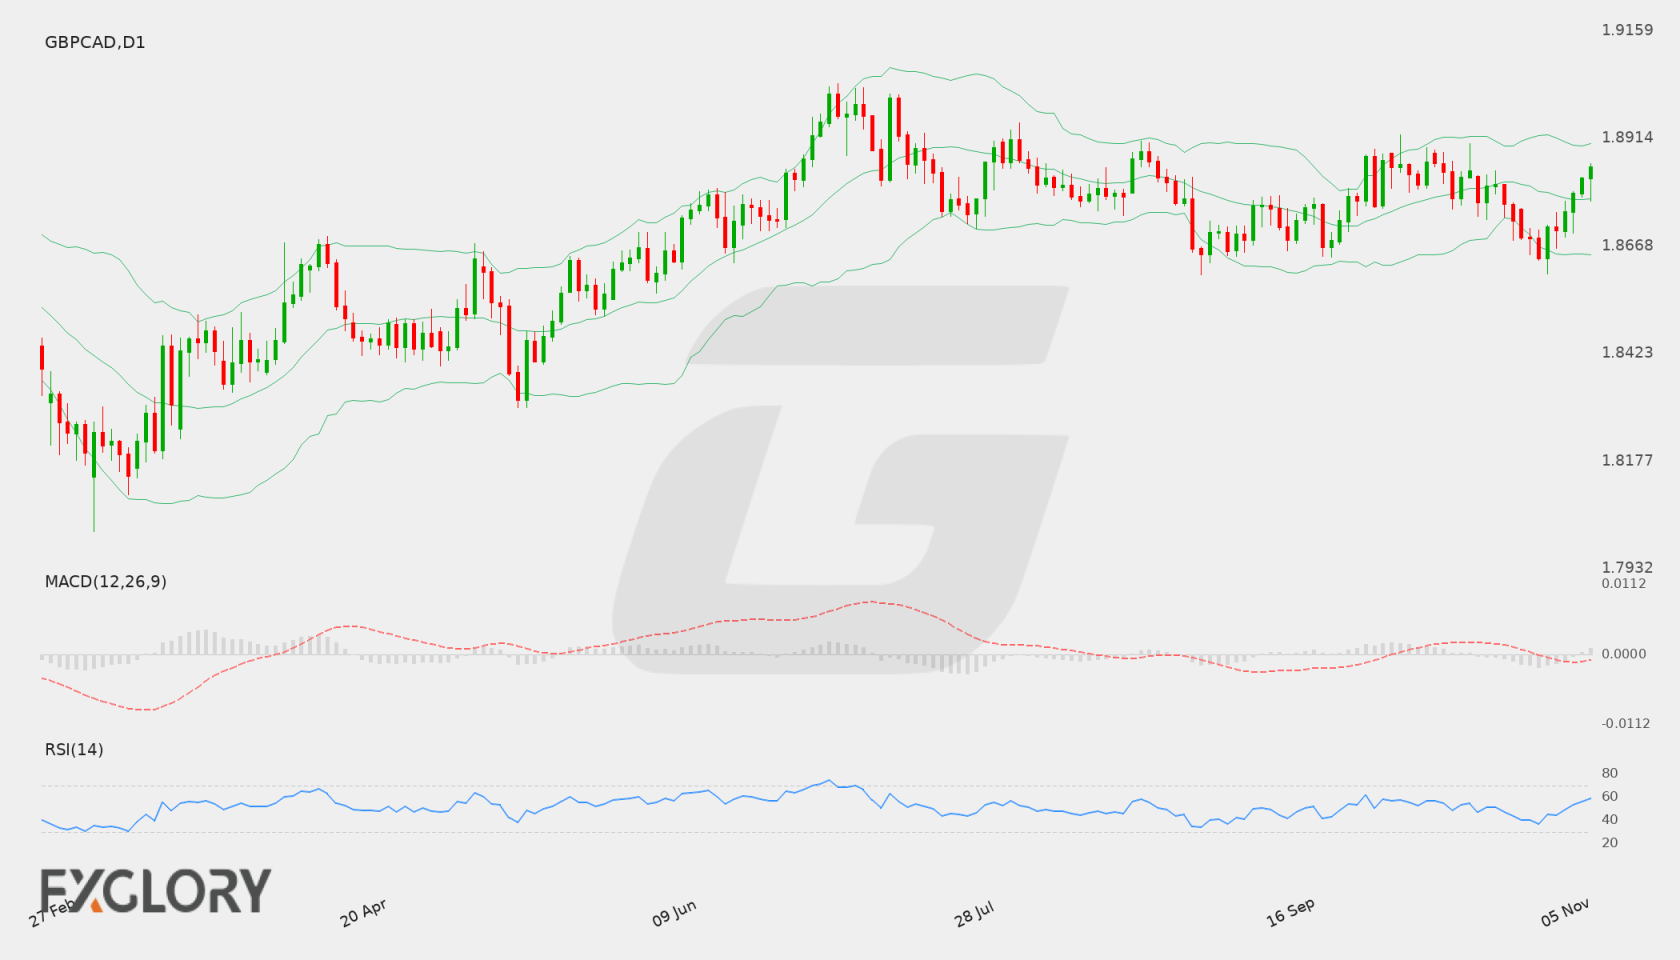
GBP/CAD Weekly Forecast at a Glance
In brief
Bullish bias for GBP/CAD over 8–14 November 2026, as D1 trend and momentum align above rising moving averages, though the close sits below primary resistance at 1.88895 and H4 confirms only tactically.
The controlling D1 picture is constructive. The reference close of 1.88503 follows consecutive higher closes and sits above the EMA20 at 1.87771, the EMA50 at 1.87748 and the SMA200 at 1.86458, with the EMA50 and SMA200 both rising. That alignment makes the weekly thesis rest on trend persistence rather than a single bounce. Momentum supports it: D1 RSI at 58.47 is above 50, and the MACD line sits above its signal with a positive histogram. The main caveat is location. The close is above primary support at 1.88096 but still below primary resistance at 1.88895, so price has not yet moved into the zone that would open the first bullish reference target.
Tactically, H4 agrees with the D1 direction but does not yet dominate. The H4 close of 1.88503 is above H4 support at 1.88495 and the H4 EMA20 at 1.8813, with H4 RSI at 65.98 and MACD above its signal. However, the H4 histogram is only marginally positive and price remains below H4 resistance at 1.88608, so the picture is tactical confirmation without a clean upside extension. Volatility is stable, which describes a measured environment rather than a direction. Scheduled GBP events on 9 and 12 November add repricing risk around these levels, most notably the high-impact GDP release.
- Bullish targets
-
- T11.89489
- T21.90159
- Bearish targets
-
- T11.87708
- T21.87283
- Invalidation
- One completed D1 close below 1.86492.
Selected key events
- GDP m/m12 Nov 2026 10:00 GMT+3High
- BOE Gov Bailey Speaks9 Nov 2026 20:25 GMT+3Medium
- Prelim GDP q/q12 Nov 2026 10:00 GMT+3Medium
| Price at last update | 1.88554 as of 07 Nov 2026 02:50 GMT+3 |
|---|---|
| Completed D1 reference close | 1.88503 as of 6 November 2026 |
| Primary support | 1.88096 |
| Secondary support | 1.87708 |
| Primary resistance | 1.88895 |
| Bullish targets | 1.89489, 1.90159 |
| Bearish targets | 1.87708, 1.87283 |
| Formal weekly thesis invalidation | Lower 1.86492 — One completed D1 close below 1.86492 formally invalidates the bullish weekly thesis. |
Live GBP/CAD Tools
A forecast is a snapshot. These pages keep moving with the market.
- Live
Live chart & price
Watch GBP/CAD move tick by tick. Flip from the 1-minute chart to the monthly, with trading conditions right alongside.
- Live
Technical signals
Buy, sell or sit it out? Oscillators, moving averages and pivot points boiled down to one clear reading, updated live.
Economic calendar
Know what's coming before it hits the price: every scheduled release with impact, forecast and actual.
Historical data
Open, high, low and close on any timeframe from 1 minute to monthly. Test your idea, then download the data.
All GBP/CAD forecasts
Every weekly outlook in one place. Scroll back to see how earlier calls played out against the chart.
GBP/CAD Fundamental Drivers This Week
Scheduled economic events relevant to GBP/CAD during 8–14 November 2026 include BOE Gov Bailey Speaks, GDP m/m, Prelim GDP q/q. Directional impact depends on the released data relative to supplied expectations.
Scroll table sideways for more columns →
| Event | Scheduled | Importance | Consensus | Previous |
|---|---|---|---|---|
| BOE Gov Bailey Speaks | 9 Nov 2026 20:25 GMT+3 | Medium | — | — |
| GDP m/m | 12 Nov 2026 10:00 GMT+3 | High | 0.0% | 0.1% |
| Prelim GDP q/q | 12 Nov 2026 10:00 GMT+3 | Medium | 0.7% | 0.5% |
Current GBP/CAD Price and Weekly Market Context
Structurally, D1 controls the weekly thesis and is bullish, with consecutive higher closes and a close above all three moving-average references. Momentum endorses this rather than contradicting it, with D1 RSI above 50 and MACD above its signal. What holds the picture back from a stronger reading is position inside the range: price sits between primary support at 1.88096 and primary resistance at 1.88895 and has not yet cleared the resistance that would open the first bullish reference target. H4 is supportive but not decisive, and volatility is stable, which points to measured development. Event risk is concentrated on 12 November.
- D1 trendbullishClose vs 50 EMA and 200 SMA
- H4 tacticalbullishH4 close vs 20 and 50 EMA
- MomentumpositiveRSI and MACD histogram
- VolatilitystableD1 ATR change
Is GBP/CAD Bullish or Bearish This Week?
The bullish scenario is primary because D1 structure, momentum and moving averages align, but it needs a completed D1 close above primary resistance to move from a constructive range to a structural upside break. The base scenario describes consolidation between the two primary D1 levels. The bearish scenario is a countertrend alternative that requires a completed D1 close below primary support.
Scenario 1 of 3Bullish continuation
- D1 confirmation
- A completed D1 close above primary resistance at 1.88895 would move the thesis from a constructive range into a structural upside break, which is what makes the first bullish reference target at 1.89489 relevant.
- H4 tactical signal
- H4 closing above its resistance at 1.88608 would show the tactical layer extending beyond its current ceiling rather than only holding support, aligning short-term price with the D1 break level.
- Targets
- 1.89489, 1.90159
- Scenario failure condition
- A completed D1 close below primary support at 1.88096 would weaken the bullish scenario, because the advance would lose its nearest structural floor and secondary support at 1.87708 would become the next reference.
Scenario 2 of 3Base / neutral
- D1 confirmation
- Completed D1 closes that remain between 1.88096 and 1.88895 keep the thesis in consolidation, with neither side yet confirmed on the controlling timeframe.
- H4 tactical signal
- H4 price oscillating around the 1.88495 support and 1.88608 resistance, with its momentum histogram near flat, would reinforce the consolidation reading.
- Targets
- A range between 1.88096 and 1.88895. If the range resolves, 1.89489 and 1.87708 are the next structural references in each direction.
- Scenario failure condition
- A completed D1 close outside the 1.88096 to 1.88895 range would end the range-bound reading and shift emphasis to the directional scenario that matches the break.
Scenario 3 of 3Bearish reversal
- D1 confirmation
- A completed D1 close below primary support at 1.88096 would turn the constructive trend picture into a range breakdown, bringing secondary support at 1.87708 into focus.
- H4 tactical signal
- An H4 close below its support at 1.88495 would show the tactical layer losing its current footing, which would make a D1 test of lower structure more immediate.
- Targets
- 1.87708, 1.87283
- Scenario failure condition
- A completed D1 close back above primary resistance at 1.88895 would weaken the bearish scenario and restore the bullish structure.
GBP/CAD D1 Outlook and H4 Technical Triggers
The daily timeframe controls the weekly thesis. H4 evidence is used only for earlier confirmation, tactical warning and scenario-failure context. Complete live H4, H1 and intraday readings remain on the Technical page.
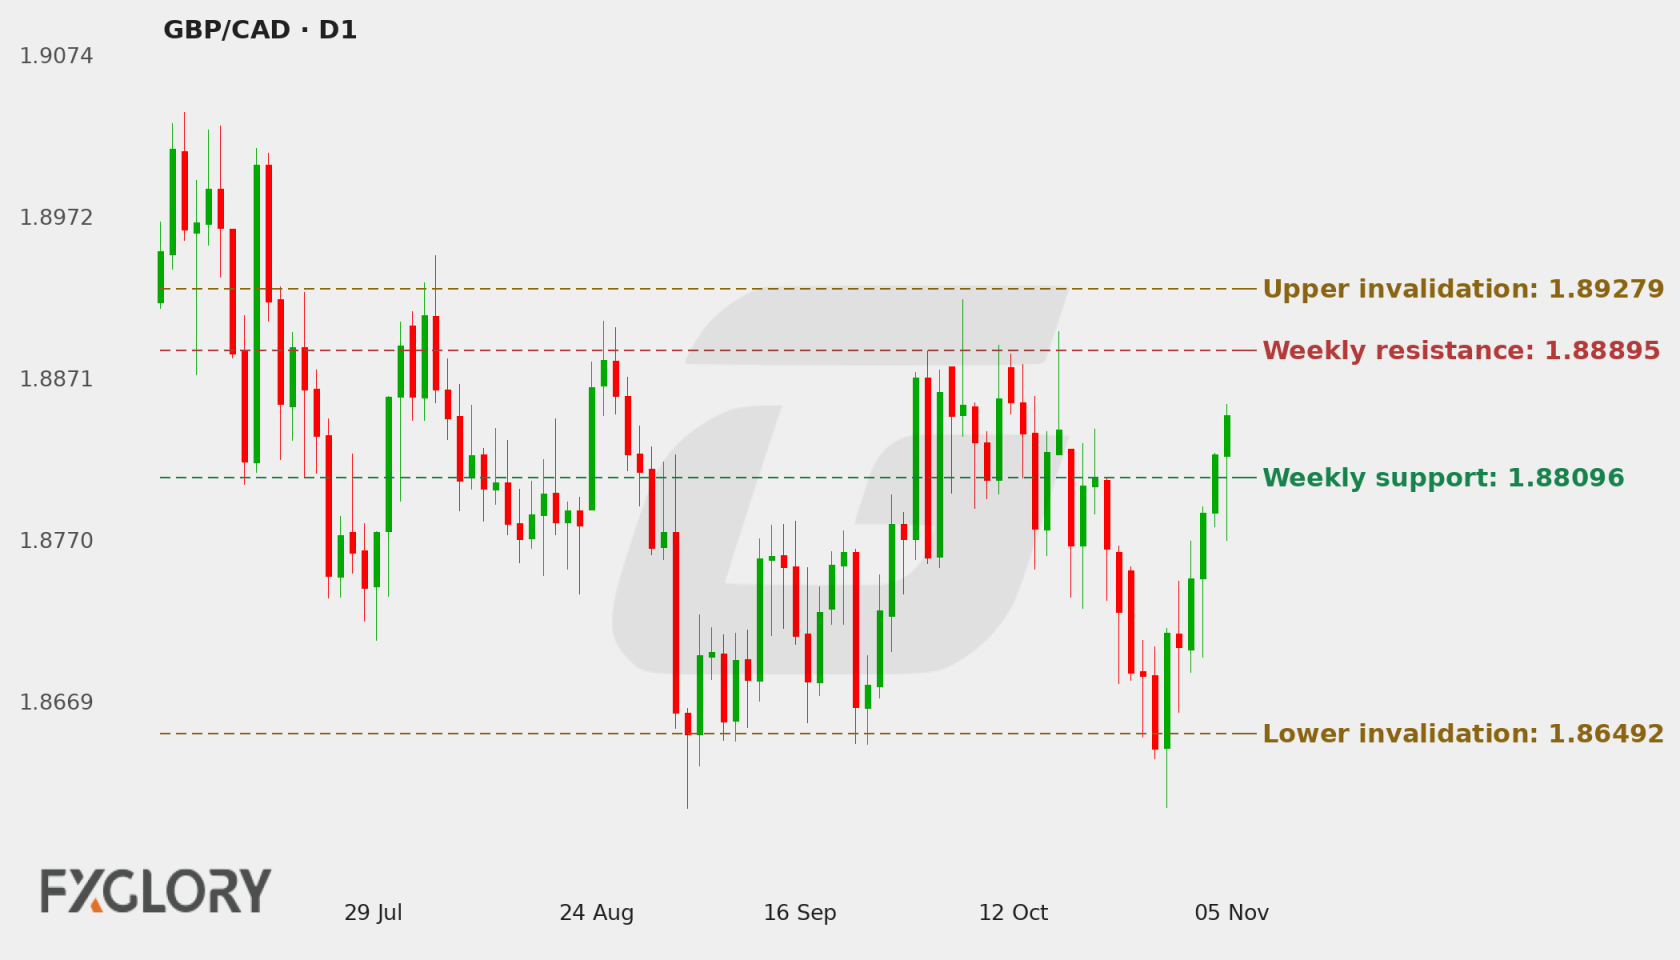
D1 Price Action and Market Structure
The D1 reference close of 1.88503 sits above primary support at 1.88096 and below primary resistance at 1.88895, so price is inside the weekly range. The close sequence of consecutive higher closes is the strongest price-action evidence in favour of the bullish thesis, but the close has not yet reached the upper boundary of the range.
H4 Tactical Triggers
H4 agrees with the D1 direction but does not yet dominate. The H4 close is above its support at 1.88495 and its EMA20 at 1.8813, with RSI at 65.98 and MACD above signal, which confirms short-term strength. The H4 histogram is only marginally positive and price sits below H4 resistance at 1.88608, so the tactical layer confirms the D1 thesis without leading it.
Technical Indicators at a Glance
Automated technical summary
D1 is bullish, H4 is bullish, momentum is positive and volatility is stable. The D1 reference close of 1.88503 is above primary support at 1.88096 and below primary resistance at 1.88895.
Selected snapshot: D1 with H4 tactical context. Updated 8 November 2026.
- RSI58.47Neutral
- MACDAbove signalBullish
- Bollinger Bands80% of bandUpper half
- Moving averagesAbove bothBullish
- ATR77.6 pipsStable
RSI (14)
Neutral
H4 65.98
D1 RSI at 58.47 sits above the midline, supporting the trend without signalling any extreme. H4 RSI at 65.98 is firmer, which shows short-term momentum running stronger than on the controlling timeframe.
- D1 RSI
- 58.47
- H4 RSI
- 65.98
MACD (12, 26, 9)
Bullish momentum
D1 MACD is above its signal with a positive histogram, confirming the momentum behind the trend. H4 MACD is also above its signal, but its histogram is marginal, so tactical momentum is positive yet shows little expansion.
- MACD
- 0.000612
- Signal
- -0.000657
- Histogram
- 0.00127
Bollinger Bands (20, 2σ)
Upper half
Striped ends = price outside the bands.
The D1 close sits above the middle band and inside the band structure below the upper band, which fits a position within the bands rather than an extension at the edge. On H4, the close is above the middle band and below the upper band, consistent with the tactical picture.
- Position in band
- 80%
- Band width
- 251.5 pips (1.34%)
Moving averages (D1)
Bullish structure
- 50 EMA rising1.87748Price is 75.5 pips above (+0.40%)
- 200 SMA rising1.86458Price is 204.5 pips above (+1.10%)
The D1 close sits above the EMA20, EMA50 and SMA200, with the EMA50 and SMA200 both rising, so trend support is present across short, medium and long reference averages. On H4, the close is above both the EMA20 and EMA50, which supports the tactical alignment.
- D1 close
- 1.88503
- 50 EMA
- 1.87748
- 200 SMA
- 1.86458
ATR (14)
Stable volatility
One ATR either side of the latest close. A measure of move size, not a price target.
D1 ATR of 0.00776 and H4 ATR of 0.0032 describe typical movement in each timeframe. With volatility stable, the environment favours measured development rather than rapid expansion or compression, and ATR is used here as context only, not as a directional or level input.
- D1 ATR
- 0.00776 (0.41%)
- H4 ATR
- 0.0032 (0.17%)
Technical conclusion: The weekly thesis is bullish because D1 structure, moving averages and momentum agree, and H4 is supportive. The strongest counterargument is positional: the close is still below primary resistance at 1.88895 and the H4 histogram is marginal, so the bullish case has not yet expanded. The levels that matter next are 1.88895 and 1.89489 on the upside, 1.88096 on the downside, and 1.86492 as the lower boundary of the forecast.
View all live GBP/CAD oscillators, moving averages, pivot points and timeframe signals.
GBP/CAD Weekly Support, Resistance and Invalidation
| Level | Role | Timeframe | Why it matters |
|---|---|---|---|
| 1.88096 | Primary support | D1 | It is the nearest structural floor beneath the reference close, and losing it on a completed D1 close would weaken the bullish scenario. |
| 1.87708 | Secondary support | D1 | It is the next structural reference below primary support and one of the bearish reference targets. |
| 1.87283 | Support candidate | D1 | It is the lowest support candidate in the ladder and the second bearish reference target. |
| 1.88895 | Primary resistance | D1 | A completed D1 close above it is the main confirmation threshold for the bullish scenario. |
| 1.89489 | Secondary resistance | D1 | It is the first bullish reference target and the next structural resistance above the primary level. |
| 1.90159 | Resistance candidate | D1 | It is the second bullish reference target and the highest resistance candidate in the ladder. |
| 1.88495 | Support | H4 | It is the tactical floor for H4, and a close below it would signal the tactical layer losing support. |
| 1.88608 | Resistance | H4 | It is the tactical ceiling for H4, and a close above it would show short-term price extending beyond current resistance. |
These are forecast-specific market-structure levels. Formula-based Classic, Fibonacci and Camarilla pivots remain on the Technical page.
Economic News & Events to Watch for GBP/CAD This Week
Selected events may increase GBP/CAD volatility. Direction depends on the released value relative to consensus and previous results.
Scroll table sideways for more columns →
| Event | Date and time | Importance | Previous | Consensus |
|---|---|---|---|---|
| GDP m/m | 12 Nov 2026 10:00 GMT+3 | High | 0.1% | 0.0% |
| BOE Gov Bailey Speaks | 9 Nov 2026 20:25 GMT+3 | Medium | — | — |
| Prelim GDP q/q | 12 Nov 2026 10:00 GMT+3 | Medium | 0.5% | 0.7% |
Calendar source: FXGlory economic calendar. Retrieved 08 Nov 2026 17:24 GMT+3. View the complete GBP/CAD economic calendar.
GBP/CAD Outlook for 8–14 November 2026
The weekly thesis is bullish, anchored by D1 structure, consecutive higher closes, rising longer-term averages and positive momentum. H4 supports that view tactically, but the reference close is still below primary resistance at 1.88895, so the bullish case has not yet been expressed as a structural break. The bullish reference targets at 1.89489 and 1.90159 only become relevant after that threshold is cleared on a completed D1 close.
The range between 1.88096 and 1.88895 is the most immediate structural area for the week, and it is where consolidation would be expected to develop if neither side is confirmed on a completed D1 close. Scheduled GBP events on 9 and 12 November are catalysts for volatility that could test these boundaries, but they do not change the structure on their own. A completed D1 close below 1.86492 would end the bullish thesis.
Weekly Forecast Risks and What Would Change the Outlook
- Timeframe tension below resistance: The D1 close remains below 1.88895 while H4 confirms tactically, so the constructive thesis has not yet been expressed on the controlling timeframe.
- Narrowing H4 momentum: The H4 MACD histogram is only marginally positive, so short-term momentum shows limited expansion even though the H4 close is above its support and EMAs.
- GDP-driven repricing: The high-impact GDP release on 12 November is a potential volatility catalyst that could test the 1.88096 and 1.88895 levels, though it does not imply a direction.
- Countertrend pressure toward support: A completed D1 close below 1.88096 would break the nearest structural floor, but the bearish case has limited momentum support because D1 MACD and RSI remain constructive, so it would rely mainly on price structure.
Formal weekly invalidation: The bullish weekly thesis is formally invalidated by one completed D1 close below 1.86492. One completed D1 close above 1.89279 confirms upper structural extension and continuation.
GBP/CAD Weekly Forecast FAQs
Is GBP/CAD bullish or bearish this week?
The weekly bias is Bullish because the D1 trend, close sequence, moving averages and momentum point the same way, while the close has not yet cleared primary resistance. It is a conditional bias, not a certainty.
What scenario would strengthen for GBP/CAD this week?
The primary scenario is continuation higher if a completed D1 close clears 1.88895, which would bring the 1.89489 and 1.90159 reference levels into focus. If price instead holds inside the 1.88096 to 1.88895 range, the market is in consolidation. A completed D1 close below 1.88096 would shift emphasis toward the bearish alternative.
What are the key GBP/CAD support and resistance levels?
Primary support is 1.88096 and secondary support is 1.87708, with 1.87283 as the next support candidate. Primary resistance is 1.88895 and secondary resistance is 1.89489, with 1.90159 as the next resistance candidate. The bullish reference targets are 1.89489 and 1.90159, and the bearish reference targets are 1.87708 and 1.87283.
What would invalidate this GBP/CAD forecast?
The bullish weekly thesis is formally invalidated by one completed D1 close below 1.86492.
Methodology, Data and Sources
- Price-data source: FXGlory price feed (GBPCAD)
- Live quote timestamp: 07 Nov 2026 02:50 GMT+3
- Weekly analysis timestamp: 8 November 2026
- Chart timestamp: 8 November 2026 (redrawn daily)
- Daily check: Every day at 04:00 GMT+3: the latest completed D1 close is checked against the invalidation levels and the chart is redrawn.
- Technical snapshot timestamp: 8 November 2026
- Calendar-data source: FXGlory economic calendar
- Calendar retrieval timestamp: 08 Nov 2026 17:24 GMT+3
- Candle convention: FXGlory D1 and H4 candles; D1 candle dates are evaluated in UTC and invalidation uses completed D1 closes only.
- Indicator settings: D1 RSI(14), MACD(12,26,9), Bollinger Bands(20,2), EMA(50), SMA(200), ATR(14); H4 RSI/MACD/Bollinger/EMA/ATR.
- Level-selection method: Weekly D1 support/resistance levels are structural market levels. Formal invalidation uses a hard 1.00× D1 ATR(14) minimum anchor distance plus a 0.00× D1 ATR(14) outward buffer; H4 levels are tactical only.
- Weekly forecast method: D1 controls the weekly thesis; H4 supplies tactical confirmation/warning only.