AUD/NZD Forecast — 3 October 2026
Time Zone: GMT +3
Time Frame: Daily (D1) / Weekly Outlook
Weekly Fundamental Overview:
The AUD/NZD currency pair continues to reflect comparative economic dynamics between Australia and New Zealand, with market participants closely observing macroeconomic health indicators. Forthcoming Australian labor statistics represent the primary domestic catalyst that could alter policy trajectories and shape relative currency performance over the coming sessions.
Price Action:
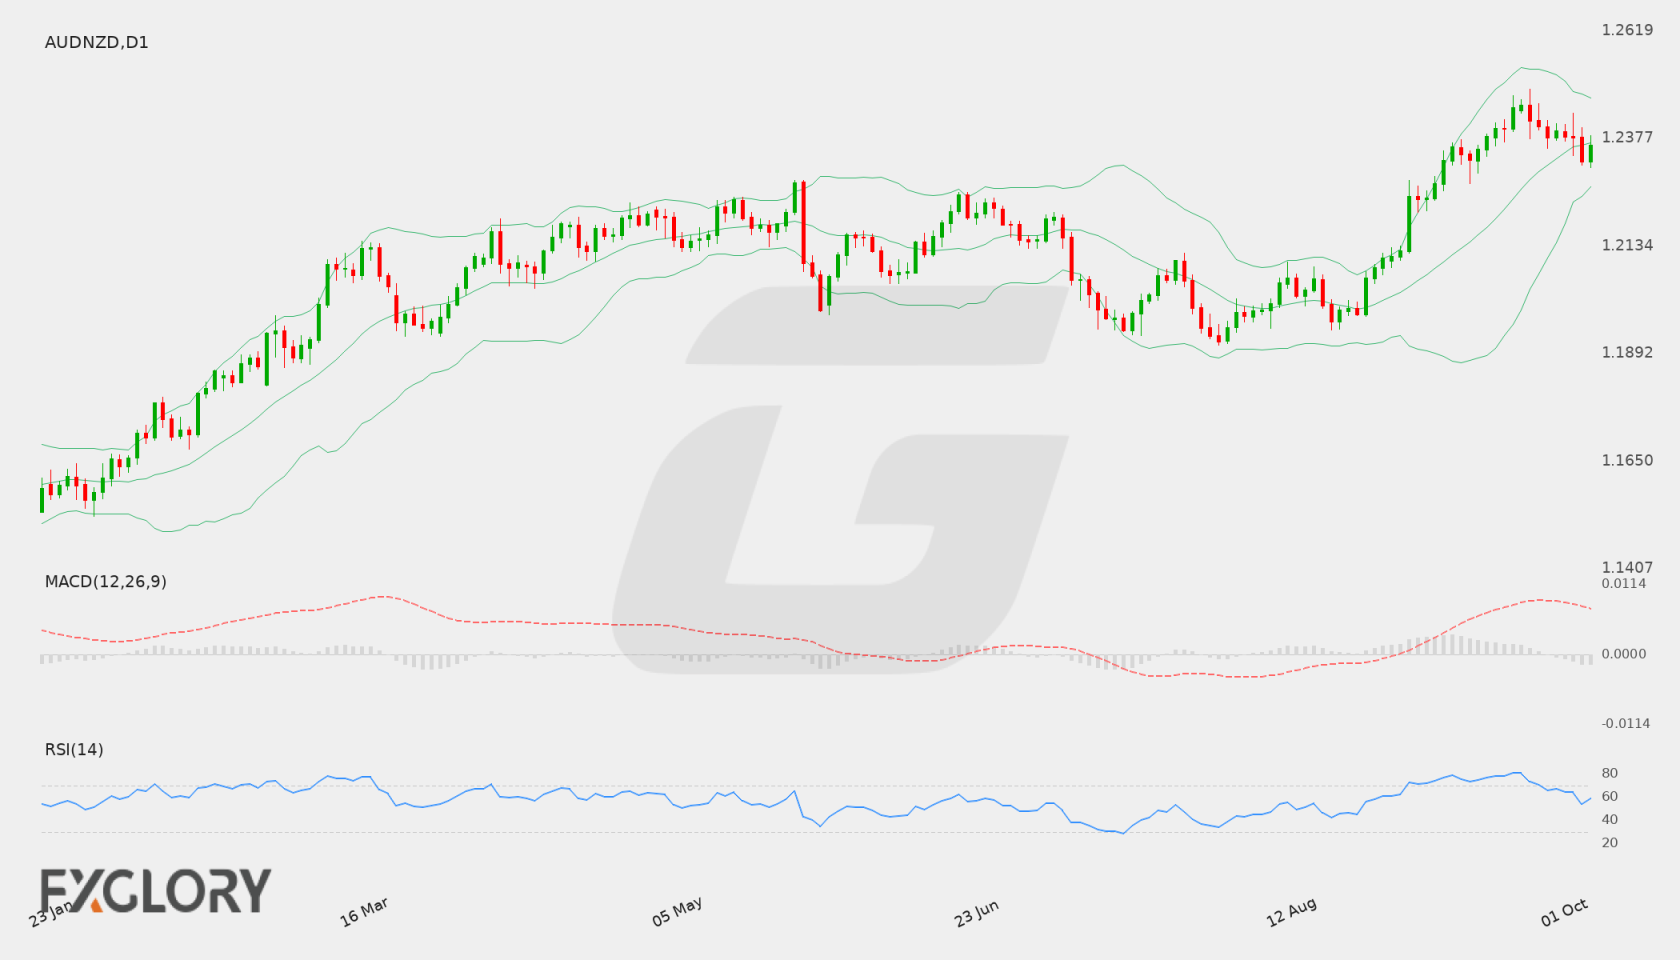
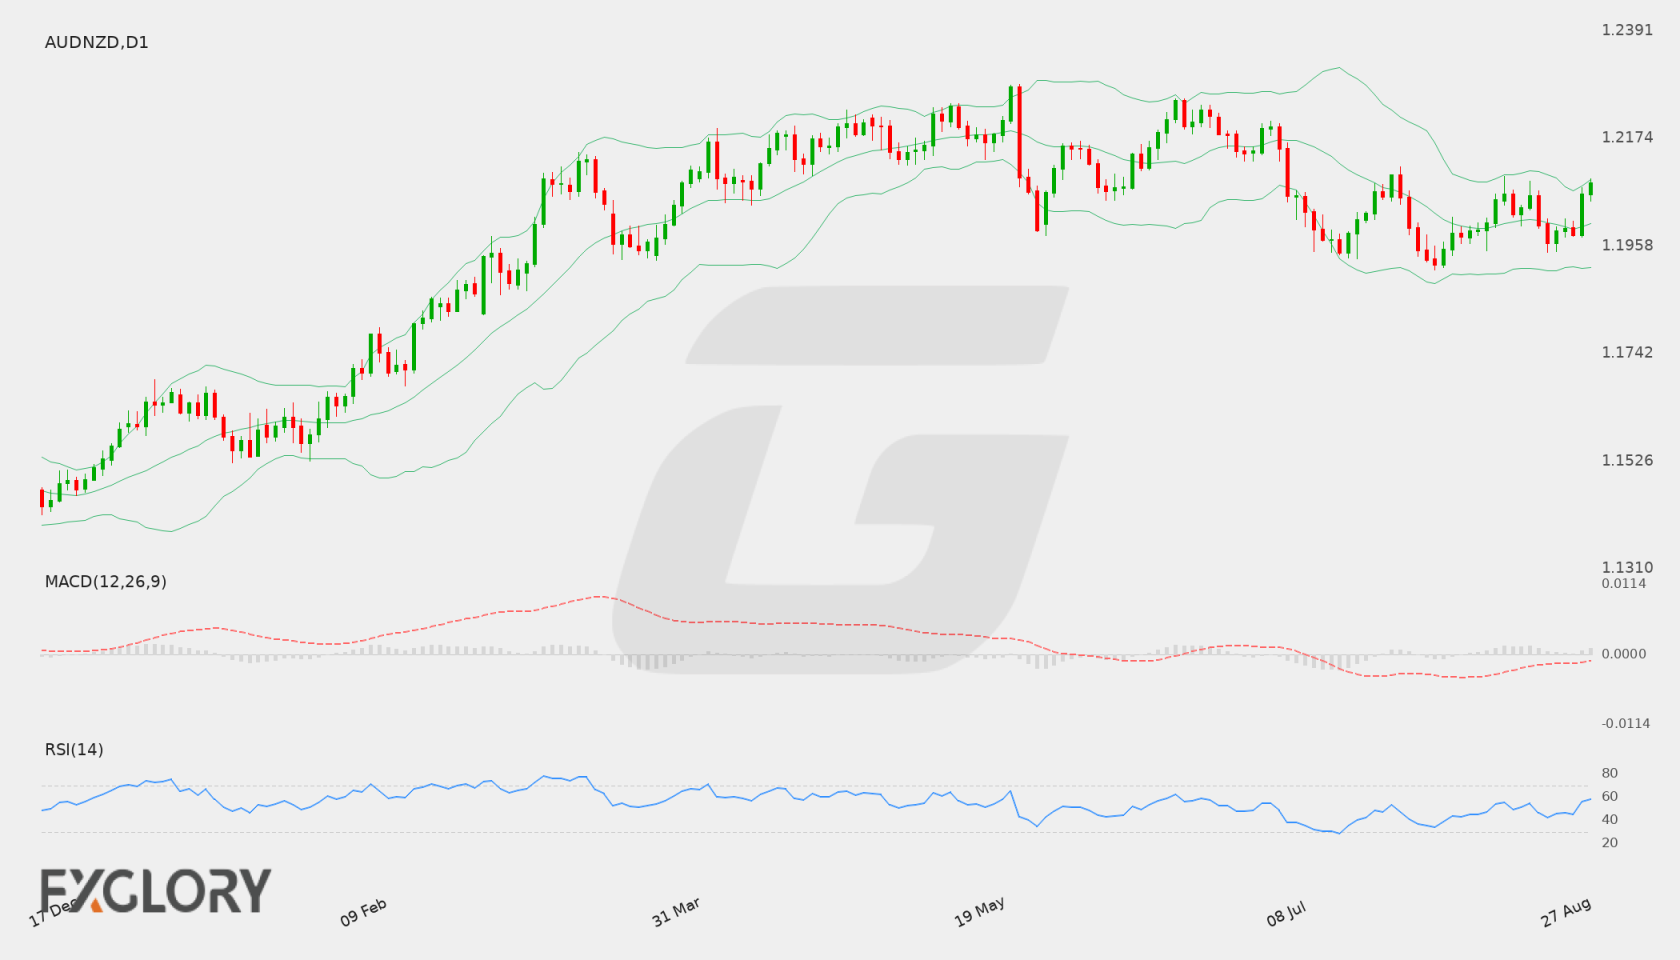
AUD/NZD daily price action demonstrates a broader upward advance from earlier lows, having pushed up toward resistance at 1.24875 before moderating. The pair concluded the latest session at 1.23611, consolidating near recent ranges after testing multi-week highs.
Key Technical Indicators:
Bollinger Bands: Daily Bollinger Bands reveal the pair fluctuating near the middle band of 1.23673. The upper band currently resides at 1.24678, while the lower band sits at 1.22668, outlining the recent volatility envelope for AUDNZD.
RSI: The 14-period Relative Strength Index (RSI) registers at 58.52. This level reflects a moderate positive bias for AUD/NZD while remaining well beneath overbought territory.
MACD: The daily Moving Average Convergence Divergence (MACD) prints at 0.00570. Holding in positive territory, the indicator shows sustained baseline upward momentum across recent daily trading periods.
Support and Resistance:
Key technical reference points for AUDNZD consist of established daily resistance at 1.24875 and baseline daily support located at 1.19102.
News to Watch for AUDNZD This Week:
- Unemployment Rate: Unexpected changes in joblessness may influence policy expectations and drive exchange rate volatility.
- Employment Change: Net job creation figures provide critical insight into underlying labor market momentum.
Weekly Outlook and Consideration:
AUD/NZD heads into the weekly trading window positioned at 1.23611, slightly below the Bollinger middle band at 1.23673. Bullish indicators including an RSI of 58.52 and a positive MACD value of 0.00570 point to resilient underlying momentum. Technical progress toward the upper band at 1.24678 and resistance at 1.24875 remains possible if buyers maintain control, whereas a shift in sentiment could test the lower band at 1.22668 ahead of broader support at 1.19102. Macroeconomic data releases concerning Australian employment will serve as pivotal directional drivers.
Disclaimer: The analysis provided for AUD/NZD is for informational purposes only and does not constitute investment advice. Traders are encouraged to perform their own analysis and research before making any trading decisions. Market conditions can change quickly, so staying informed with the latest data is essential.