Time Zone: GMT +3
Time Frame: Daily (D1) / Weekly Outlook
Weekly Fundamental Overview:
The AUD/NZD (AUDNZD) currency pair reflects economic dynamic shifts between Australia and New Zealand. Monetary policy expectations and cross-transman economic trends play key roles in defining medium-term directional bias. Traders remain attentive to macro conditions and growth metrics that could alter central bank expectations for both nations.
Price Action:
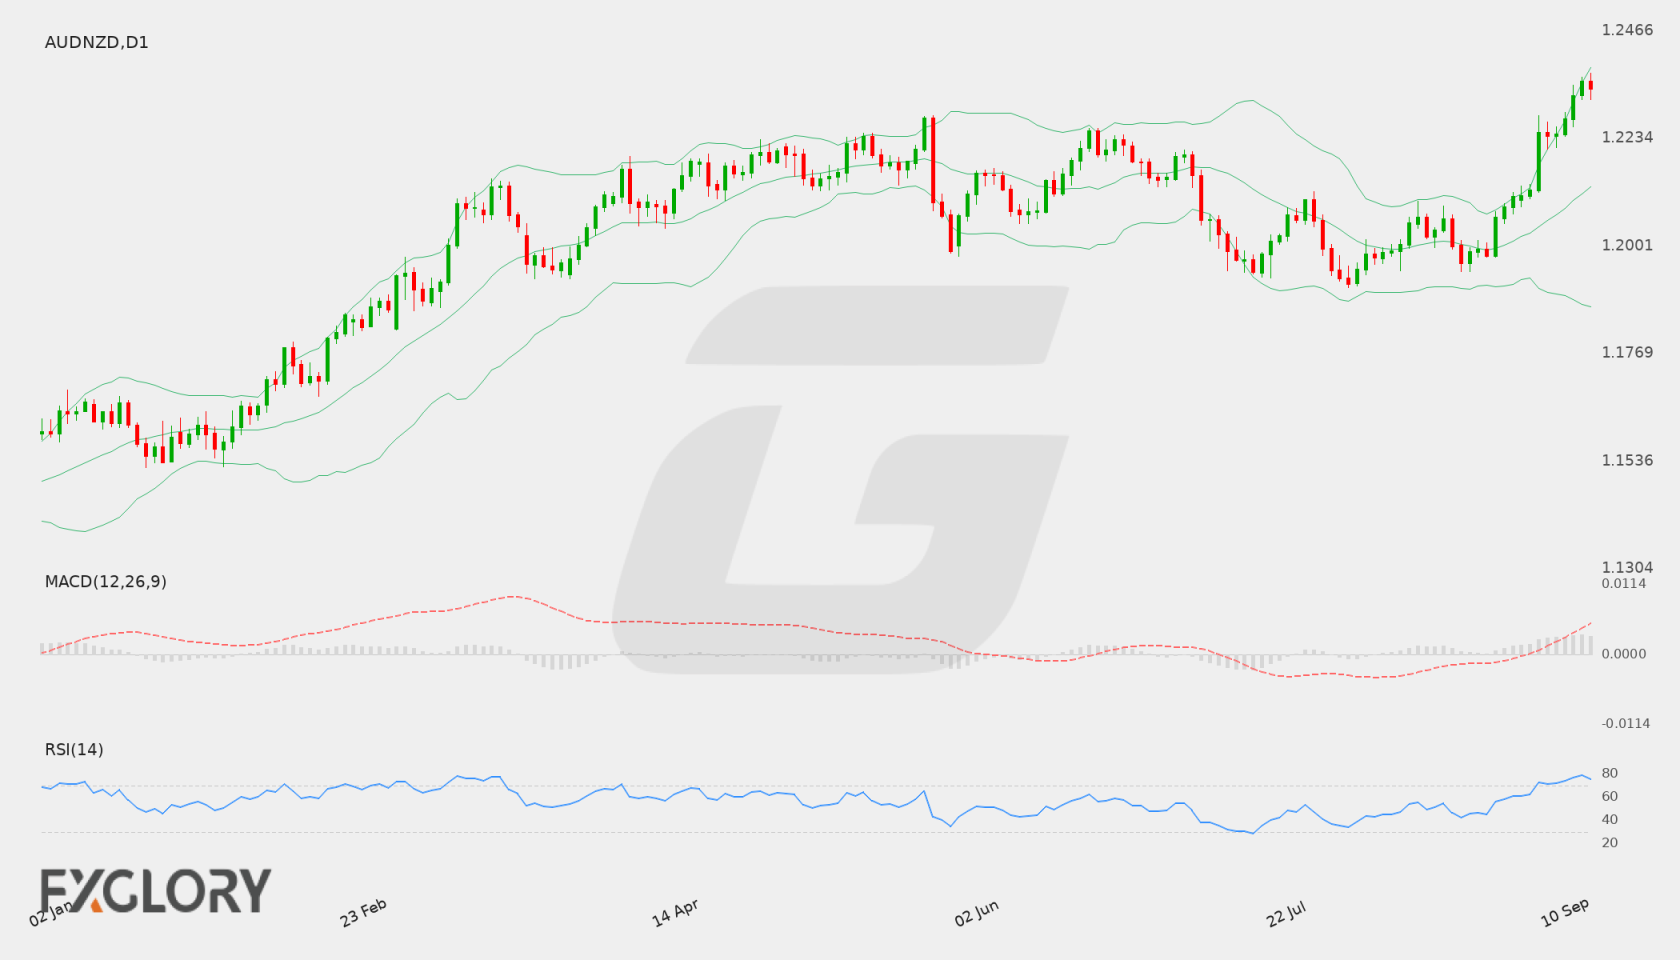
On the daily (D1) chart, AUD/NZD has exhibited a strong upward trajectory, rising significantly over recent sessions toward the 1.23745 mark. The pair reached a recent peak at resistance of 1.23745 before settling slightly lower at a close of 1.23413. This movement highlights ongoing bullish momentum, although the high test suggests buyers are encountering brief overhead resistance.
Key Technical Indicators:
Bollinger Bands: The daily Bollinger Bands highlight an expanded volatility environment for AUD/NZD. The middle band rests at 1.21281, while the lower band is located at 1.18702. Price action is currently hugging the upper band at 1.23860, indicating intense upward pressure while signaling that price is trading near upper boundary limits.
RSI: The 14-period RSI is currently at 75.50. This places AUD/NZD above the conventional 70 threshold into overbought territory, signaling strong buying force while pointing to the possibility of short-term consolidation or corrective retracements.
MACD: The MACD indicator stands at 0.007988, remaining in positive territory on the daily chart. This alignment confirms positive upside momentum and supports the broader bullish trend observed over the recent chart history.
Support and Resistance:
Key technical levels for AUD/NZD include immediate resistance at 1.23745, which caps recent upside attempts. On the downside, critical support is established at 1.19102, defining the major lower boundary from earlier chart trading.
News to Watch for AUDNZD This Week:
- GDP q/q: This quarterly economic output release reflects the overall economic health of New Zealand and can influence price movements across the pair.
Weekly Outlook and Consideration:
The weekly outlook for AUD/NZD remains constructively bullish on the daily chart, supported by positive MACD momentum and price action pushing toward resistance at 1.23745. However, with the RSI currently in overbought territory at 75.50 and price trading near the upper Bollinger Band of 1.23860, traders should be prepared for potential short-term pullbacks or sideways consolidation before any attempt at further upside continuation.
Disclaimer: The analysis provided for AUD/NZD is for informational purposes only and does not constitute investment advice. Traders are encouraged to perform their own analysis and research before making any trading decisions. Market conditions can change quickly, so staying informed with the latest data is essential.