
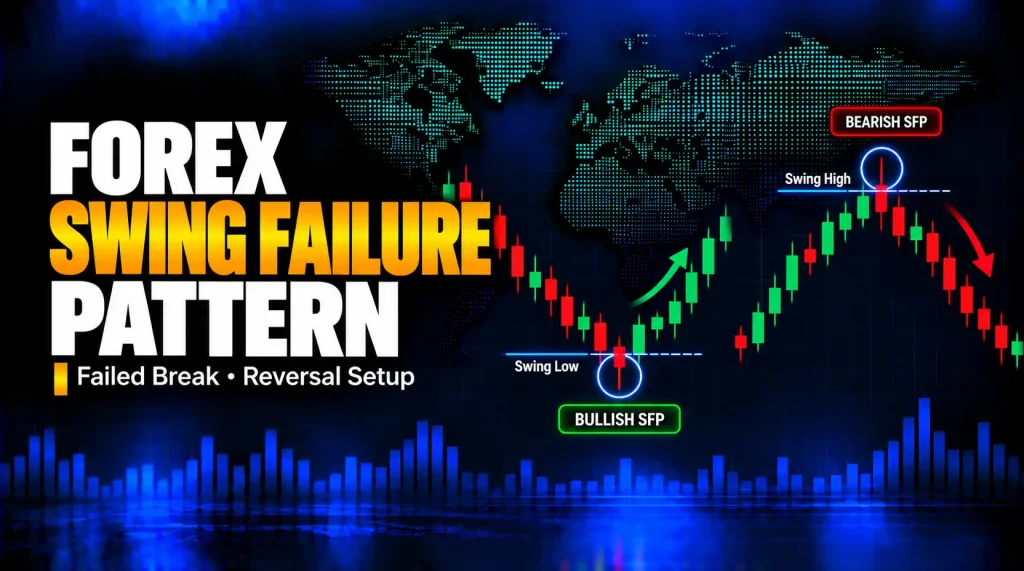
A swing failure pattern (SFP) forms when price moves beyond a previously identifiable swing high or swing low but the completed candle closes back on the original side of that level. The attempted break has failed by a defined chart rule. It may signal rejection, but it does not guarantee a reversal or reveal who placed orders.
On forex charts, an SFP can help a trader describe a possible false break at a meaningful price level. This lesson shows how to mark the level before the signal, distinguish bullish and bearish SFPs, and assess confirmation, execution costs and invalidation using hypothetical EUR/USD prices. Familiarity with candle highs and lows will help; review forex market structure if swing points are new to you.
What Is a Swing Failure Pattern?
A swing high is a local peak relative to nearby price bars; a swing low is a local trough. An SFP tests one of those earlier levels, briefly trades through it, and then closes back inside. For this guide, the complete candle must cross the level and close back across it on the same timeframe. Other traders use a looser, multi-candle definition; check the rules before comparing results.
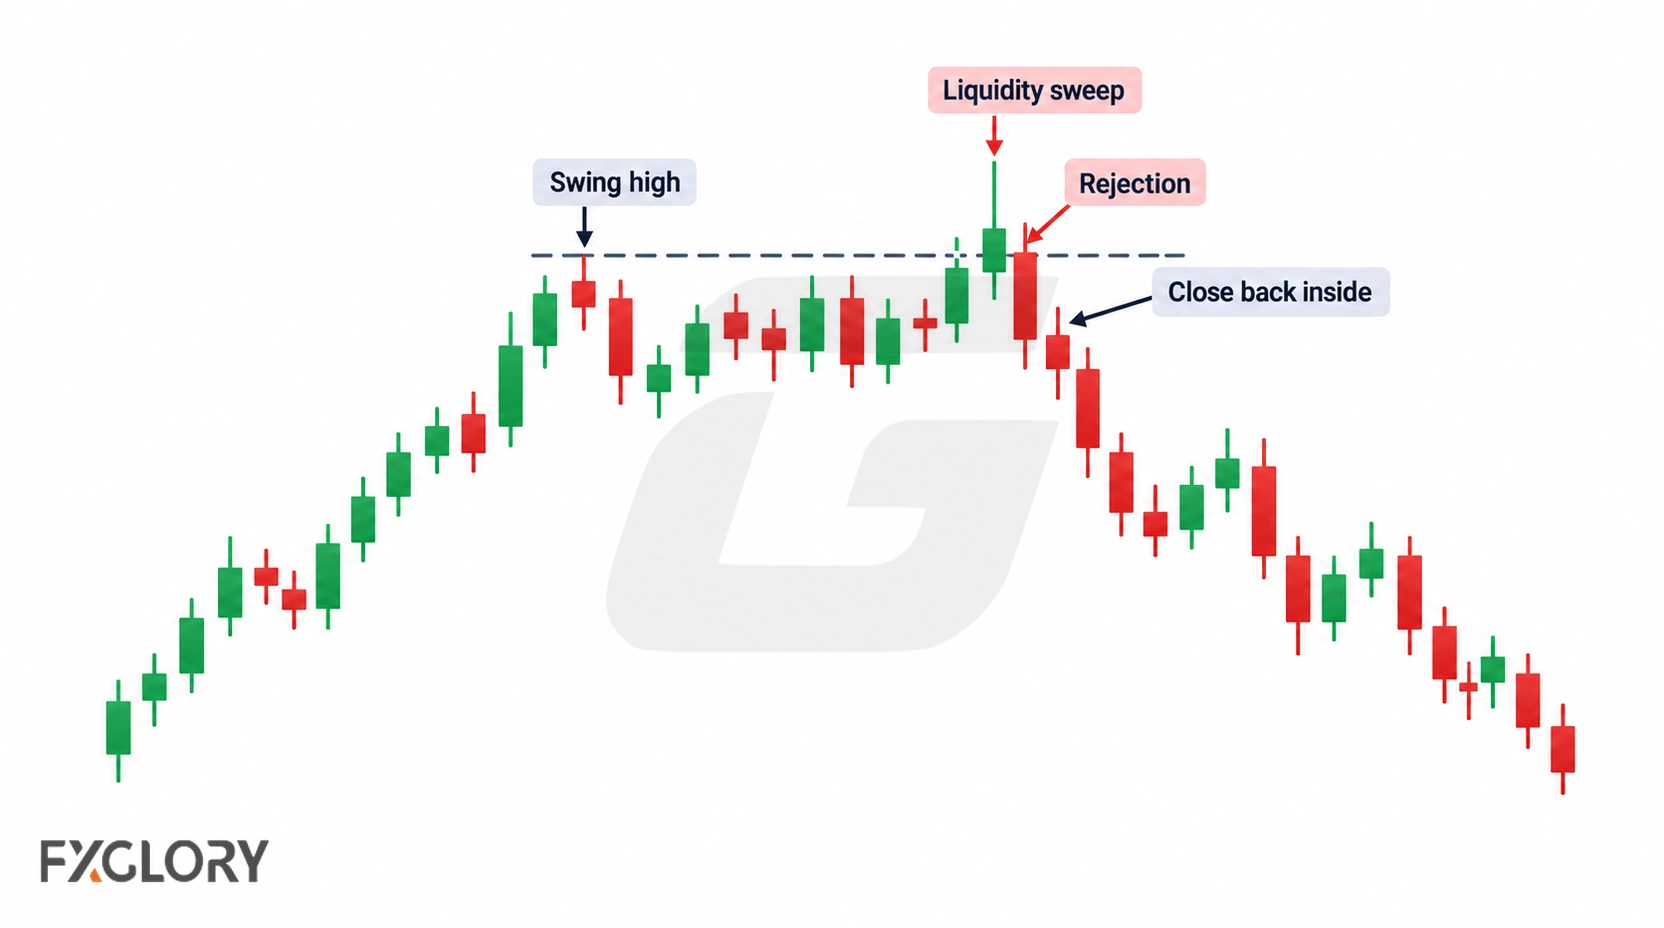
- Bearish SFP: a later candle's high exceeds an earlier swing high, but its close finishes below that earlier high.
- Bullish SFP: a later candle's low falls beneath an earlier swing low, but its close finishes above that earlier low.
- Still forming: a wick through a level is only a possible setup until the candle closes. The bar may finish beyond the level instead.
How to Recognize an SFP on a Forex Chart
- Choose the instrument and timeframe. For example, inspect EUR/USD on a one-hour chart. Apply the swing and closing-candle rule on that chart rather than mixing a one-minute close with an unfinished one-hour candle.
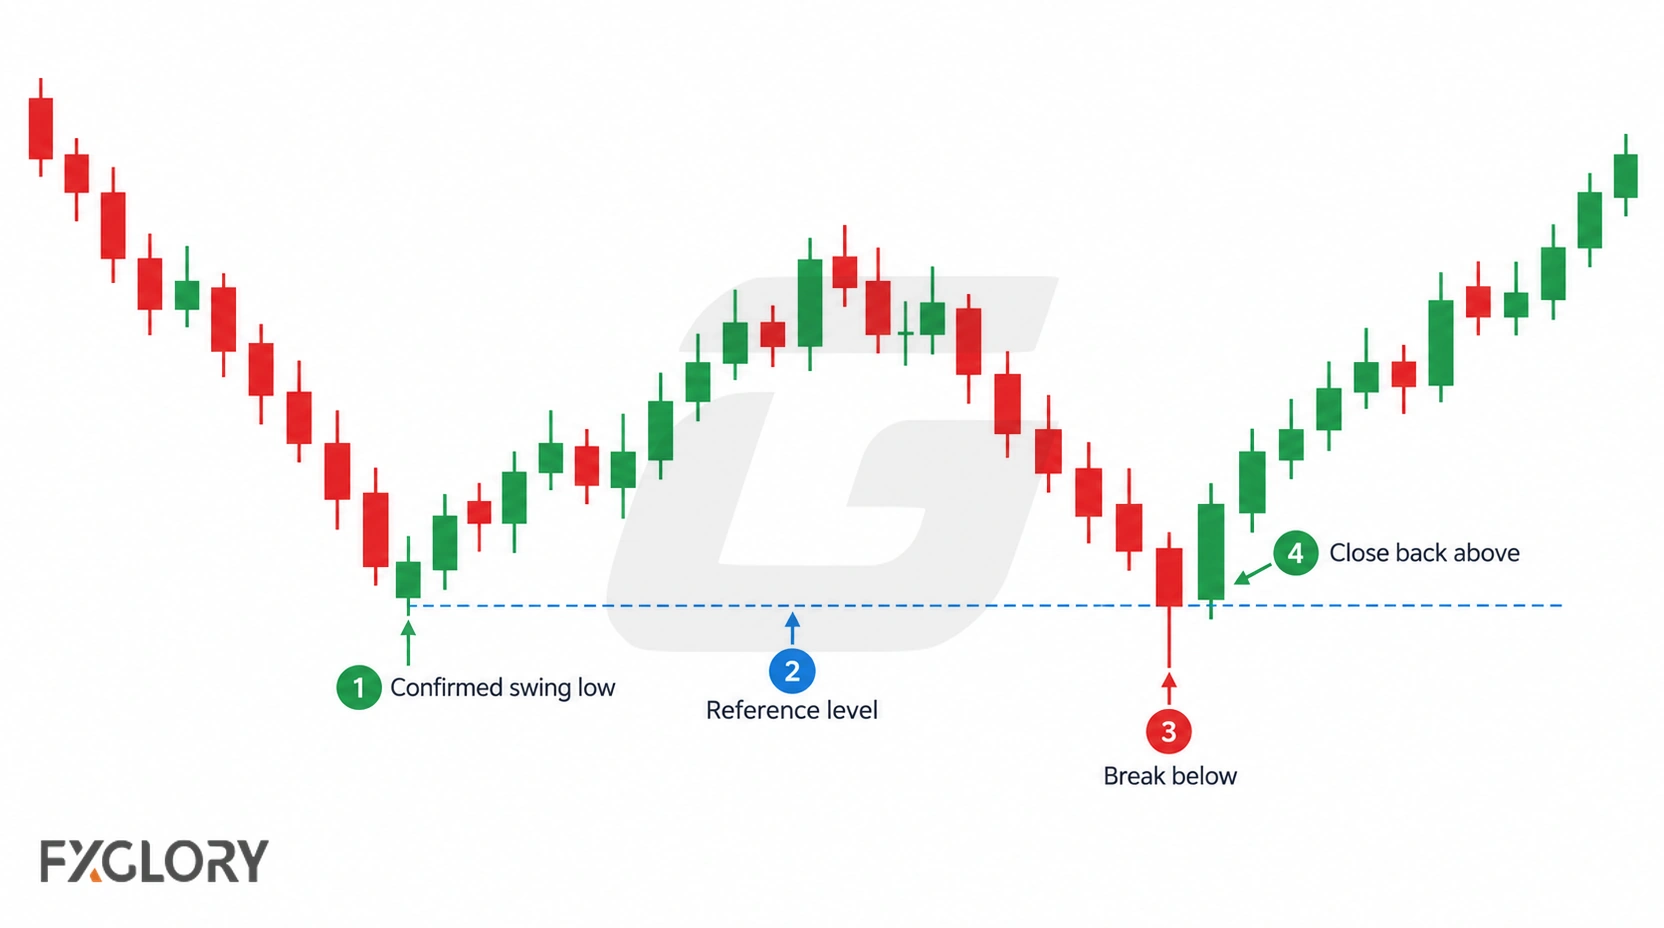
- Mark a swing that was knowable in advance. One illustrative rule is a high higher than each of the two completed candles to its left and two to its right (reverse the inequalities for a low). Under that rule the pivot becomes confirmed only after the two right-hand bars close. This is an example setting, not a universal SFP requirement.
- Freeze the reference level. Draw the confirmed high or low before looking for its later failure. Record how equal highs or lows are treated; a tie is not a strict exceedance under this article's rule.
- Watch the attempted break. A subsequent candle must trade strictly above the marked high or below the marked low. A touch alone does not qualify.
- Wait for the completed return close. For a bearish example, require a close below the prior high; for bullish, above the prior low. Equality is ambiguous and excluded here.
- Separate recognition from a trading decision. A valid shape can occur against a strong trend, in unusually wide spreads or during news. Price structure, fees and execution still matter.
Pivot indicators sometimes place a swing marker on an earlier bar even though that swing could only be confirmed several bars later. Reading the retroactive marker as a real-time signal introduces look-ahead bias. A reproducible analysis needs the timestamp when the swing became known, not merely where the marker appears afterward.
Bullish vs. Bearish Swing Failure Patterns
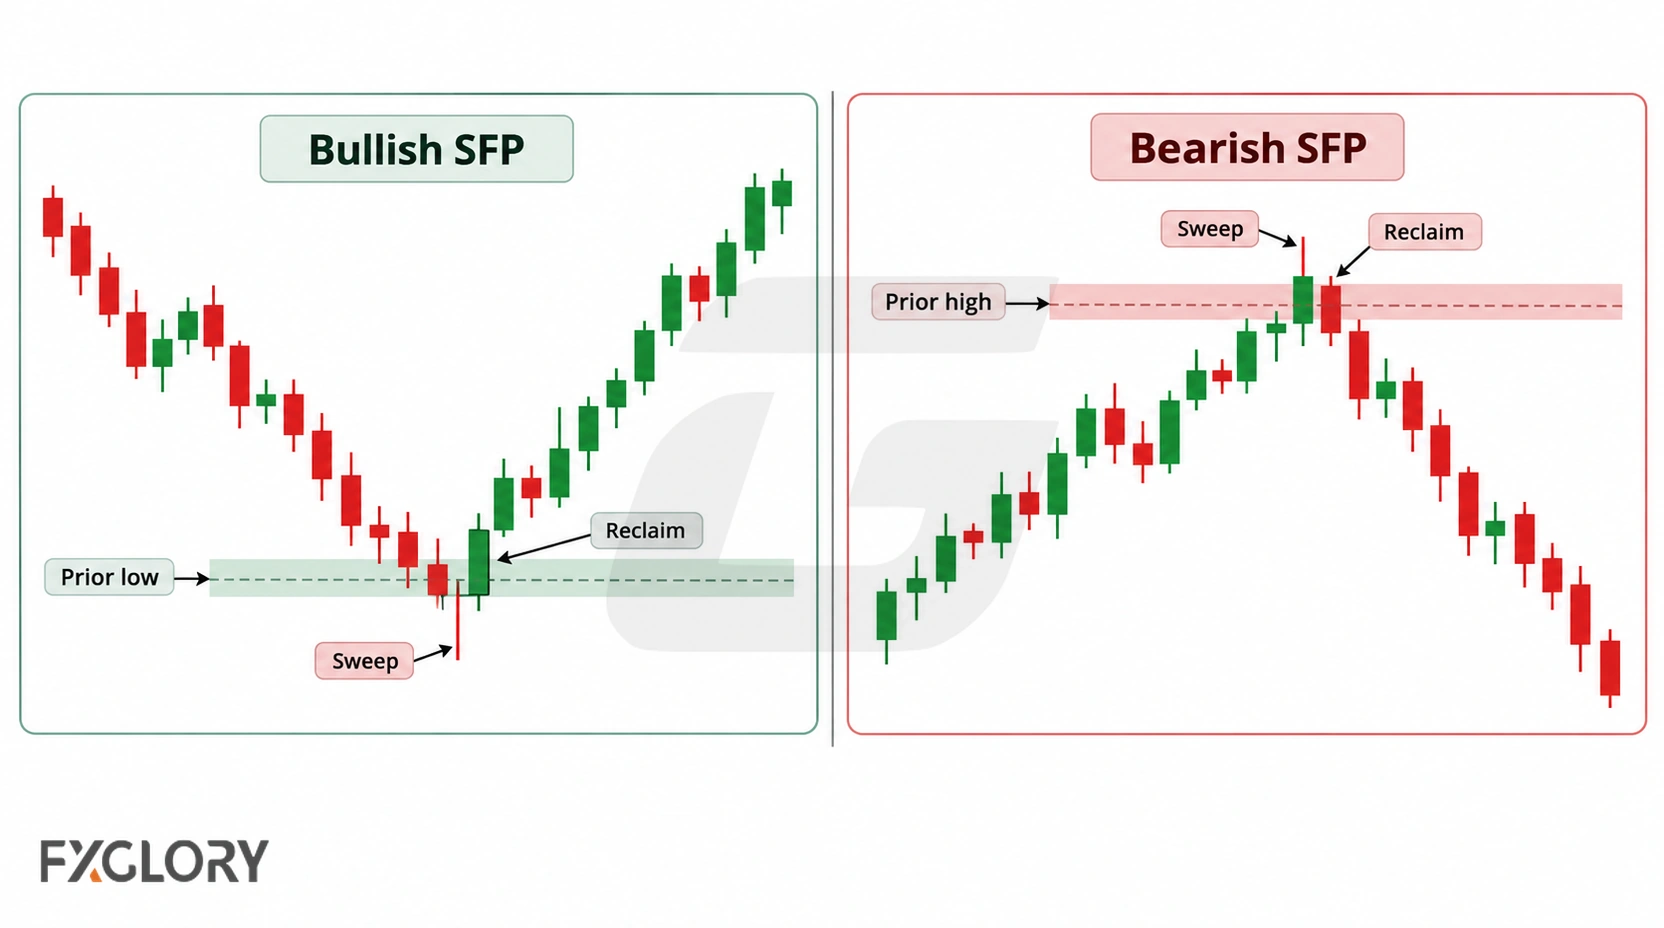
Bullish SFP: a failed break below a swing low
Imagine an earlier, already confirmed EUR/USD swing low at 1.0920. On a later candle, the low reaches 1.0913, but the candle closes at 1.0925. In this hypothetical chart, the low moved 7 pips beyond the reference level and the close returned 5 pips above it. That matches this guide's bullish SFP definition, but the next candle could still resume falling. A potential risk level would need to consider the lower wick, current spread and the actual prices used to close a long position.
Bearish SFP: a failed break above a swing high
Now consider a separate hypothetical setup with a previously confirmed swing high of 1.1050. A later candle reaches 1.1057 and closes at 1.1046. The high exceeded the reference by 7 pips, while the close finished 4 pips below it. That is a bearish SFP under the same rules; it is not proof that a downtrend will follow.
| Test | Bullish SFP | Bearish SFP |
|---|---|---|
| Previously marked swing | Low: 1.0920 | High: 1.1050 |
| Subsequent candle extreme | Low: 1.0913 | High: 1.1057 |
| Subsequent completed close | 1.0925, above prior low | 1.1046, below prior high |
| What would negate the initial idea? | Sustained trading and closing below the level | Sustained trading and closing above the level |
These prices illustrate the shape only. They are not a market signal, backtest, probability estimate or evidence of a historical trade. They also are not two stages of one continuous EUR/USD price series.
SFP vs. Liquidity Sweep and False Breakout
A liquidity sweep is commonly used for price trading through a level where orders may be concentrated. An SFP adds a specific observable outcome: the chosen candle closes back across a previously marked swing level. A sweep-like excursion that finishes beyond the level is not a same-candle SFP under our definition. Conversely, the SFP candle does not prove actual stop orders were filled; an ordinary spot-FX chart does not display a complete centralized order book for the entire market. See FXGlory's forex liquidity-pools lesson for the broader concept.
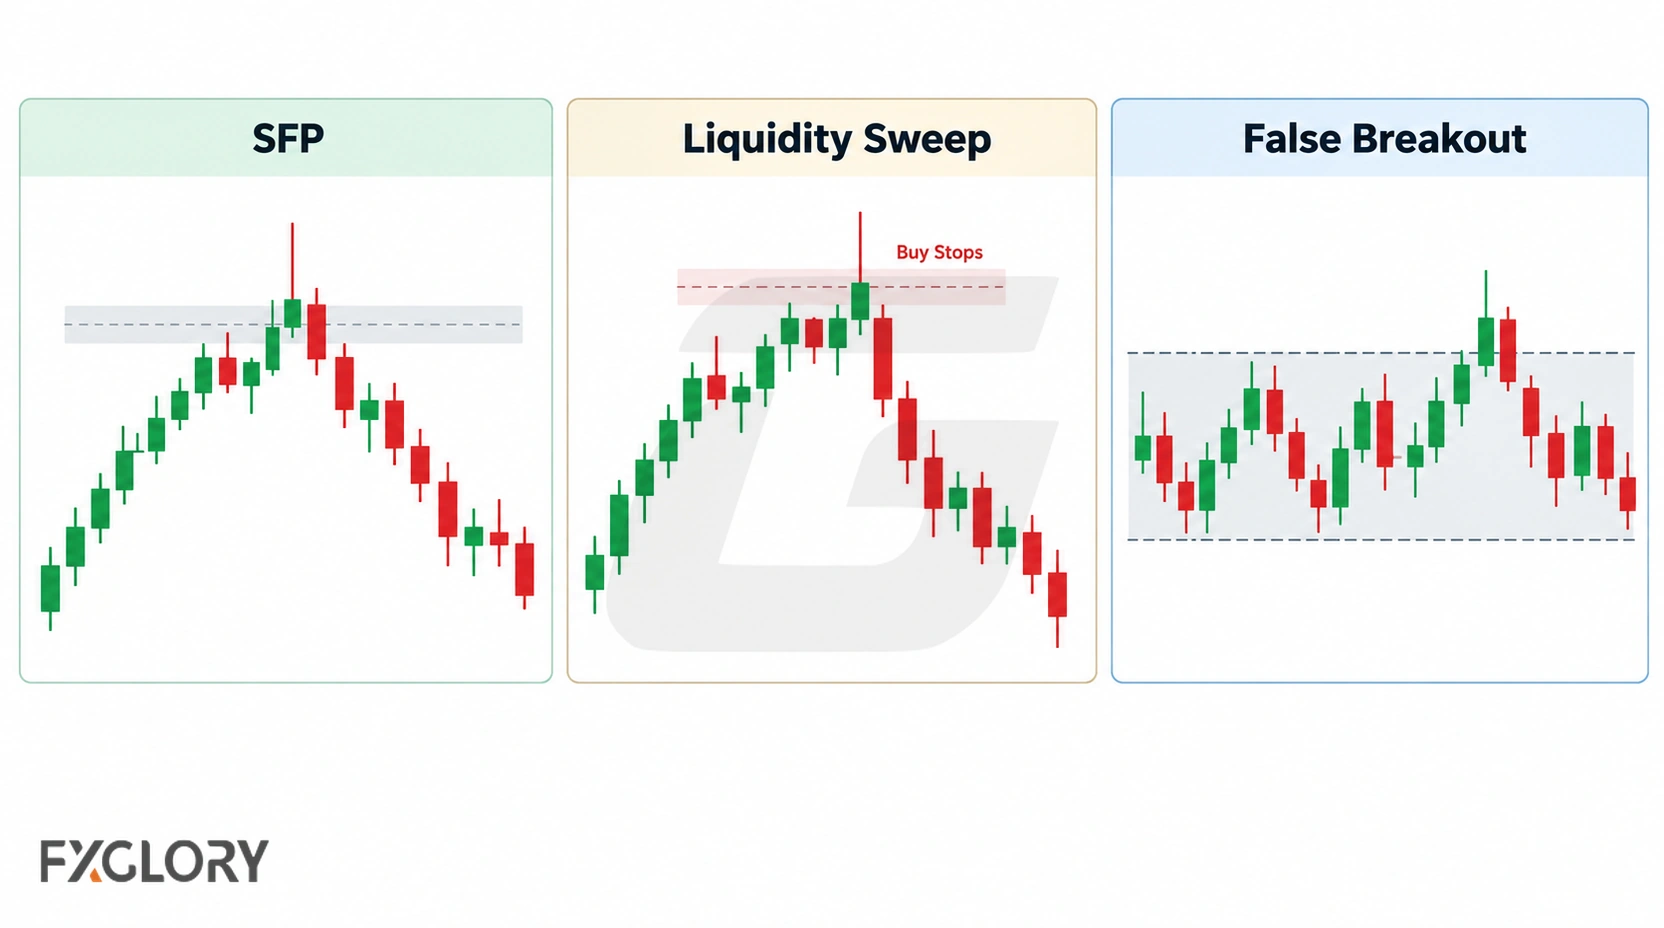
False breakout is a broader description of a move beyond a range, trendline or resistance/support area that later reverses. It need not use one specific prior swing or close within one candle. An SFP is a narrower way to define one potential failed break. A London breakout, by contrast, is typically framed around a session or time-defined range; a breakout of that range could succeed, fail or also form an SFP at a separately identified swing. Review the forex breakout strategy for the continuation side of that comparison.
Confirmation and an Illustrative SFP Trading Plan
An SFP is a pattern identification, not a complete strategy. An educational plan needs an explicit context, entry condition, invalidation, position size, exit and a rule for skipping unclear setups. The following checklist describes possible choices for testing, not a recommendation to enter a live trade.
- Context: Identify a prior swing before the test. Note nearby support/resistance, the prevailing trend, scheduled news and whether the swing sits at a meaningful boundary or in a congested middle of a range.
- Signal: Wait until the sweep candle closes back inside the marked swing. No completed reclaim means no same-candle SFP under this guide's definition.
- Entry model: Either evaluate an entry after that closing candle or separately require a later break of a defined minor swing in the expected direction. The delayed model can miss moves or enter at a less favorable price; it is an additional condition, not part of the basic SFP definition.
- Invalidation and stop: A hypothetical protective stop may be planned beyond the wick extreme, with a considered allowance for the relevant quote side, spread and execution uncertainty. A stop order does not cap every possible loss or guarantee its requested price.
- Target and size: Define a prospective exit near a prior structure level or a separately stated reward/risk objective. Calculate potential loss in the account currency from the assumed position size and expected fill prices; include fees when evaluating net results.
- Expiry and no-trade rule: Specify in advance how long a pending scenario stays valid. Skip it if the reference swing was identified only in hindsight, spreads widen sharply, the close remains beyond the swing, or the intended entry no longer fits the planned risk.
If more confirmation is required, record the exact extra trigger and re-evaluate the stop distance using the new assumed fill. Do not credit the strategy with an early close-price entry while demanding a later confirmation bar. More rules do not automatically improve outcomes; testing would be needed to assess any performance claim.
Worked EUR/USD Example: Pips, Stops and Planned Risk
Return to the hypothetical bearish SFP with the already identified 1.1050 high, a later high of 1.1057 and a completed close at 1.1046. Suppose a trader is evaluating a short position after the pattern. The following numbers are assumed execution fills purely for arithmetic. They do not represent FXGlory quotes, order availability or historical data.
| Assumption | Value | Price convention |
|---|---|---|
| Position size | Sell 1,000 EUR | Base-currency units, not broker lots |
| Entry fill | 1.1044 | Sell at assumed Bid |
| Stop-exit fill if reached | 1.1060 | Buy at assumed Ask |
| Target-exit fill if reached | 1.1012 | Buy at assumed Ask |
| Pip size for EUR/USD | 0.0001 USD/EUR | Standard quoted pip, not a point |
Step 1 — Pip value. For 1,000 EUR, each 0.0001 change in USD per EUR changes gross price-result by 1,000 EUR × 0.0001 USD/EUR = $0.10 per pip. The example assumes the USD account needs no currency conversion for EUR/USD profit or loss.
Step 2 — Planned downside at the stop-exit fill. The short sells at 1.1044 and would buy back at 1.1060: 1.1060 − 1.1044 = 0.0016 = 16 pips. The corresponding hypothetical gross loss is 16 × $0.10 = $1.60.
Step 3 — Potential upside at the target-exit fill. The short would buy back at 1.1012: 1.1044 − 1.1012 = 0.0032 = 32 pips, or 32 × $0.10 = $3.20 in hypothetical gross price-result. The planned gross reward-to-risk ratio is 32:16, or 2:1; that is a relation between two assumptions, not a forecast or the probability of either exit.
When Swing Failure Patterns Fail or Mislead
- Continued breakout: The same level can be reclaimed briefly before price pushes decisively beyond the wick. An SFP is not a trend-reversal guarantee.
- Unclear reference swing: Crowded highs/lows, equal levels or a hindsight-labelled pivot can make a pattern appear clearer in a backtest than it was in real time.
- Different FX feeds: OTC forex is decentralized. Chart prices, candle highs and lows, and available volume or order-book views can differ by provider. One feed's apparent wick may not match another's.
- News, thin liquidity and spread changes: Wider spreads and gaps can alter apparent signal quality, stop triggering and the eventual exit price.
- Timeframe mismatch: A confirmed five-minute rejection inside an unfinished hourly candle is not yet a confirmed hourly SFP.
- Indicator and rule overfitting: Selecting a favorable lookback, wick filter or reward/risk ratio after seeing results is not an independent validation. Performance claims need reproducible testing including costs.
An order-flow tool may show only one venue or a broker-specific view, not all orders in spot FX. That limitation matters before explaining a wick as a deliberate institutional stop hunt. FXGlory's order-flow forex trading lesson provides further context.
Quick SFP Identification Checklist
- Did I choose a timeframe and identify a swing that was already confirmed before the signal candle?
- Is the reference level fixed, with rules for equal highs or lows?
- Did a later candle trade strictly beyond that high or low?
- Did the completed candle close back on the original side on the chosen timeframe?
- Have I separated the chart pattern from any optional, later confirmation and entry condition?
- Can I state an invalidation, quote-side assumptions, costs and realistic execution uncertainty?
- If the level or price feed is ambiguous, would I skip rather than retrospectively relabel the setup?
Bottom line: A swing failure pattern turns a possible failed break into a testable chart definition: a known swing, a price excursion past it and a close back inside. Its usefulness depends on context and rules, not on a guaranteed outcome. To build broader decision criteria without treating a pattern as a stand-alone signal, continue with FXGlory's forex price-action strategies lesson.