
The D1 structure remains bearish, but mixed momentum and bullish H4 conditions leave the weekly outlook exposed to consolidation and countertrend pressure.
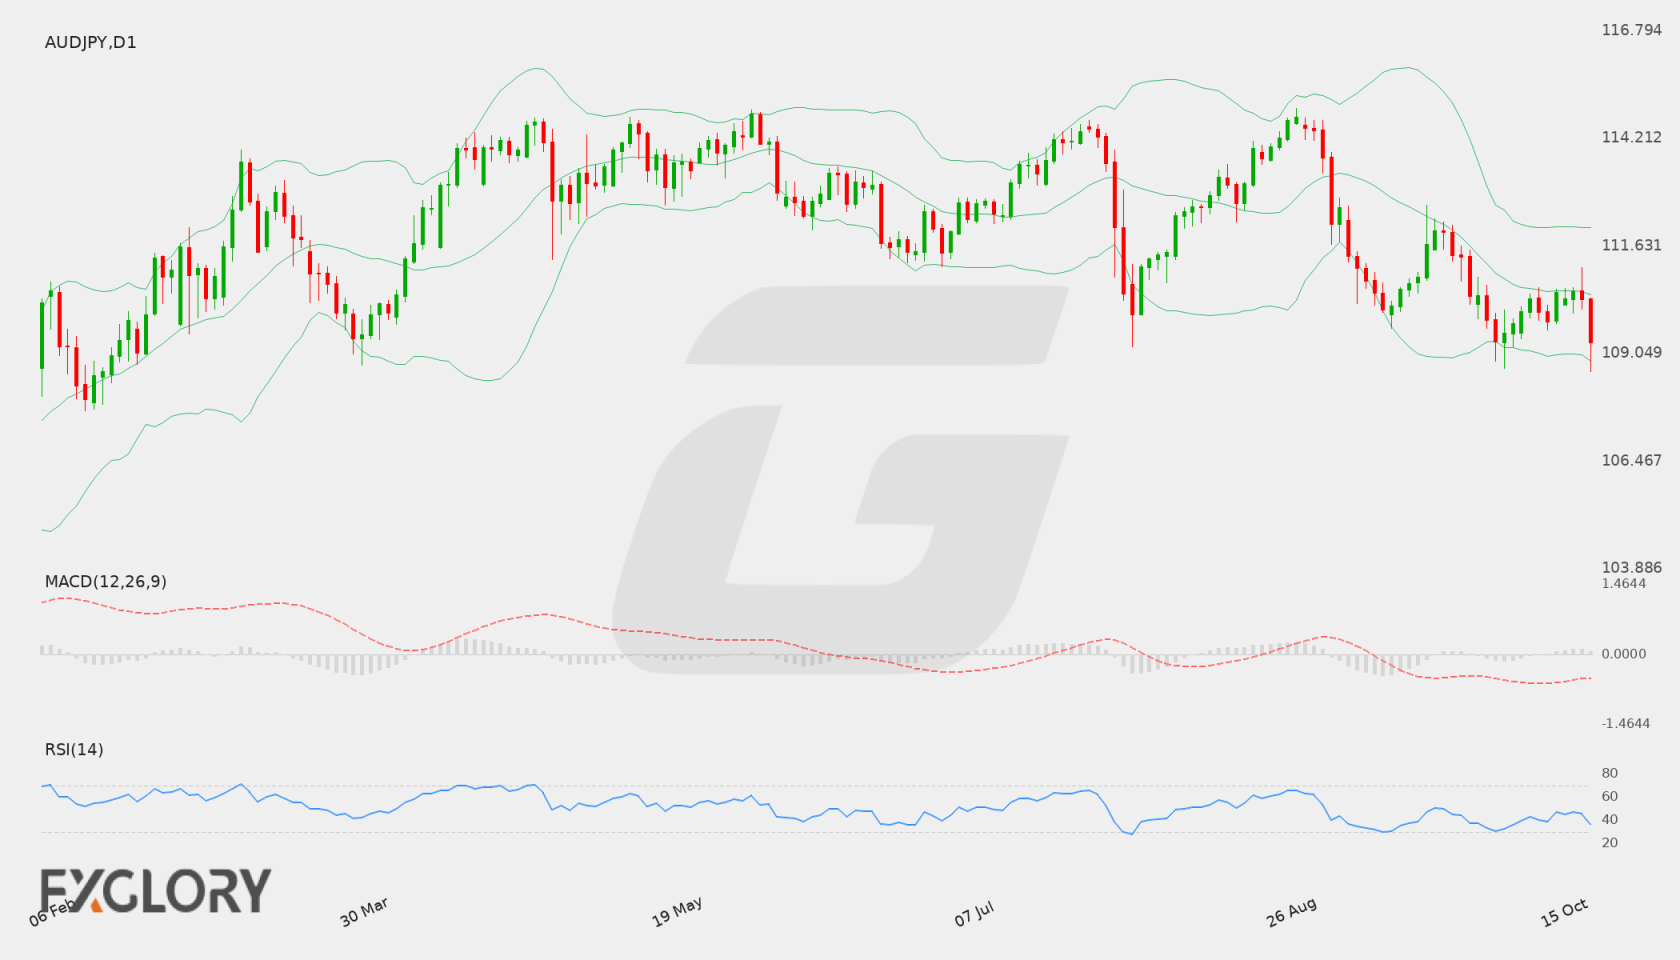
AUD/JPY Weekly Forecast at a Glance
In brief
AUD/JPY has a bearish weekly bias as D1 structure remains weak, although bullish H4 momentum and mixed D1 signals leave room for consolidation or countertrend strength.
The weekly thesis is governed by the bearish D1 trend, with the reference close at 110.521 below the D1 EMA20 at 110.59703, EMA50 at 111.4479 and SMA200 at 111.54049. The falling EMA50 slope reinforces the softer structural backdrop, while the mixed close sequence prevents the bearish case from being treated as one-directional.
Momentum is mixed rather than uniformly negative: the D1 MACD remains below its signal line, but its histogram is positive, while H4 momentum is bullish and H4 price is above its short moving averages. That tactical strength can support consolidation or a recovery toward the resistance framework, but the D1 trend remains the controlling weekly reference unless price reaches the formal upper boundary.
- Bullish targets
-
- T1111.974
- T2112.597
- Bearish targets
-
- T1109.212
- T2108.763
- Invalidation
- One completed D1 close above 111.79108.
| Price at last update | 110.149 as of 23 Oct 2026 20:25 GMT+3 |
|---|---|
| Completed D1 reference close | 110.521 as of 9 October 2026 |
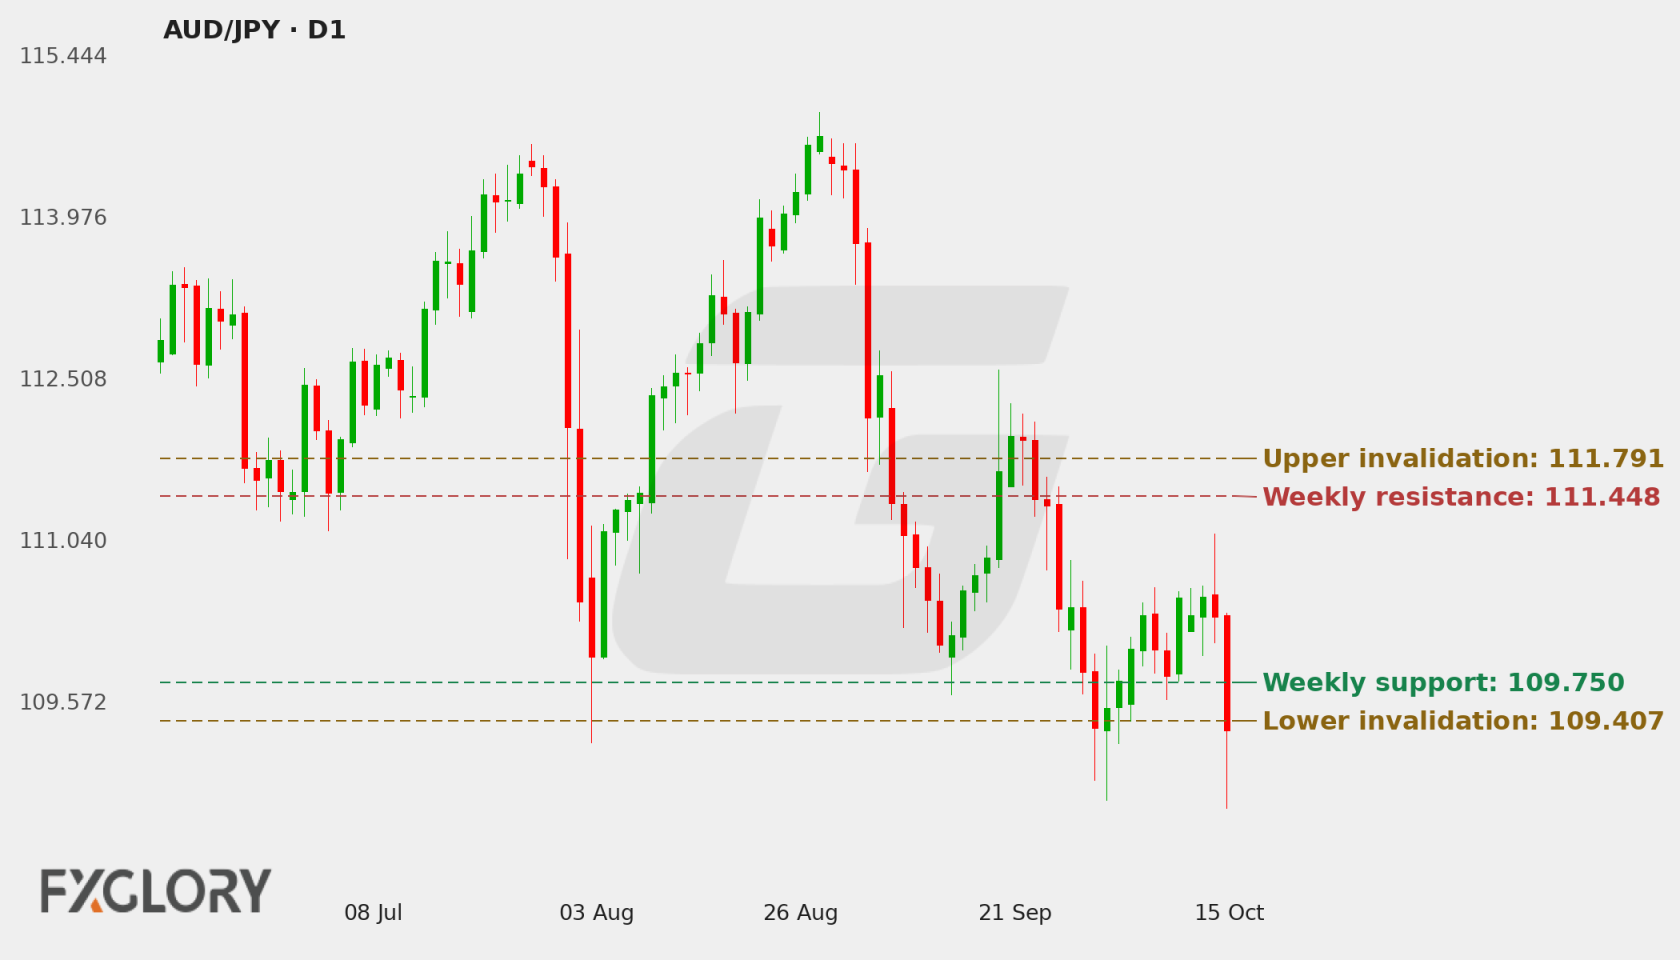
| Primary support | 109.750 |
| Secondary support | 109.212 |
| Primary resistance | 111.448 |
| Bullish targets | 111.974, 112.597 |
| Bearish targets | 109.212, 108.763 |
| Formal weekly thesis invalidation | Upper 111.791 — One completed D1 close above 111.791 formally invalidates the bearish weekly thesis. |
Live AUD/JPY Tools
A forecast is a snapshot. These pages keep moving with the market.
- Live
Live chart & price
Watch AUD/JPY move tick by tick. Flip from the 1-minute chart to the monthly, with trading conditions right alongside.
- Live
Technical signals
Buy, sell or sit it out? Oscillators, moving averages and pivot points boiled down to one clear reading, updated live.
Economic calendar
Know what's coming before it hits the price: every scheduled release with impact, forecast and actual.
Historical data
Open, high, low and close on any timeframe from 1 minute to monthly. Test your idea, then download the data.
All AUD/JPY forecasts
Every weekly outlook in one place. Scroll back to see how earlier calls played out against the chart.
AUD/JPY Fundamental Drivers This Week
No scheduled events were provided for this forecast, so the weekly assessment is driven by the D1 structure, momentum, H4 tactical condition and supplied levels.
| Driver | Evidence | Forecast relevance |
|---|---|---|
| Scheduled-event availability | No events were supplied for the forecast period. | There is no listed event catalyst to add a separate timing or repricing consideration to the technical framework. |
Current AUD/JPY Price and Weekly Market Context
AUD/JPY is positioned between the primary support at 109.75 and primary resistance at 111.4479, with the D1 trend bearish but the H4 tactical state bullish. The reference D1 close at 110.521 sits below the D1 EMA20, EMA50 and SMA200, while H4 price action is supported by bullish H4 momentum and moving-average positioning. This creates a bearish weekly structure with a meaningful short-term countertrend component.
- D1 trendbearishClose vs 50 EMA and 200 SMA
- H4 tacticalbullishH4 close vs 20 and 50 EMA
- MomentummixedRSI and MACD histogram
- VolatilitystableD1 ATR change
Is AUD/JPY Bullish or Bearish This Week?
The bearish scenario has the strongest structural support because D1 trend and moving-average evidence remain weak. The base scenario is consolidation between the supplied weekly levels, reflecting mixed D1 price action and bullish H4 momentum. A bullish alternative would require stronger D1 confirmation above the formal upper boundary; without that development, H4 strength remains tactical rather than a replacement for the D1 thesis.
Scenario 1 of 3Bullish reversal
- D1 confirmation
- A bullish weekly shift would require one completed D1 close above 111.79108, which would move price beyond the formal upper boundary of the bearish framework.
- H4 tactical signal
- H4 bullish follow-through above its supplied resistance at 110.535 would strengthen the countertrend case and keep the 111.4479 and 111.974 resistance references in focus.
- Targets
- 111.974, 112.597
- Scenario failure condition
- The bullish alternative would lose force if H4 strength fades and D1 price remains below the resistance framework, particularly if the market returns toward 109.75.
Scenario 2 of 3Base / neutral
- D1 confirmation
- A mixed D1 close sequence with price remaining between 109.75 and 111.4479 would support a consolidation interpretation rather than a decisive directional resolution.
- H4 tactical signal
- The base case is supported if bullish H4 momentum persists without producing the completed D1 close required above 111.79108.
- Targets
- The neutral path is a two-sided interaction with the supplied range bounded by 109.75 support and 111.4479 resistance, with 111.974 as the next resistance reference if the upper side is tested.
- Scenario failure condition
- The consolidation case would weaken if a completed D1 close establishes a clear move beyond either the formal upper boundary at 111.79108 or the formal lower boundary at 109.40682.
Scenario 3 of 3Bearish continuation
- D1 confirmation
- A completed D1 close below primary support at 109.75 would strengthen the bearish structural reading and place the lower references at 109.212 and 108.763 into focus.
- H4 tactical signal
- H4 loss of its tactical support at 110.508 would reduce the current countertrend support and make the D1-led downside case more immediate, subject to D1 confirmation.
- Targets
- 109.212, 108.763
- Scenario failure condition
- The bearish scenario would be materially weakened by a completed D1 close above 111.79108, especially if H4 bullish momentum continues to support the move.
AUD/JPY D1 Outlook and H4 Technical Triggers
The daily timeframe controls the weekly thesis. H4 evidence is used only for earlier confirmation, tactical warning and scenario-failure context. Complete live H4, H1 and intraday readings remain on the Technical page.
D1 Price Action and Market Structure
The D1 close sequence is mixed, so the bearish trend is not expressed through a uniformly directional sequence. The reference close at 110.521 is below the EMA20 at 110.59703, EMA50 at 111.4479 and SMA200 at 111.54049, while the falling EMA50 slope supports the broader weak structure. The rising SMA200 slope is a conflicting longer-term input and limits the strength of the bearish interpretation.
H4 Tactical Triggers
H4 is bullish and provides the clearest countertrend evidence to the D1 thesis. Its reference close at 110.519 is above the EMA20 at 110.25799 and EMA50 at 110.2052, with H4 MACD and histogram both positive. H4 price is also above its middle Bollinger reference at 110.16895, but the timeframe remains tactical: this strength can delay or complicate D1 weakness without independently redefining the weekly trend.
Technical Indicators at a Glance
Automated technical summary
The technical picture is structurally bearish on D1 but tactically bullish on H4. D1 price is below its EMA20, EMA50 and SMA200, while H4 price is above its short moving averages. D1 MACD remains below its signal line, but its positive histogram and the bullish H4 MACD produce mixed momentum. Stable volatility indicates a comparatively consistent movement environment rather than a directional signal.
Selected snapshot: D1 with H4 tactical context. Updated 16 October 2026.
- RSI46.57Neutral
- MACDAbove signalBullish
- Bollinger Bands49% of bandLower half
- Moving averagesBelow bothBearish
- ATR85.8 pipsStable
RSI (14)
Neutral
H4 61.01
RSI readings reinforce the timeframe split rather than provide a unified directional signal. D1 RSI at 46.57 is below the midpoint, consistent with restrained momentum within the bearish structure, while H4 RSI at 61.01 shows stronger tactical momentum in the opposite direction.
- D1 RSI
- 46.57
- H4 RSI
- 61.01
MACD (12, 26, 9)
Bullish momentum
D1 MACD remains below its signal line, which supports the weaker D1 backdrop, but the positive D1 histogram indicates that downside momentum is not accelerating uniformly. H4 MACD is above its signal line with a positive histogram, confirming the short-term countertrend pressure.
- MACD
- -0.536687
- Signal
- -0.592412
- Histogram
- 0.055725
Bollinger Bands (20, 2σ)
Lower half
Striped ends = price outside the bands.
The D1 reference close at 110.521 is near the D1 Bollinger middle value of 110.5493 and below the upper value of 112.08131, while H4 price at 110.519 is above the H4 middle value of 110.16895 and below the upper value of 110.67901. This supports a mixed structure with room for tactical movement but no standalone directional conclusion from volatility bands.
- Position in band
- 49%
- Band width
- 306.4 pips (2.77%)
Moving averages (D1)
Bearish structure
- 50 EMA falling111.448Price is 92.7 pips below (-0.83%)
- 200 SMA rising111.540Price is 101.9 pips below (-0.91%)
Moving averages provide the strongest structural support for the bearish D1 thesis: the reference close is below the EMA20, EMA50 and SMA200, and the EMA50 slope is falling. The rising SMA200 slope is a counterweight, while H4 price above both H4 short moving averages explains the tactical bullish condition.
- D1 close
- 110.521
- 50 EMA
- 111.448
- 200 SMA
- 111.540
ATR (14)
Stable volatility
One ATR either side of the latest close. A measure of move size, not a price target.
Stable volatility suggests that the weekly environment is not being characterized by a supplied volatility expansion or contraction signal. ATR therefore informs the movement context rather than choosing direction; the structural decision remains dependent on D1 price action around the supplied levels.
- D1 ATR
- 0.85795 (0.78%)
- H4 ATR
- 0.28283 (0.26%)
Technical conclusion: The main thesis remains D1-led bearishness, supported by the close below the D1 moving averages, falling EMA50 slope and D1 MACD remaining below its signal. The strongest counterargument is the bullish H4 configuration, reinforced by H4 RSI at 61.01 and positive H4 MACD structure. Primary support at 109.75 and primary resistance at 111.4479 frame the immediate weekly contest, while 111.79108 is the formal upper boundary for the bearish view.
View all live AUD/JPY oscillators, moving averages, pivot points and timeframe signals.
AUD/JPY Weekly Support, Resistance and Invalidation
| Level | Role | Timeframe | Why it matters |
|---|---|---|---|
| 109.75 | Primary support | D1 | A completed D1 close below this level would strengthen the bearish structure and bring the lower reference levels into focus. |
| 109.212 | Secondary support and bearish reference target | D1 | It is the next supplied downside level below primary support and one of the permitted bearish reference targets. |
| 111.4479 | Primary resistance | D1 | It is both a supplied resistance level and the D1 EMA50 value, making it an important barrier for any countertrend recovery. |
| 111.974 | Secondary resistance and bullish reference target | D1 | It is the next supplied upside reference beyond primary resistance and a permitted bullish reference target. |
| 110.508 | H4 support | H4 | This tactical level is close to the H4 reference close and helps assess whether current short-term bullish pressure is being retained. |
| 110.535 | H4 resistance | H4 | H4 follow-through above this supplied level would strengthen the tactical countertrend case, while D1 remains controlling. |
These are forecast-specific market-structure levels. Formula-based Classic, Fibonacci and Camarilla pivots remain on the Technical page.
Economic News & Events to Watch for AUD/JPY This Week
No scheduled events available for this period.
Calendar source: FXGlory economic calendar. Retrieved 12 Oct 2026 16:11 GMT+3. View the complete AUD/JPY economic calendar.
AUD/JPY Outlook for 12–17 October 2026
AUD/JPY enters the forecast period with a bearish D1 framework but a bullish H4 tactical condition. The D1 close below its EMA20, EMA50 and SMA200, together with the falling EMA50 slope, outweighs the shorter-term H4 strength for the weekly classification, although the mixed close sequence and momentum prevent a one-sided reading.
The key distinction is whether tactical H4 strength develops into a completed D1 move above the formal upper boundary at 111.79108, or whether price instead loses primary support at 109.75 and exposes the supplied bearish references at 109.212 and 108.763. With no scheduled events supplied, level interaction and timeframe alignment remain the main analytical tests.
Weekly Forecast Risks and What Would Change the Outlook
- Timeframe disagreement: D1 is bearish while H4 is bullish, so short-term strength can delay or complicate the weekly structural signal.
- Mixed momentum: D1 MACD remains below its signal line but the D1 histogram is positive, leaving the pace and immediacy of bearish continuation uncertain.
- Mixed D1 close sequence: The close sequence does not provide uniform directional confirmation, reducing the clarity of the structural trend.
- Longer-term moving-average conflict: The EMA50 slope is falling while the SMA200 slope is rising, creating different signals across the supplied D1 trend references.
- No scheduled events supplied: The absence of listed events means there is no event timetable available to frame potential repricing or volatility timing.
Formal weekly invalidation: The bearish weekly thesis is formally invalidated by one completed D1 close above 111.79108. One completed D1 close below 109.40682 confirms lower structural extension and continuation.
AUD/JPY Weekly Forecast FAQs
Is AUD/JPY bullish or bearish this week?
The weekly bias is Bearish because the D1 trend and moving-average structure remain weak, despite bullish H4 conditions and mixed momentum.
What scenario would strengthen for AUD/JPY this week?
The primary scenario is continued D1-led weakness, but a two-sided consolidation scenario remains credible while H4 momentum is bullish and the D1 close sequence is mixed.
What are the key AUD/JPY support and resistance levels?
The key weekly levels are 109.75 and 109.212 on the support side, with 111.4479 and 111.974 as resistance. The permitted bearish reference targets are 109.212 and 108.763.
What would invalidate this AUD/JPY forecast?
The bearish weekly thesis is formally invalidated by one completed D1 close above 111.79108.
Methodology, Data and Sources
- Price-data source: FXGlory price feed (AUDJPY)
- Live quote timestamp: 23 Oct 2026 20:25 GMT+3
- Weekly analysis timestamp: 12 October 2026
- Chart timestamp: 16 October 2026 (redrawn daily)
- Daily check: Every day at 04:00 GMT+3: the latest completed D1 close is checked against the invalidation levels and the chart is redrawn.
- Technical snapshot timestamp: 12 October 2026
- Calendar-data source: FXGlory economic calendar
- Calendar retrieval timestamp: 12 Oct 2026 16:11 GMT+3
- Candle convention: FXGlory D1 and H4 candles; D1 candle dates are evaluated in UTC and invalidation uses completed D1 closes only.
- Indicator settings: D1 RSI(14), MACD(12,26,9), Bollinger Bands(20,2), EMA(50), SMA(200), ATR(14); H4 RSI/MACD/Bollinger/EMA/ATR.
- Level-selection method: Weekly D1 support/resistance levels are structural market levels. Formal invalidation uses a hard 0.75× D1 ATR(14) minimum anchor distance plus a 0.40× D1 ATR(14) outward buffer; H4 levels are tactical only.
- Weekly forecast method: D1 controls the weekly thesis; H4 supplies tactical confirmation/warning only.