

The D1 trend and positive momentum support a bullish weekly bias, while mixed closes and neutral H4 conditions leave the near-term path unresolved.
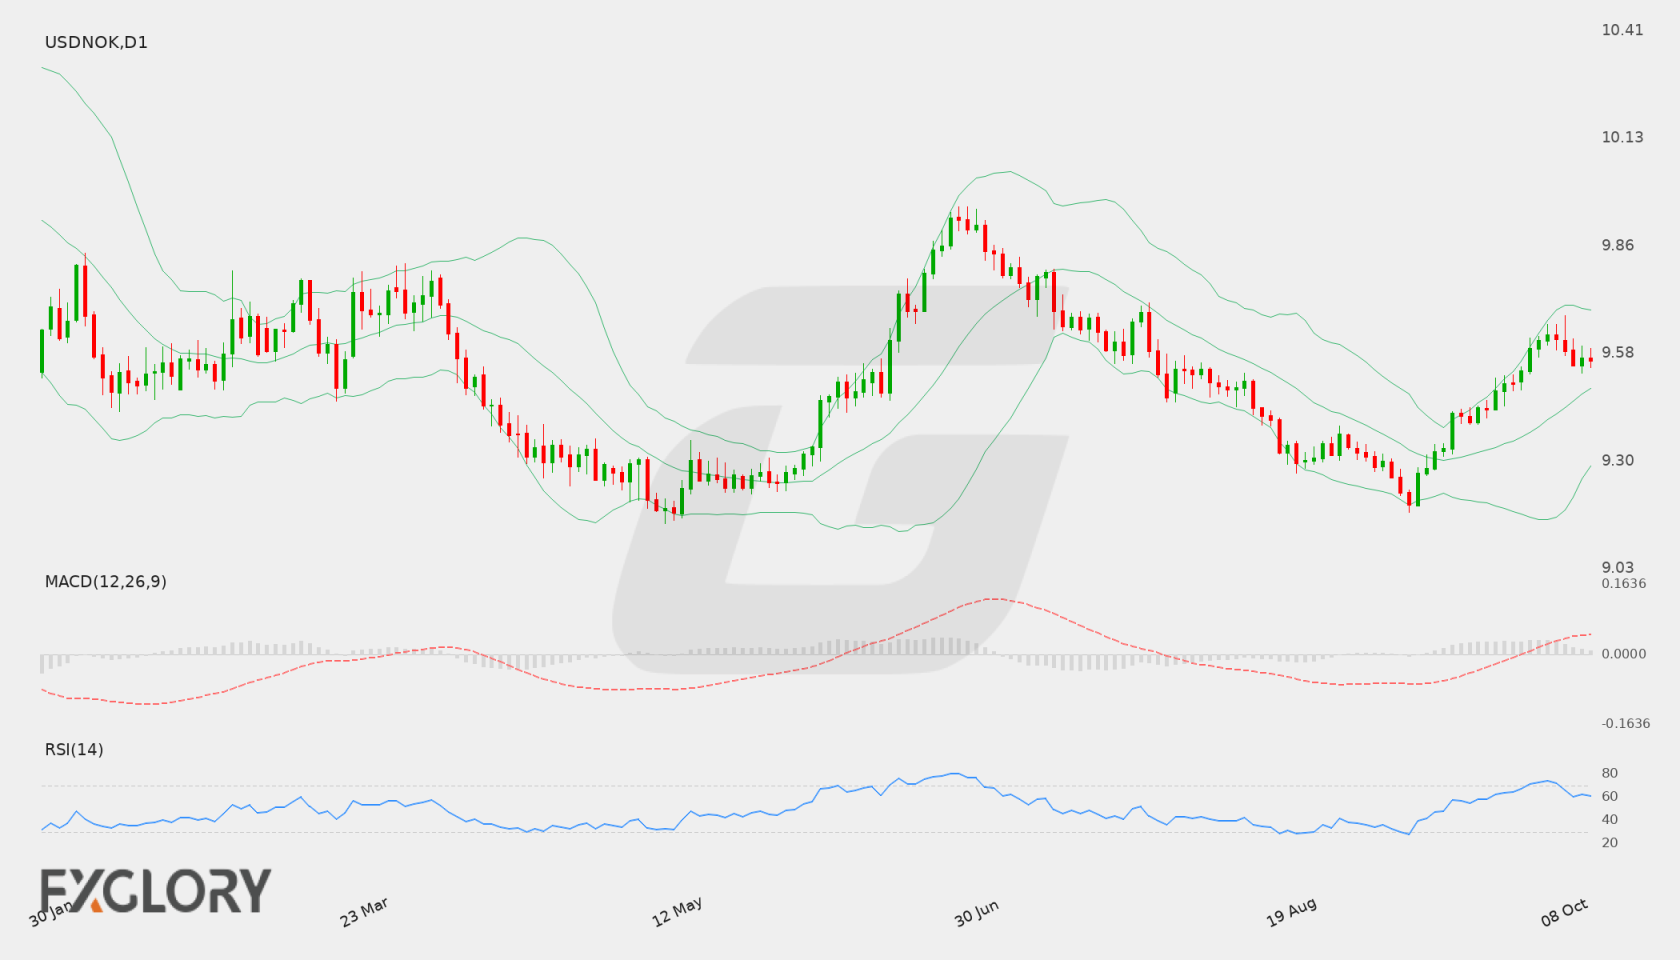
USD/NOK Weekly Forecast at a Glance
In brief
The weekly bias is bullish on the D1 trend and positive momentum, but mixed closes and neutral H4 conditions leave confirmation incomplete.
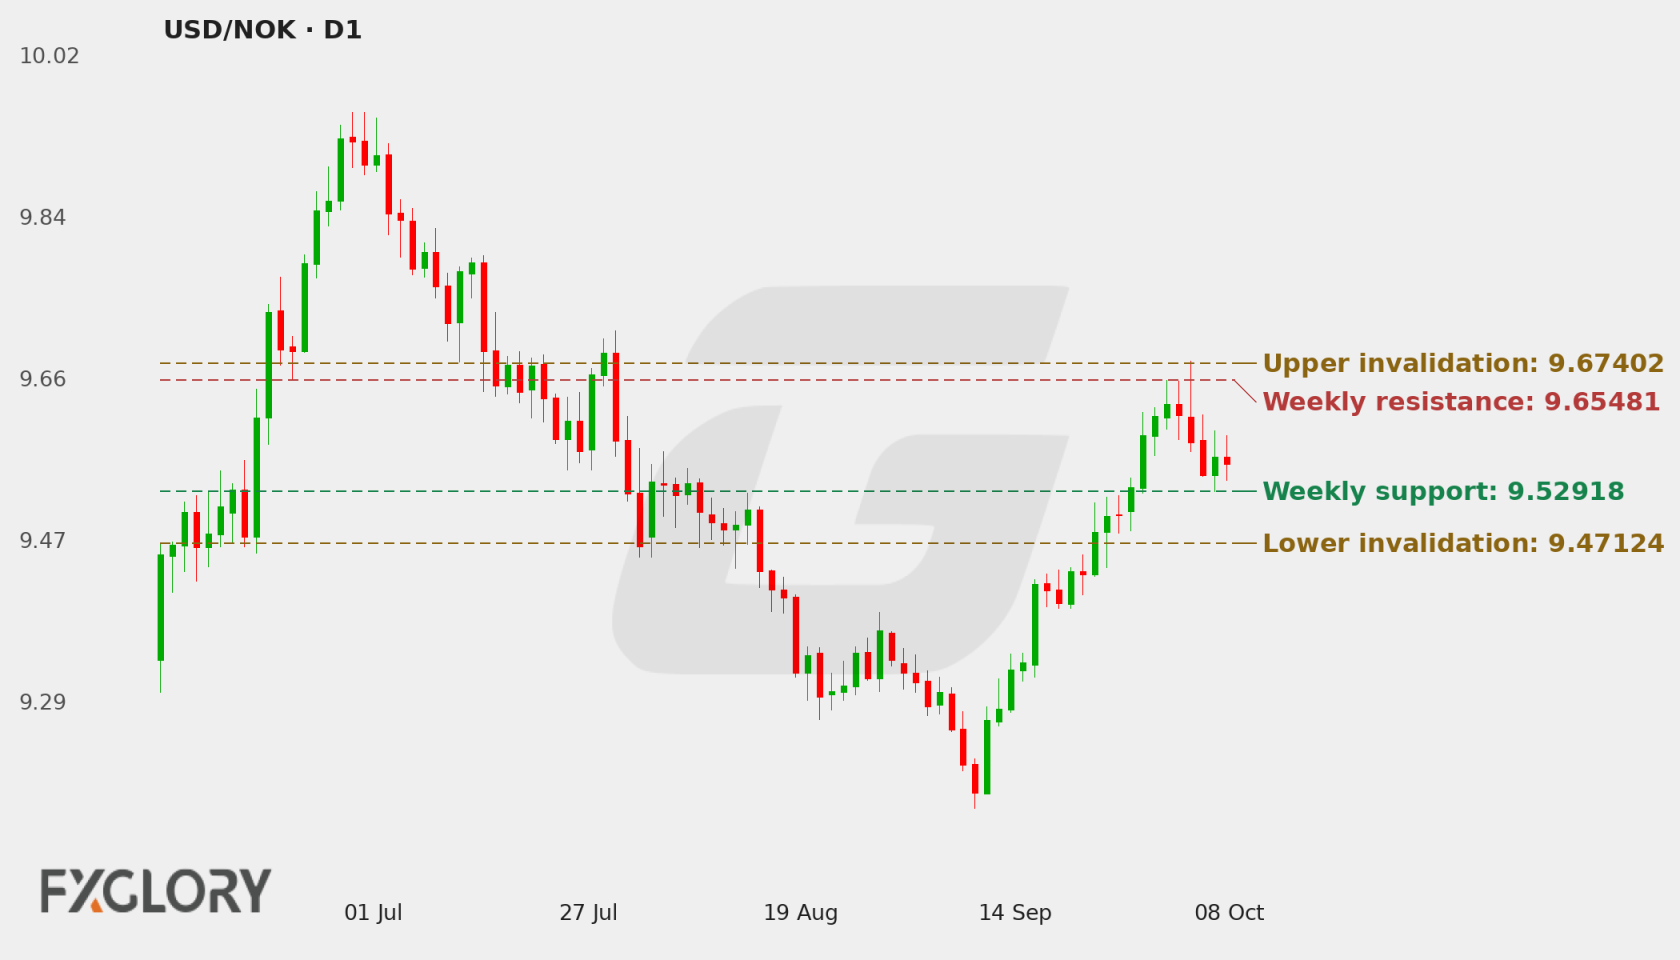
USD/NOK closed at 9.5612, above the selected primary support at 9.52918 and below primary resistance at 9.65481. The D1 trend is bullish and momentum is positive, with price above the EMA20, EMA50 and SMA200. However, the mixed close sequence and falling SMA200 slope temper the structural picture rather than establishing uninterrupted follow-through.
H4 is neutral: its RSI is below 50, MACD remains negative despite a slightly positive histogram, and the close is near its middle Bollinger band and below its EMA20. This is tactical hesitation, not a reversal of the D1 thesis. Stable volatility describes the current trading environment without resolving direction; the scheduled Treasury Currency Report may add event risk, but no outcome is supplied.
| Price at last update | 9.55263 as of 10 Oct 2026 02:50 GMT+3 |
|---|---|
| Completed D1 reference close | 9.56120 as of 8 October 2026 |
| Primary support | 9.52918 |
| Secondary support | 9.49045 |
| Primary resistance | 9.65481 |
| Bullish targets | 9.68768, 9.77153 |
| Bearish targets | 9.49045, 9.45509 |
| Formal weekly thesis invalidation | Lower 9.47124 — One completed D1 close below 9.47124 formally invalidates the bullish weekly thesis. |
Live USD/NOK Tools
A forecast is a snapshot. These pages keep moving with the market.
- Live
Live chart & price
Watch USD/NOK move tick by tick. Flip from the 1-minute chart to the monthly, with trading conditions right alongside.
- Live
Technical signals
Buy, sell or sit it out? Oscillators, moving averages and pivot points boiled down to one clear reading, updated live.
Economic calendar
Know what's coming before it hits the price: every scheduled release with impact, forecast and actual.
Historical data
Open, high, low and close on any timeframe from 1 minute to monthly. Test your idea, then download the data.
All USD/NOK forecasts
Every weekly outlook in one place. Scroll back to see how earlier calls played out against the chart.
USD/NOK Fundamental Drivers This Week
Scheduled economic events relevant to USD/NOK during 11–17 October 2026 include Treasury Currency Report. Directional impact depends on the released data relative to supplied expectations.
Scroll table sideways for more columns →
| Event | Scheduled | Importance |
|---|---|---|
| Treasury Currency Report | 16 Oct 2026 03:00 GMT+3 | Medium |
Current USD/NOK Price and Weekly Market Context
The D1 framework leads the weekly view: its trend state is bullish, the close is above the EMA20, EMA50 and SMA200, and momentum is positive. The mixed close sequence and falling SMA200 slope are counterweights, so the trend is constructive but not uniformly confirmed by recent price action. H4 is neutral rather than affirming the D1 direction, with its close below EMA20 and RSI under 50; this complicates timing without displacing the higher-timeframe thesis. Stable volatility offers no directional signal, while the scheduled USD-related report adds a potential catalyst.
- D1 trendbullishClose vs 50 EMA and 200 SMA
- H4 tacticalneutralH4 close vs 20 and 50 EMA
- MomentumpositiveRSI and MACD histogram
- VolatilitystableD1 ATR change
Is USD/NOK Bullish or Bearish This Week?
The primary scenario is conditional bullish continuation, supported by the D1 trend and positive momentum, with 9.65481 as the first listed resistance and 9.68768 and 9.77153 as permitted bullish targets. Mixed closes, a falling SMA200 slope and neutral H4 conditions leave room for consolidation. A deterioration through 9.52918 and then 9.49045 would strengthen the bearish alternative, whose listed targets are 9.49045 and 9.45509; the formal bullish boundary remains separate at 9.47124.
Scenario 1 of 3Bullish continuation
- D1 confirmation
- A completed D1 close above 9.65481 would provide structural evidence that price is extending beyond the selected primary resistance; the bullish case would remain conditional against the formal upper boundary at 9.67402.
- H4 tactical signal
- H4 would offer better tactical support if its close moved above the supplied H4 resistance at 9.5906 and its neutral momentum readings improved. This would support, but not replace, D1 evidence.
- Targets
- 9.68768, 9.77153
- Scenario failure condition
- Repeated inability to progress beyond 9.65481, alongside continued mixed D1 closes and neutral H4 conditions, would materially weaken the continuation case; a move back below 9.52918 would add pressure to it.
Scenario 2 of 3Base / neutral
- D1 confirmation
- A D1 close sequence that remains mixed while price holds between the selected support at 9.52918 and resistance at 9.65481 would fit a consolidation reading rather than directional resolution.
- H4 tactical signal
- H4 remaining neutral, with price around its middle Bollinger band and below EMA20, would be consistent with two-sided tactical trade rather than clear D1 confirmation.
- Targets
- The base case is consolidation between 9.52918 support and 9.65481 resistance, with 9.49045 and 9.68768 as the next selected levels if price leaves that range.
- Scenario failure condition
- A completed D1 close beyond the range, accompanied by a clearer directional close sequence and matching H4 behavior, would weaken the consolidation interpretation.
Scenario 3 of 3Bearish reversal
- D1 confirmation
- A completed D1 close below 9.52918, followed by pressure toward 9.49045, would weaken the bullish structure and make the bearish alternative more relevant; the supplied bearish targets are 9.49045 and 9.45509.
- H4 tactical signal
- H4 weakness through its supplied support at 9.55396, together with persistently negative MACD and RSI below 50, would add tactical support to a bearish reading, while D1 remains controlling.
- Targets
- 9.49045, 9.45509
- Scenario failure condition
- A recovery above 9.65481 with improving D1 closes would weaken the bearish alternative; movement beyond that resistance would need to be assessed against the supplied formal upper boundary at 9.67402.
USD/NOK D1 Outlook and H4 Technical Triggers
The daily timeframe controls the weekly thesis. H4 evidence is used only for earlier confirmation, tactical warning and scenario-failure context. Complete live H4, H1 and intraday readings remain on the Technical page.
D1 Price Action and Market Structure
The D1 close at 9.5612 sits above primary support at 9.52918 and below primary resistance at 9.65481. It is also above the EMA20 at 9.50743, EMA50 at 9.47512 and SMA200 at 9.55145, consistent with the bullish trend state. Positive MACD histogram and RSI above 50 support momentum, while mixed closes and a falling SMA200 slope temper confidence in follow-through.
H4 Tactical Triggers
H4 closed at 9.56609, below its EMA20 at 9.57035 and just above its EMA50 at 9.56599, with the RSI at 47.94 and MACD still negative. The positive histogram suggests the negative MACD reading has eased, but the combination remains neutral rather than a clear tactical confirmation. The supplied H4 support at 9.55396 and resistance at 9.5906 frame the nearer decision area; D1 remains the basis of the weekly view.
Technical Indicators at a Glance
Automated technical summary
The automated states combine a bullish D1 trend and positive momentum with neutral H4 conditions and stable volatility. D1 price is above its listed moving averages, but the mixed close sequence and falling SMA200 slope are meaningful qualifications. H4 momentum is less supportive, limiting evidence of immediate alignment across timeframes.
Selected snapshot: D1 with H4 tactical context. Updated 11 October 2026.
- RSI60.49Neutral
- MACDAbove signalBullish
- Bollinger Bands68% of bandUpper half
- Moving averagesAbove bothBullish
- ATR640.3 pipsStable
RSI (14)
Neutral
H4 47.94
D1 RSI above 50 is consistent with positive momentum, while H4 RSI below 50 shows weaker tactical participation. The difference supports the D1-led bullish thesis but argues against treating H4 as confirmation.
- D1 RSI
- 60.49
- H4 RSI
- 47.94
MACD (12, 26, 9)
Bullish momentum
D1 MACD is above its signal line with a positive histogram, aligning with the D1 trend. H4 MACD and signal remain negative, although its histogram is slightly positive; that easing does not yet amount to clear tactical alignment.
- MACD
- 0.053636
- Signal
- 0.046147
- Histogram
- 0.007489
Bollinger Bands (20, 2σ)
Upper half
Striped ends = price outside the bands.
The D1 close is above the middle Bollinger band and below the upper band, consistent with a positive but not boundary-breaking technical picture. H4 is near its middle band, reinforcing the reading of tactical hesitation rather than strong directional extension. The bands describe context, not targets.
- Position in band
- 68%
- Band width
- 4020.5 pips (4.24%)
Moving averages (D1)
Bullish structure
- 50 EMA rising9.47512Price is 860.8 pips above (+0.91%)
- 200 SMA falling9.55145Price is 97.5 pips above (+0.10%)
D1 price above EMA20, EMA50 and SMA200 supports the bullish trend state, and the EMA50 slope is rising. The falling SMA200 slope and mixed closes are counterevidence to a uniformly strengthening structure. On H4, price below EMA20 but near EMA50 reflects the less decisive tactical picture.
- D1 close
- 9.56120
- 50 EMA
- 9.47512
- 200 SMA
- 9.55145
ATR (14)
Stable volatility
One ATR either side of the latest close. A measure of move size, not a price target.
Stable volatility indicates the current range of movement is not classified as expanding or contracting in the supplied state. It does not resolve direction; the D1 levels and the event risk remain more relevant to assessing possible tests.
- D1 ATR
- 0.06403 (0.67%)
- H4 ATR
- 0.02699 (0.28%)
Technical conclusion: The D1 trend, positive momentum and close above the listed moving averages form the strongest evidence for the bullish weekly bias. The mixed close sequence and falling SMA200 slope temper that case, while neutral H4 readings show limited tactical confirmation. The next selected D1 levels are support at 9.52918 and resistance at 9.65481; H4 support at 9.55396 and resistance at 9.5906 provide nearer tactical context.
View all live USD/NOK oscillators, moving averages, pivot points and timeframe signals.
USD/NOK Weekly Support, Resistance and Invalidation
| Level | Role | Timeframe | Why it matters |
|---|---|---|---|
| 9.52918 | Primary support | D1 | The reference close is above this selected support; a D1 move below it would weaken the immediate bullish structure. |
| 9.49045 | Secondary support | D1 | This is the next selected support and also a permitted bearish target, making it relevant if downside pressure develops. |
| 9.65481 | Primary resistance | D1 | A D1 close above this resistance would provide evidence of structural extension; it is the first listed resistance above the reference close. |
| 9.68768 | Secondary resistance | D1 | This level is the second selected resistance and the first listed bullish target. |
| 9.55396 | Support | H4 | This supplied tactical support helps frame whether H4 weakness is developing alongside or against the D1 thesis. |
| 9.5906 | Resistance | H4 | A move through this supplied tactical resistance could add H4 support to the bullish case, but would not substitute for D1 confirmation. |
These are forecast-specific market-structure levels. Formula-based Classic, Fibonacci and Camarilla pivots remain on the Technical page.
Economic News & Events to Watch for USD/NOK This Week
Selected events may increase USD/NOK volatility. Direction depends on the released value relative to consensus and previous results.
Scroll table sideways for more columns →
| Event | Date and time | Importance | Previous | Consensus |
|---|---|---|---|---|
| Treasury Currency Report | 16 Oct 2026 03:00 GMT+3 | Medium | — | — |
Calendar source: FXGlory economic calendar. Retrieved 11 Oct 2026 17:45 GMT+3. View the complete USD/NOK economic calendar.
USD/NOK Outlook for 11–17 October 2026
The higher-timeframe evidence favors a bullish reading: D1 trend and momentum are positive, and the reference close is above the listed moving averages. That alignment is qualified by mixed closes and a falling SMA200 slope, while H4 remains neutral and below its EMA20. Those conflicts make follow-through conditional rather than established.
The selected D1 support at 9.52918 and resistance at 9.65481 frame the immediate technical context, with 9.68768 and 9.77153 available only as listed bullish targets if the scenario develops. Stable volatility does not settle direction, and the Treasury Currency Report scheduled for 16 Oct 2026 03:00 GMT+3 may introduce repricing risk. The supplied data does not establish the report’s outcome or market reaction.
Weekly Forecast Risks and What Would Change the Outlook
- Timeframe disagreement: Bullish D1 trend and positive momentum contrast with neutral H4 conditions, so short-term price action may not reinforce the weekly thesis.
- Mixed D1 price action: The mixed close sequence and falling SMA200 slope qualify the otherwise supportive D1 trend and moving-average positioning.
- Scheduled USD event: The medium-impact Treasury Currency Report is listed for 16 Oct 2026 03:00 GMT+3. With no actual, forecast or previous values supplied, its potential repricing effect is uncertain.
- Stable volatility classification: Stable volatility offers no indication of directional expansion; price may continue to develop without resolving the competing timeframe signals.
Formal weekly invalidation: The bullish weekly thesis is formally invalidated by one completed D1 close below 9.47124. One completed D1 close above 9.67402 confirms upper structural extension and continuation.
USD/NOK Weekly Forecast FAQs
Is USD/NOK bullish or bearish this week?
The weekly bias is bullish because the D1 trend and momentum are positive. Mixed closes and neutral H4 conditions limit the immediacy of that case.
What scenario would strengthen for USD/NOK this week?
A bullish scenario would gain support if D1 strength carried through resistance toward the listed bullish targets. A neutral outcome remains plausible if price action stays two-sided around the supplied support and resistance. Weakness through support would put the bearish alternative into focus.
What are the key USD/NOK support and resistance levels?
The selected primary support is 9.52918 and primary resistance is 9.65481; secondary levels are 9.49045 and 9.68768. Listed bullish targets are 9.68768 and 9.77153, while bearish targets are 9.49045 and 9.45509.
What would invalidate this USD/NOK forecast?
The bullish weekly thesis is formally invalidated by one completed D1 close below 9.47124.
Methodology, Data and Sources
- Price-data source: FXGlory price feed (USDNOK)
- Live quote timestamp: 10 Oct 2026 02:50 GMT+3
- Weekly analysis timestamp: 11 October 2026
- Chart timestamp: 11 October 2026 (redrawn daily)
- Technical snapshot timestamp: 11 October 2026
- Calendar-data source: FXGlory economic calendar
- Calendar retrieval timestamp: 11 Oct 2026 17:45 GMT+3
- Candle convention: FXGlory D1 and H4 candles; D1 candle dates are evaluated in UTC and invalidation uses completed D1 closes only.
- Indicator settings: D1 RSI(14), MACD(12,26,9), Bollinger Bands(20,2), EMA(50), SMA(200), ATR(14); H4 RSI/MACD/Bollinger/EMA/ATR.
- Level-selection method: Weekly D1 support/resistance levels are structural market levels. Formal invalidation uses a hard 0.75× D1 ATR(14) minimum anchor distance plus a 0.30× D1 ATR(14) outward buffer; H4 levels are tactical only.
- Weekly forecast method: D1 controls the weekly thesis; H4 supplies tactical confirmation/warning only.
