What Consistent Profits Mean in Forex
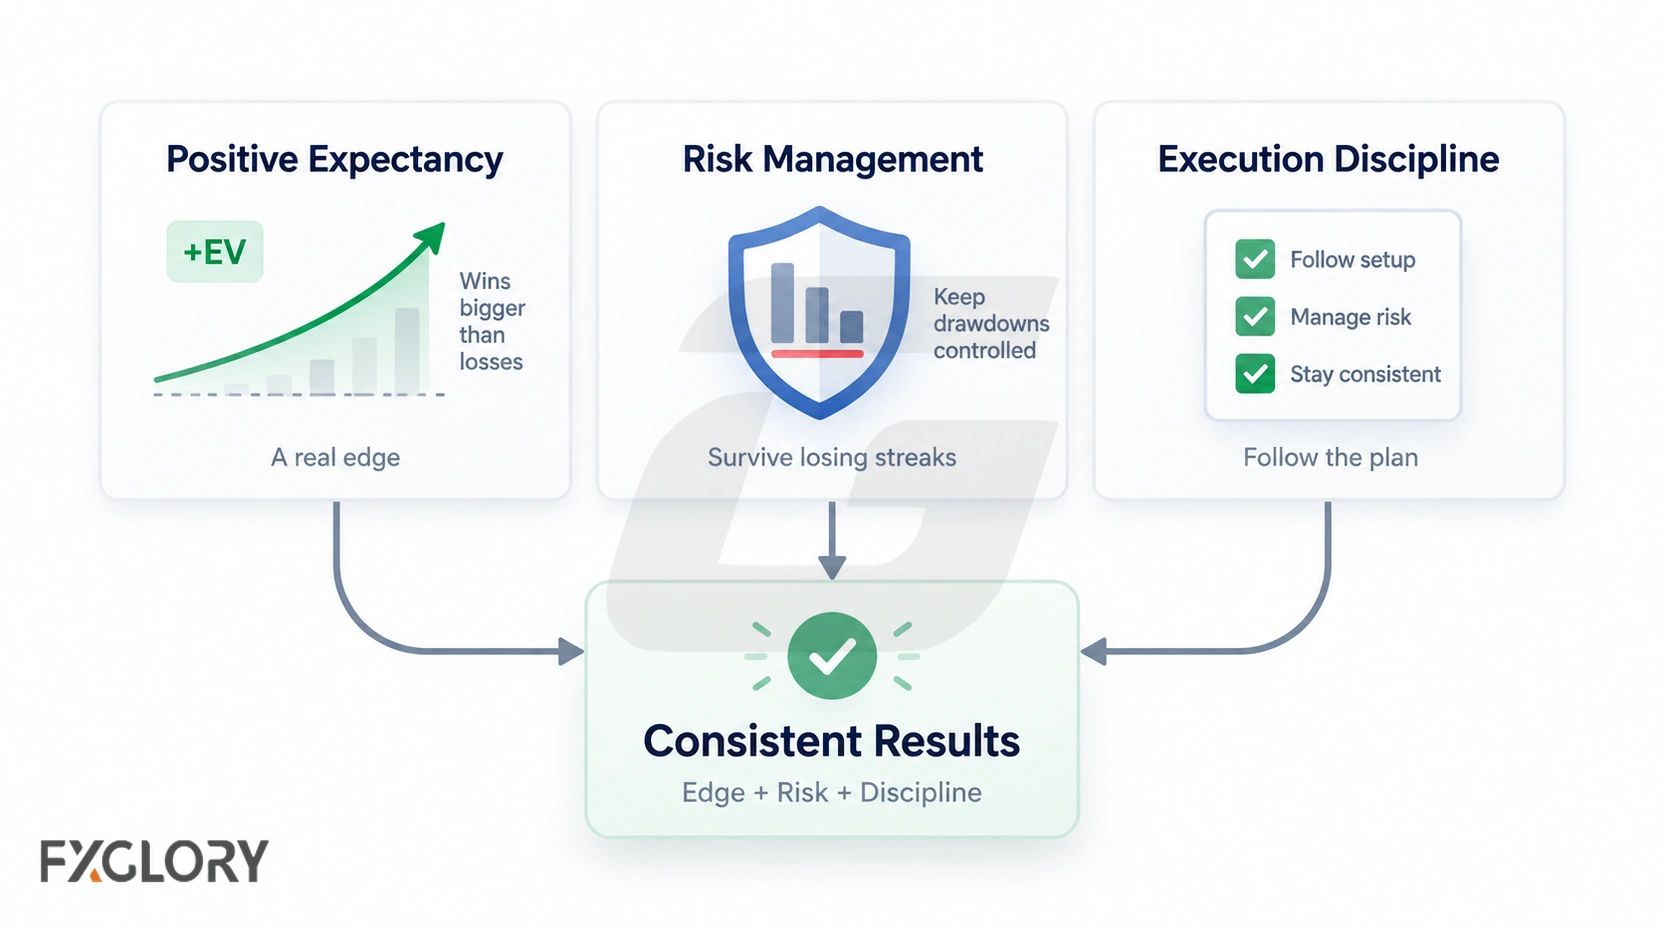
Consistency in forex trading has three measurable parts. All three must be present. When one is missing, results become unreliable regardless of how good the other two are.
- Positive expectancy over a statistically significant sample. At least 100 trades where the average win multiplied by the win rate exceeds the average loss multiplied by the loss rate — after spreads, slippage, and swap costs. A three-week winning streak on EUR/USD is not consistency. It is a small sample that may reflect market conditions, not edge.
- Risk-normalized returns that repeat across market regimes. A strategy that performs well in trending markets but loses steadily during range-bound periods is regime-dependent, not consistent. A consistent strategy either performs across conditions or the trader can identify when the conditions for the edge are absent and stays out.
- Execution discipline that keeps the system intact. A backtest means nothing if the trader doubles position size after a loss, moves a stop because a level looks like it might hold, or enters a setup that does not meet the written criteria. A strategy followed 80% of the time produces results that are 80% strategy and 20% discretion — and the mixed output cannot be measured reliably.
No single indicator, timeframe, or entry pattern produces consistency by itself. The educational backtest on this page — 34,579 test trades across three strategy types, six pairs, and ten years — demonstrates that the same rule model can produce positive results on one pair and negative results on another. Consistency is the stability of the edge across instruments and conditions, not the performance on the best-looking chart.
Why Win Rate Does Not Measure Consistency
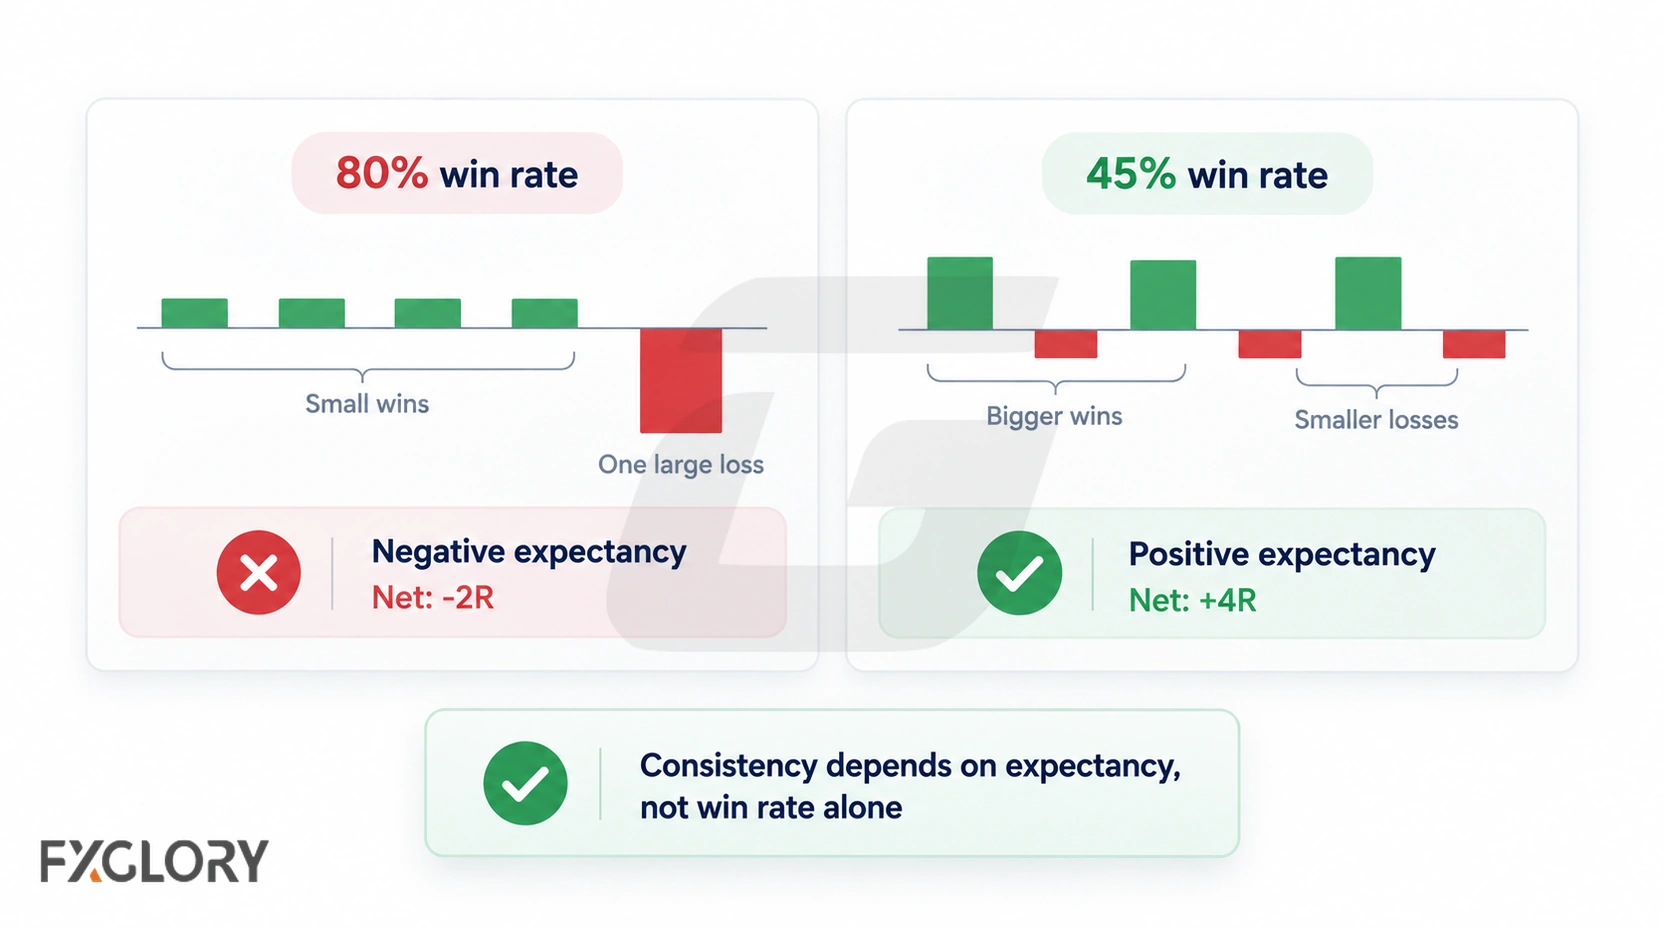
Win rate is the most commonly reported performance number in forex because it is simple. A 70% win rate sounds better than a 35% win rate. But win rate alone answers none of the following: How large is the average win? How large is the average loss? What is the profit factor? What is the longest losing streak?
The relationship between win rate and profitability is governed by the breakeven formula:
Required Win Rate = 1 ÷ (1 + Reward-to-Risk Ratio)
At 1:1 reward-to-risk, the breakeven win rate is just above 50%. At 1:2, it drops to just above 33%. At 1:3, it drops to just above 25%. A swing trader targeting wider reward-to-risk ratios can be consistently profitable with a win rate that a scalper targeting 1:1 ratios could not sustain.
| Win Rate | Average Win | Average Loss | Expectancy Per Trade | Profitable After 100 Trades? |
|---|---|---|---|---|
| 70% | 20 pips | 50 pips | -1 pip | No |
| 50% | 30 pips | 30 pips | 0 pips | Breakeven before costs |
| 40% | 50 pips | 30 pips | +2 pips | Yes — before costs |
| 35% | 80 pips | 30 pips | +8.5 pips | Yes |
| 25% | 120 pips | 30 pips | +7.5 pips | Yes |
The 35% win rate trader earning 8.5 pips of positive expectancy per trade will, over hundreds of trades, outperform the 70% win rate trader losing 1 pip per trade. The educational backtest on this page confirms the same principle with real data: the breakout strategy had the highest win rate at 42% — the only model above 40% — yet its combined expectancy (-0.027R) was nearly identical to the trend-following strategy's (-0.013R) at a 27% win rate. The reason: average wins were +1.00R versus +1.79R. A higher win rate with smaller wins does not produce better results.
The Three Components of a Consistent Forex Strategy
Every approach that has produced consistent results — trend following on the daily chart, breakout trading from consolidation zones, mean reversion inside established ranges — depends on the same three components. Remove any one and the approach becomes unreliable.
Component 1: A Statistical Edge — Positive Expectancy
An edge is a repeatable method that identifies trade opportunities where the probability-weighted outcome is positive before costs. The formula:
Expectancy = (Win Rate × Average Win) − (Loss Rate × Average Loss)
An edge must be definable in writing. If the entry rule cannot be stated clearly enough that another trader could replicate it without asking questions, the edge has not been defined — it is still intuition, and intuition cannot be backtested or measured for consistency.
A written edge includes: the market condition that must be present, the entry trigger, the stop-loss placement rule, the take-profit rule, and the position size formula. Until these are on paper, the strategy is a hypothesis, not a system.
Component 2: Risk Management That Survives Losing Streaks
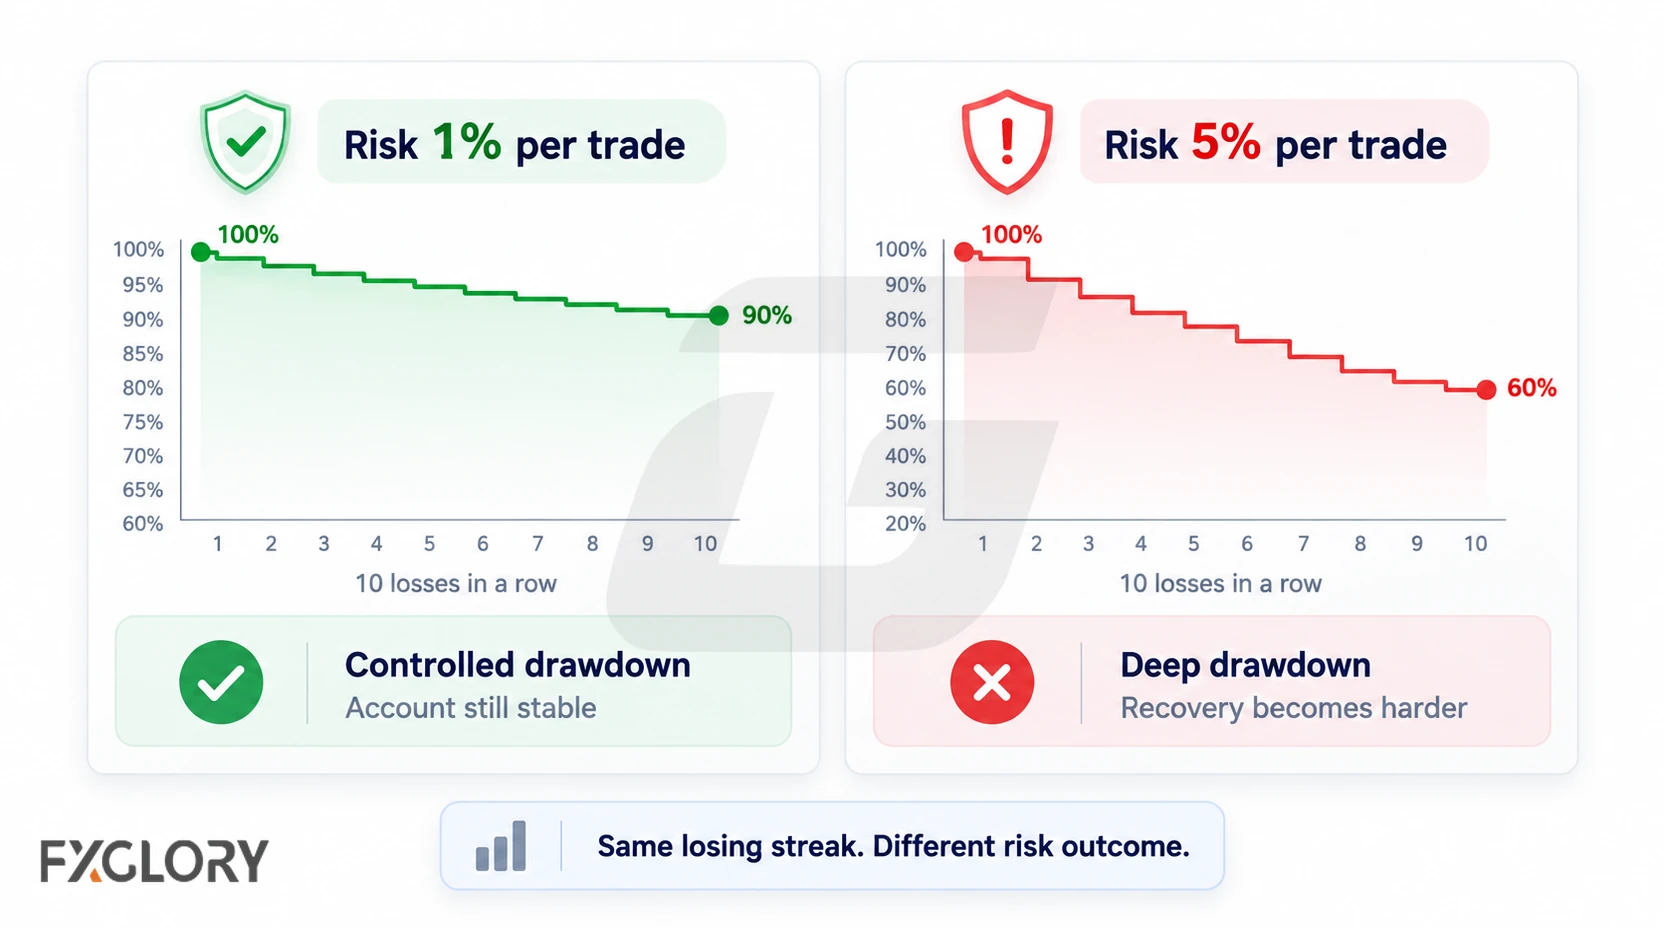
A strategy with positive expectancy will encounter consecutive losses. A system with a 40% win rate has roughly an 8% chance of producing five consecutive losses. Over 200 trades, that sequence will appear about 16 times.
Risk management controls the damage those streaks cause. Three rules that must be in place:
- Fixed fractional position sizing. Risk the same percentage of account equity per trade. At 1% risk per trade, a 10-trade losing streak reduces the account by roughly 9.6%. At 5% per trade, the same streak costs roughly 40%. The smaller size keeps the account intact long enough for edge to manifest.
- Stop losses placed by structure. A stop should sit beyond a level that invalidates the trade thesis — below a swing low for longs, above a swing high for shorts. A stop placed at an arbitrary pip distance is not risk management. The market has no obligation to respect it.
- Exposure limits across correlated positions. Four open positions on EUR/USD, GBP/USD, AUD/USD, and NZD/USD are not four independent trades. They are one directional dollar position. Limit total exposure to any single currency or macroeconomic driver.
For detailed position sizing and exposure rules, see the full risk management strategy. Use the FXGlory margin calculator after the stop distance is known.
Component 3: Execution Discipline — Following the Written Plan
A backtested edge and a risk plan produce results only when they are followed. Execution discipline means:
- Taking every setup that meets the written criteria, even after consecutive losses — because skipping the next valid setup is the most reliable way to miss the trade that starts the recovery.
- Skipping every setup that does not meet the written criteria, even when the chart appears ready to move — because trades taken outside the system cannot be measured, and their results cannot inform future decisions.
- Closing positions at predetermined targets rather than letting intra-session conviction override the plan.
- Stopping after hitting a daily loss limit. No additional trade to recover the loss.
A trader who follows a daily routine with written criteria and fixed risk per trade will, over a year, outperform a more talented analyst who overrides their own rules — because the disciplined trader's results are measurable, and measurement is what enables improvement.
How to Measure Whether a Strategy Is Consistent
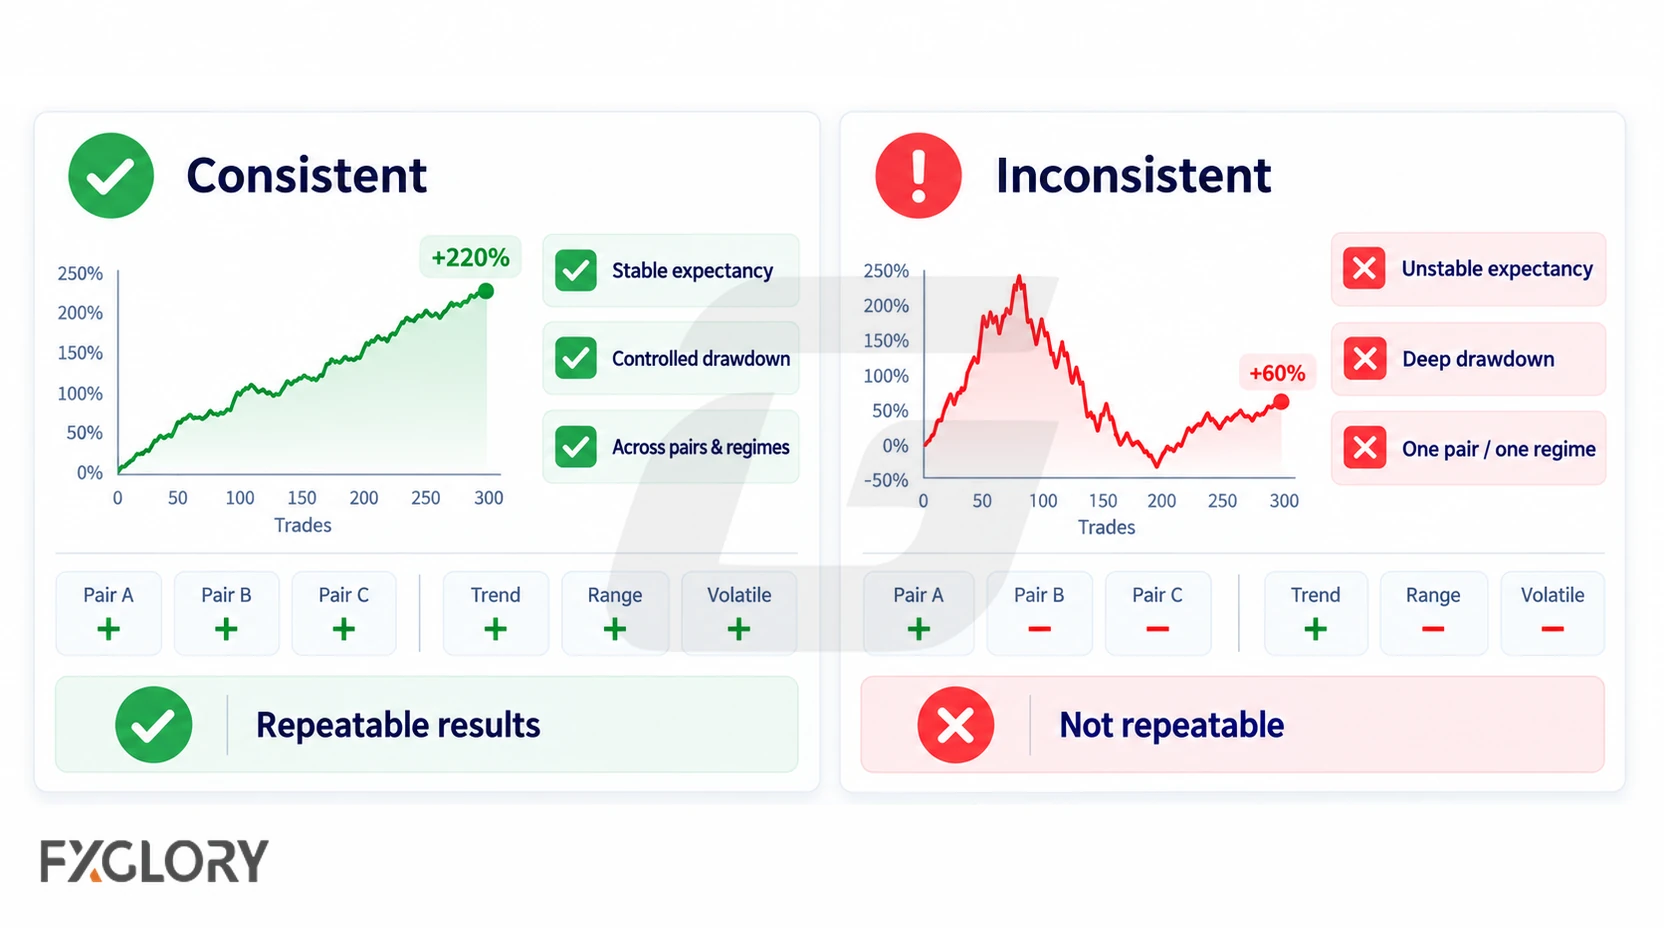
Five metrics, tracked over at least 100 trades:
| Metric | Formula | What to Look For |
|---|---|---|
| Profit factor | Gross profit ÷ Gross loss | Above 1.0 = profitable before costs. Above 1.5 = strong. Above 2.0 = check for curve-fitting. Below 1.0 = losing strategy. |
| Expectancy by market regime | Segment overall expectancy into trending weeks, ranging weeks, high-volatility sessions, and low-volatility sessions | A strategy profitable only because of a few large trend-following trades and negative during range-bound periods is regime-dependent. Its headline expectancy overstates its consistency. |
| Maximum drawdown and recovery time | Peak-to-trough decline; number of trades to reach a new equity peak | A 15% drawdown recovering in two weeks is different from the same drawdown taking six months. The second is harder to follow under live conditions. |
| Expectancy standard deviation across pairs and years | Standard deviation of per-pair and per-year expectancy values | A strategy with +0.10R average expectancy and a tight range (+0.05R to +0.15R) is more consistent than one with +0.20R average that ranges from -0.50R to +0.90R. The educational backtest on this page shows this directly: Strategy B ranged from +0.25R to -0.215R — a 0.465R spread. The headline expectancy (-0.027R) hides the instability. |
| Equity curve pattern | Visual inspection of the cumulative R-over-time line | A smooth, steadily rising equity curve with shallow and short-lived drawdowns indicates a more consistent strategy than one with sharp spikes followed by long flat or declining periods — even if both end with the same profit factor. The shape reveals whether profits are concentrated in a few outlier trades or distributed across the sample. |
A Step-by-Step Framework for Building a Consistent Strategy
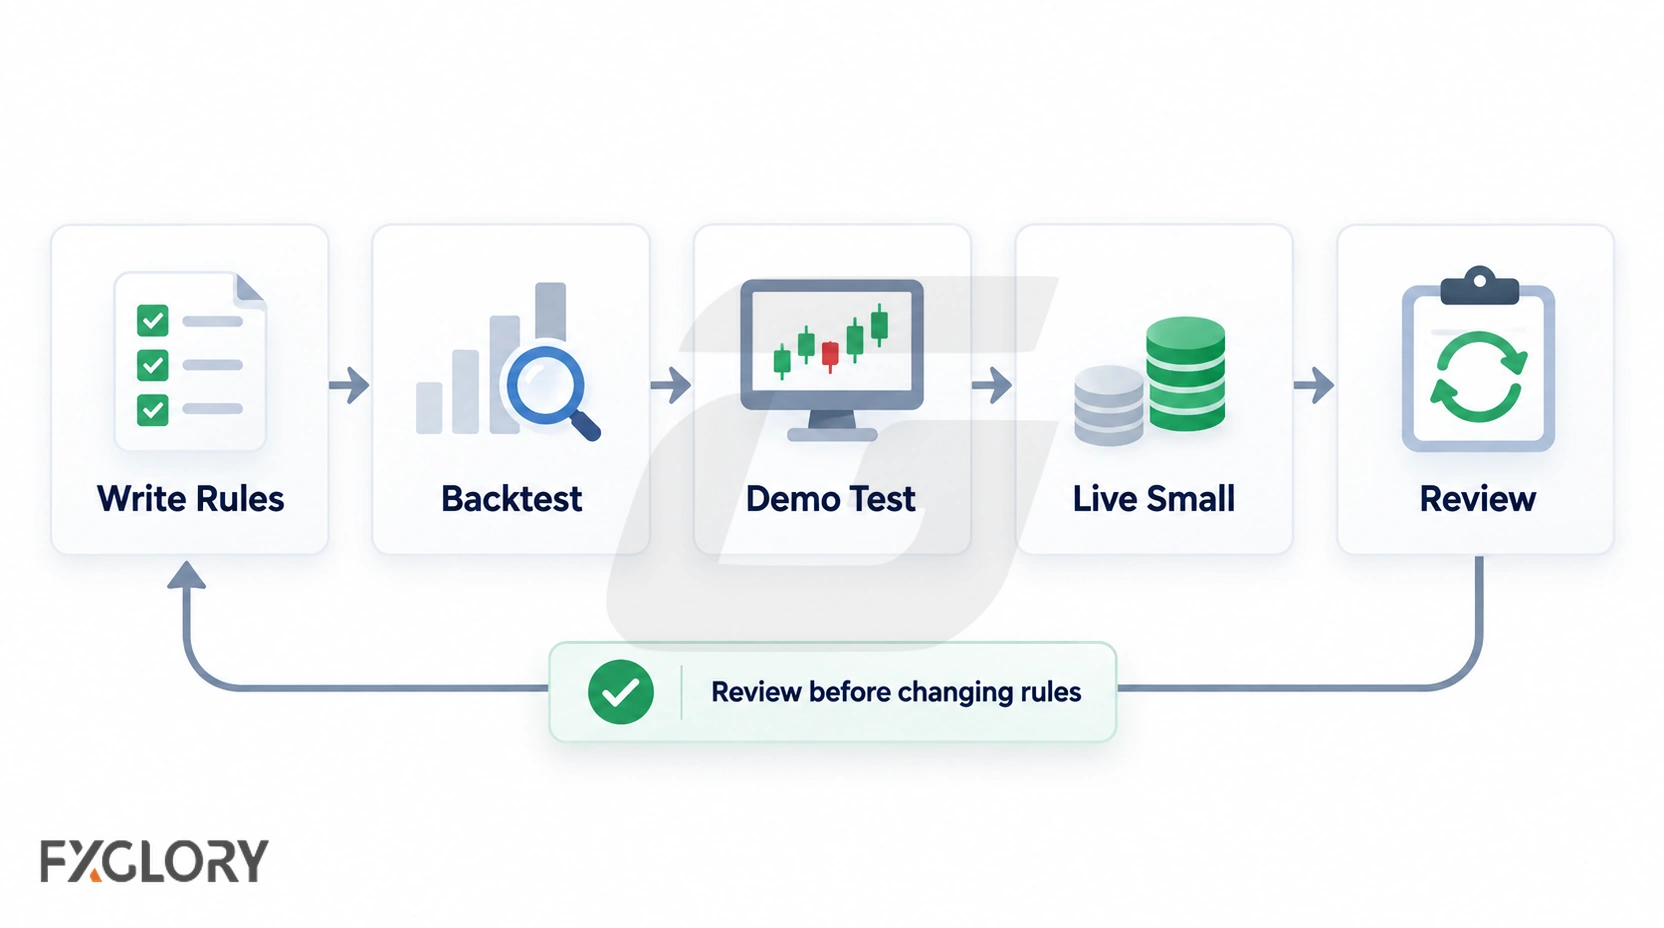
The steps below apply to any strategy type — trend following, breakout trading, range trading, or another approach. The framework is the constant; the strategy type is the variable.
| Step | Action | Failure Warning |
|---|---|---|
| 1. Write the strategy rules | Document the market condition, entry trigger, stop-loss rule, take-profit rule, position size formula, and session/pair filter. | Entering based on a feeling and calling it a strategy afterward. |
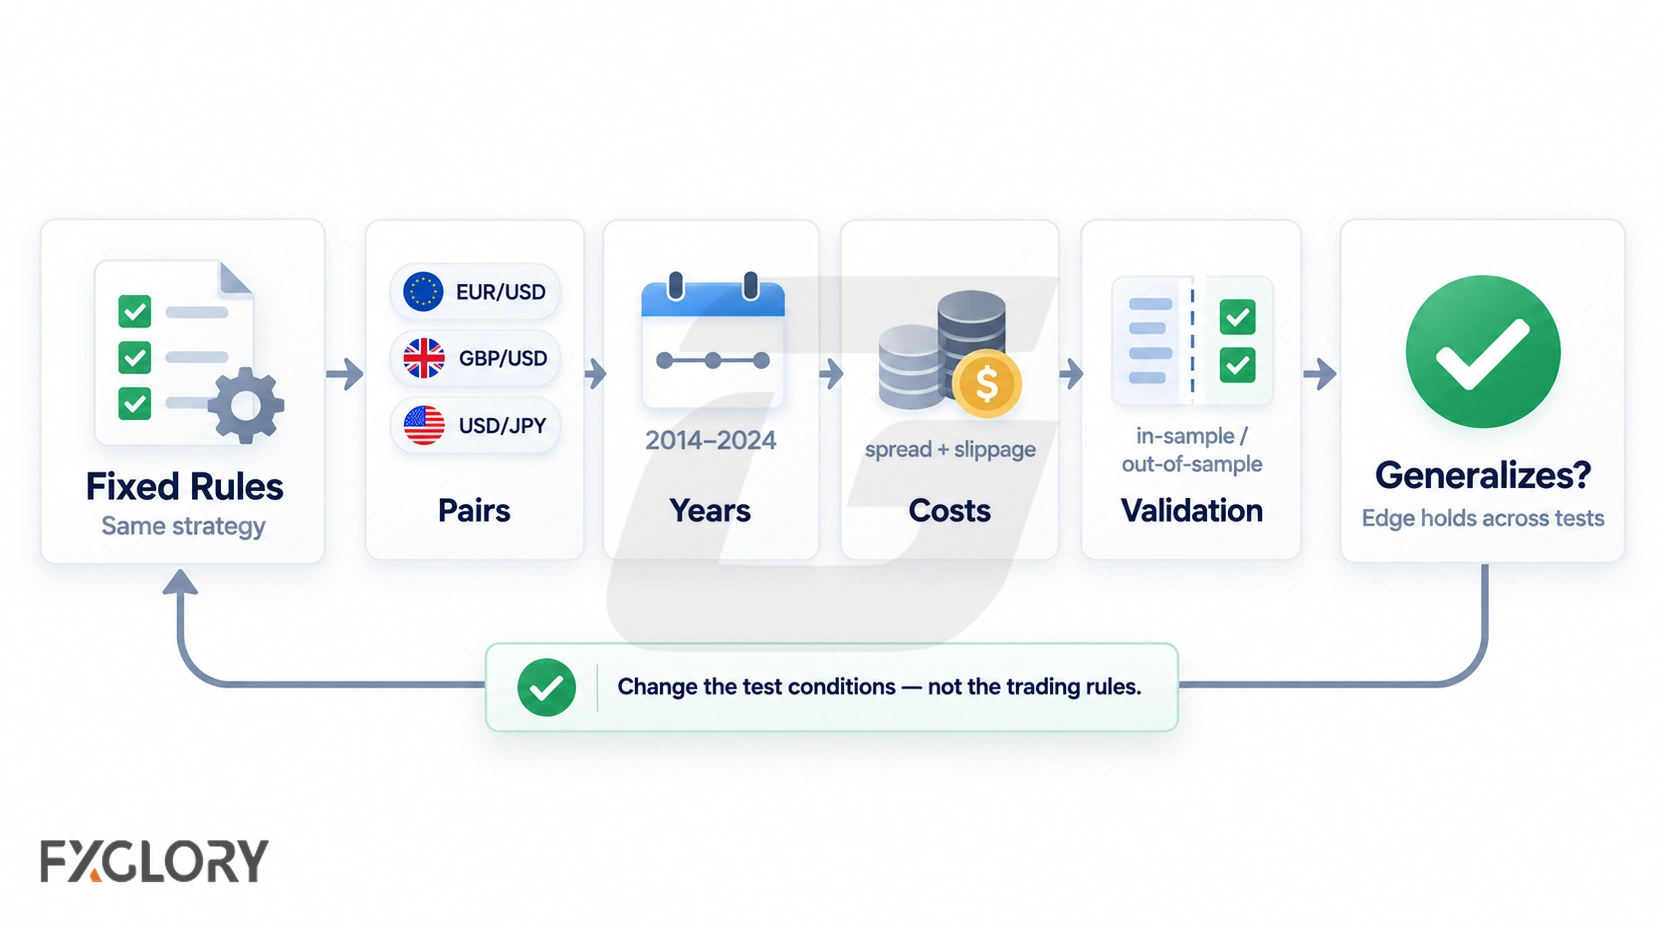
| 2. Backtest on historical data | Review at least 200 trades manually or programmatically across multiple years and market conditions. Use realistic spread and slippage. Split data into in-sample (development) and out-of-sample (validation). | Testing 30 trades on one pair during a trending year and concluding the strategy works. |
| 3. Forward-test on a demo account | Trade the strategy on demo for 30 to 50 trades with real spreads, fills, and rollover. Compare metrics against the backtest. Divergence signals execution problems, psychological interference, or curve-fitting. | Skipping demo testing because the backtest looked good. |
| 4. Trade live with minimum size | The first 50 live trades test whether the strategy can be executed without deviation when real money is on the line. Only after two months of plan-adherent execution should size increase — by 0.25% risk per trade at a time, with at least 20 trades at each level. | Doubling position size after a winning week. Abandoning the system after a losing week. |
| 5. Review execution before adjusting parameters | After every 20 trades, check the journal for execution errors: skipped valid setups, taken invalid setups, moved stops, moved targets. Fix execution first. Adjust strategy parameters only after execution is clean and the problem persists. | Changing the moving average period every time the equity curve dips. |
Strategy Types and Their Consistency Profiles
No strategy type produces consistency automatically. The trader's measurement and execution determine the outcome. However, some approaches have structural characteristics that affect how consistency is maintained:
| Strategy Type | Structural Advantage for Consistency | Structural Risk | Related Reading |
|---|---|---|---|
| Trend following (daily and 4-hour) | Setups develop slowly. Fewer trades reduce overtrading risk. Wider reward-to-risk ratios are common. | Choppy markets produce clusters of false signals that test whether the trader continues taking valid setups. | Forex trend trading strategy |
| Swing trading key levels | Rules are mechanical: identify level, wait for reaction, enter with stop beyond level, target opposing level. | Level breaks that reverse immediately produce whipsaw losses. | Forex swing trading strategy |
| Position trading (weekly and monthly) | Intraday noise is irrelevant. Trades are infrequent — 5 to 15 per year — making overtrading nearly impossible. | Holding cost, swap, and event exposure accumulate over long holding periods. | Forex position trading strategy |
| Breakout trading from consolidation | Entry is triggered by an objective event — price acceptance beyond a defined range. | False breakouts during low-volume sessions can produce clustered losses. | Forex breakout strategy |
| Range trading and mean reversion | Well-defined boundaries create clear entry, stop, and target levels. Win rates tend to be higher than trend-following approaches. | Range breaks that extend into sustained trends can produce large losses if invalidation is ignored. The educational backtest on this page showed Strategy C's mean-reversion entries at daily swing levels were systematically broken by trend continuation. | Forex range trading strategy |
Day trading and scalping can produce consistent results but demand more execution discipline because decision frequency is higher and the margin for error on each trade is smaller.
What Destroys Consistency in an Otherwise Sound Strategy
Most strategies do not fail because the edge disappeared. They fail because one of the following patterns interrupted the process:
| Pattern | How It Appears | Control Rule |
|---|---|---|
| Strategy hopping | Three losses in a choppy market → switch from trend following to mean reversion. Mean reversion gets run over by a trend day → switch to supply and demand. No strategy gets enough trades for edge to manifest. | Commit to at least 100 trades with one strategy before evaluating. Every strategy eventually encounters its worst-case market conditions. |
| Curve-fitting | Adjusting parameters until historical performance looks perfect — changing the moving average from 20 to 21 to 22 until the equity curve is smooth. | Develop on in-sample data. Validate on out-of-sample data that was never used for optimization. If performance collapses out-of-sample, the strategy is overfit. Walk-forward analysis provides an even stricter test. |
| Revenge trading | After a loss where the stop was hit before the market reversed in the expected direction, doubling position size on the next trade to recover. | Set a daily loss limit before the session. When it is reached, stop. Each trade is independent. The market does not track your P&L. |
| Emotional position sizing | Increasing risk after losses. Decreasing risk after wins. This produces the inverse of what compounding requires. | Use fixed fractional sizing. Risk the same percentage per trade regardless of the previous outcome. Journal every deviation. |
| Ignoring market conditions | Trading a breakout strategy during the Asian range. Trading a trend-following strategy in a sideways market. | Check the higher-timeframe context before entry. If the strategy requires a trend and the daily chart is range-bound, no entry is valid regardless of what the lower timeframe shows. |
| Thesis drift | A short-term setup becomes a long-term position because the trader does not want to book a loss. The original reason for entry is replaced. | Write the exit rule before entry. Compare every open trade against the original thesis during scheduled reviews. |
How Broker Execution Affects Strategy Consistency
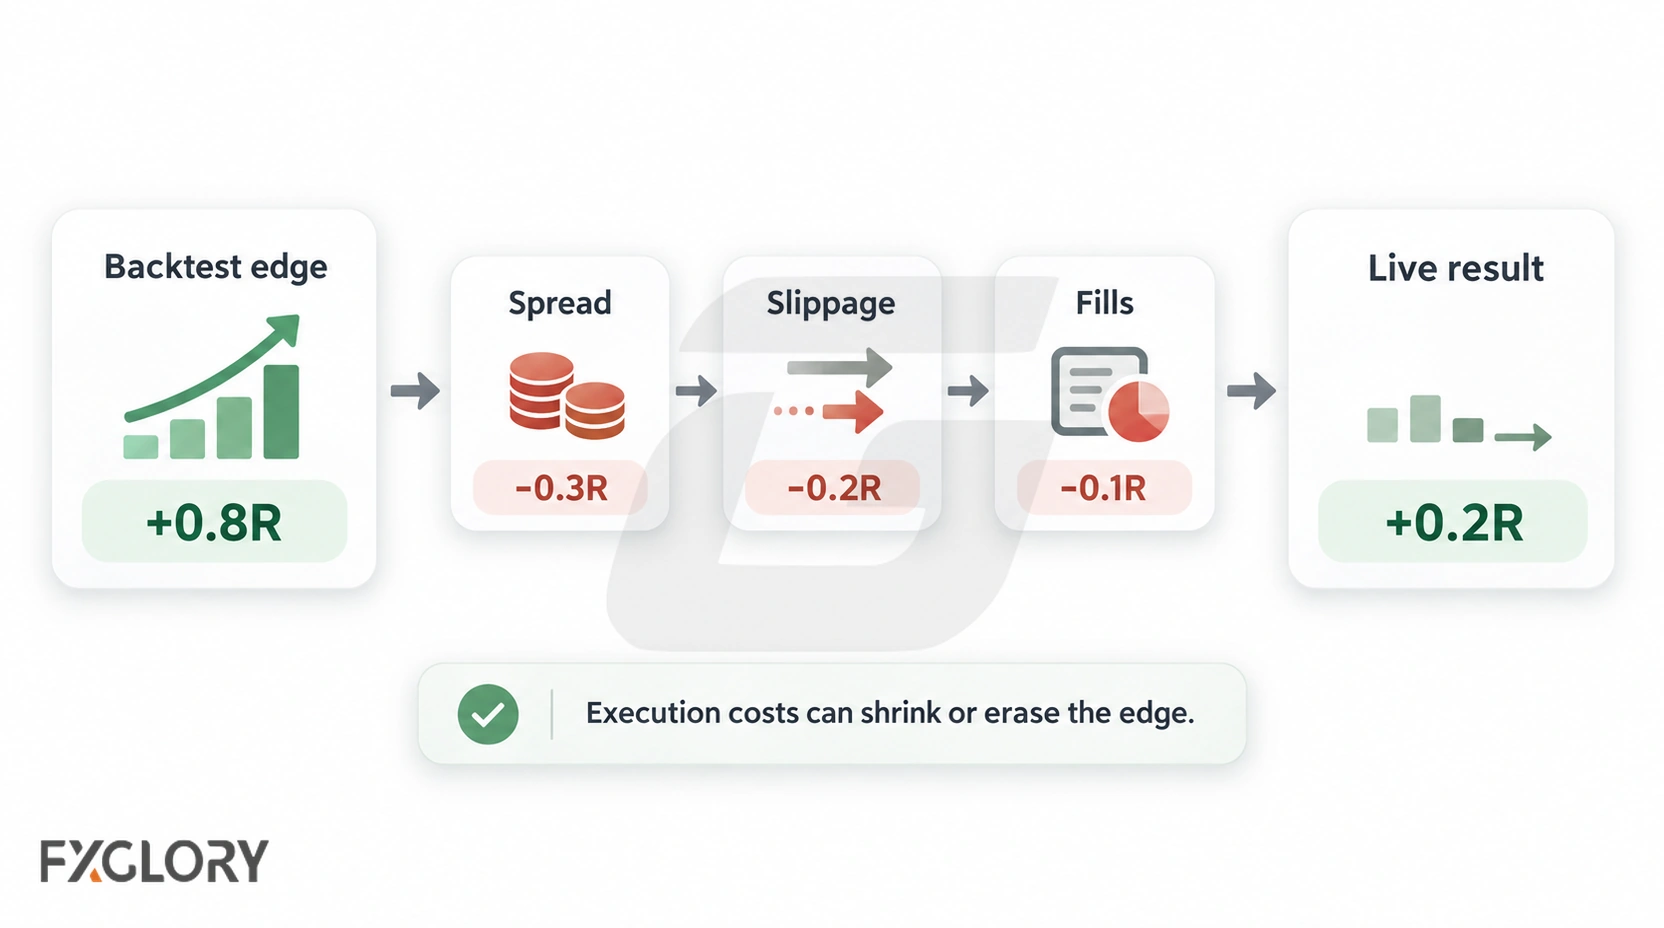
A strategy measured with tight spread assumptions that executes on an account with variable spreads will underperform the measurement — not because the edge failed, but because the execution environment did not match the test conditions.
| Factor | How It Affects Consistency | What to Check |
|---|---|---|
| Spread stability | A variable spread that widens during news or rollover can reduce a 1:1.5 reward-to-risk trade to 1:1.2 without the trader changing anything. Over 100 trades, spread variability alone can separate a profitable period from a breakeven one. | Review FXGlory spreads during normal conditions and around major releases. Compare with the spread assumptions used in the backtest. |
| Execution slippage | On a breakout strategy, 2 pips of slippage on entry and 2 on exit costs 4 pips per round trip. Against a strategy averaging 20 pips of profit per winning trade, that removes 20% of the edge before spread is counted. | Forward-test on a demo account and compare fill prices with expected entry and exit prices. If slippage is consistently higher than the backtest assumption, the expectancy calculation should be adjusted. |
| Platform and order type support | Strategies that depend on specific order types — stop-loss orders placed at structural levels, limit orders for targets — need a platform that executes those orders reliably. | Test all order types used by the strategy on a demo account during both quiet and volatile sessions before going live. |
FXGlory offers MT4 and MT5 platforms. Before going live with any strategy, review current spread conditions, leverage terms, and margin requirements against the assumptions used in testing.
No-Trade Conditions
Most setups should not be traded live until the strategy has been measured. The conditions below should stop a trade:
- Skip if the entry rule cannot be written clearly enough that another trader could replicate it without asking questions.
- Skip if the strategy has fewer than 100 backtested trades across multiple pairs and market conditions.
- Skip if the forward-test on demo shows materially different metrics than the backtest — the cause should be identified before live trading begins.
- Skip if the stop distance requires a position size that exceeds the account risk limit.
- Skip if spread, swap, or margin conditions make the holding cost unsuitable for the expected holding period. The breakout strategy's 44.7-day average hold makes this check especially important.
- Skip if a major economic release or central bank event is scheduled during the expected holding period and the strategy has no written event rule.
- Skip if several open positions already share exposure to the same currency or macroeconomic driver.
- Skip if the trade is being entered as a response to a recent loss rather than because the written criteria are met.
- Skip if the review schedule has not been written before entry.
Backtesting a Strategy for Consistency
This section defines the testing framework used to generate the educational backtest results on this page. Three strategy types were tested under the same cost assumptions, pairs, and 10-year date range to demonstrate how consistency metrics differ across strategy families. The Python script and trade log are available on request.
Rule Models Tested
| Strategy | Entry Rule | Invalidation | Target | Sensitivity Tested |
|---|---|---|---|---|
| Strategy A — Trend + Pullback | Daily close above/below EMA(trend). Pullback to 20 EMA, then close crosses back across 20 EMA in trend direction. Or retest of broken structure. | 5-bar swing beyond pullback or failed breakout structure. | 2R or exit on trend break. Max hold 60 bars. | EMA trend: 40, 50, 60. Each with 3 spreads × 3 slippages = 27 runs per pair. |
| Strategy B — 20-Day Breakout | Daily close above highest high of prior 20 bars (long). Daily close below lowest low of prior 20 bars (short). | Daily close back inside the 20-day range. | 2R or exit on range re-entry. Max hold 60 bars. | 3 spreads × 3 slippages = 9 runs per pair. |
| Strategy C — S/R Mean Reversion | Price touches prior daily swing level with rejection candle (close above open for longs at support, close below open for shorts at resistance; wick ≥ 1.5× body). | Daily close beyond the level by 0.3× 14-period ATR. | 1.5R. Max hold 60 bars. | 3 spreads × 3 slippages = 9 runs per pair. |
Cost and Validation Settings
| Setting | Values Tested | Why It Matters |
|---|---|---|
| Pairs | EURUSD, GBPUSD, USDJPY, AUDUSD, USDCAD, USDCHF | Cross-pair measurement reveals whether edge is general or pair-specific. |
| Date range | 2014-01-01 to 2024-12-31 (daily OHLC) | 11 years covers trending, ranging, volatile, and quiet regimes. |
| Spread assumptions | 0.5, 1.5, and 3.0 pips per round trip | Strategies with smaller average wins are more sensitive to spread erosion. |
| Slippage assumptions | 0.1, 0.5, and 1.0 pips per side | Breakout entries are particularly slippage-sensitive during volatile breaks. |
| Swap or rollover | Not included — reviewed separately | The breakout strategy's 44.7-day average hold makes swap cost potentially significant. |
Consistency-Specific Review Points
Beyond standard backtest metrics, a consistency measurement should review:
- Pair variation: Does one pair account for most of the profit? In the educational test below, the breakout strategy's pair-level expectancy ranged from +0.25R to -0.215R — a spread that makes the headline number unreliable as a single summary.
- Trade frequency: Does the strategy generate enough trades for statistical confidence? The breakout strategy produced approximately 44 unique signals per pair — enough for an initial read but not for precise win rate estimates. The standard error on a 42% win rate at N=44 is roughly ±7.5 percentage points — the true win rate could reasonably be anywhere from 35% to 50%.
- Losing streak accuracy: Does the longest observed losing streak match what the win rate predicts? The trend-following strategy's 18-trade worst streak at a 27% win rate is consistent with the math. The mean-reversion strategy's 25-trade streak at a 26% win rate suggests the trades were not independent — losses clustered during sustained trend runs, which is exactly what the failure mechanism analysis would predict.
- Drawdown scale: Is the maximum drawdown survivable? The mean-reversion strategy's -3,668R combined drawdown would require risking a fraction of 1% per trade to survive — and even then, a 25-trade losing streak would test whether the trader continues executing the rules.
- Equity curve shape: A smooth, steady curve with shallow drawdowns indicates a more consistent process than one with sharp spikes and long flat periods — even at the same final profit factor. Equity curve analysis is recommended before live testing any strategy.
Educational Backtest: Three Rule Models Across Six Pairs (2014–2024)
The following results were generated from yfinance public research data using the rule models and cost assumptions described above. The data source was public research data, not FXGlory broker execution data. The Python script and trade log are available on request.
Combined Metrics — All Pairs, All Sensitivity Runs
| Metric | Strategy A Trend + Pullback | Strategy B 20-Day Breakout | Strategy C S/R Mean Reversion |
|---|---|---|---|
| Trades (all sensitivity runs) | 21,546 | 2,403 | 10,630 |
| Approx. unique signals | ~800 | ~267 | ~1,181 |
| Win rate | 27.07% | 42.16% | 26.40% |
| Average win | +1.79R | +1.00R | +1.48R |
| Average loss | -0.68R | -0.77R | -1.00R |
| Expectancy | -0.013R | -0.027R | -0.345R |
| Profit factor | 0.97 | 0.94 | 0.53 |
| Max drawdown | -808.28R | -110.60R | -3,668.15R |
| Worst losing streak | 18 trades | 11 trades | 25 trades |
| Avg holding period | 7.31 days | 44.72 days | 7.40 days |
Pair-Level Comparison
| Pair | Strategy A | Strategy B | Strategy C | |||
|---|---|---|---|---|---|---|
| Expectancy | Profit Factor | Expectancy | Profit Factor | Expectancy | Profit Factor | |
| EURUSD | -0.017R | 0.97 | -0.069R | 0.86 | -0.376R | 0.50 |
| GBPUSD | +0.166R | 1.35 | -0.177R | 0.66 | -0.345R | 0.53 |
| USDJPY | -0.029R | 0.94 | +0.250R | 1.85 | -0.377R | 0.50 |
| AUDUSD | -0.059R | 0.89 | -0.215R | 0.59 | -0.343R | 0.53 |
| USDCAD | -0.072R | 0.87 | +0.145R | 1.40 | -0.364R | 0.52 |
| USDCHF | -0.063R | 0.87 | -0.082R | 0.82 | -0.277R | 0.60 |
No strategy type produced positive expectancy across all six pairs. Four findings stand out:
1. Win rate did not predict performance. The breakout strategy had the highest win rate (42%) — nearly 15 points above the trend-following strategy — yet its combined expectancy (-0.027R) was similar to the trend-following strategy's (-0.013R). The reason: average wins were +1.00R versus +1.79R. A high win rate with small wins does not produce positive expectancy by itself.
2. Pair selection determines what a single-pair test shows. The breakout strategy on USDJPY produced +0.25R expectancy with a 1.85 profit factor. The same rule on AUDUSD produced -0.215R with a 0.59 profit factor — a 0.465R spread between the best and worst pair from the identical rule model. A trader who backtested only USDJPY would see a strong positive result. A trader who backtested only AUDUSD would see a clear failure. Neither view would be complete.
3. Mean reversion at obvious daily swing levels failed systematically. The mean-reversion strategy's average loss (-1.00R) matched the planned 1R risk across nearly every pair. The win rate was 26% — meaning roughly three out of four entries at prior swing levels were stopped out. The mechanism: support and resistance levels on daily forex charts attract breakout traders who enter in the direction of the break. When price approaches a prior level with momentum, it breaks through more often than it reverses. The mean-reversion trader enters against this flow, the stop is hit, and the 1.5R target is not reached often enough to compensate. The 25-trade worst losing streak and -3,668R combined drawdown make this specific rule model — entering against daily swing levels with a simple rejection candle — unsuitable for live trading without significant additional filtering, such as requiring higher-timeframe trend alignment or multi-timeframe confluence before entry.
4. Trade frequency affects statistical confidence. The breakout strategy generated approximately 44 unique signals per pair. At that sample size, the standard error on a 42% win rate is roughly ±7.5 percentage points — the true win rate could reasonably be anywhere from 35% to 50%. A trader evaluating a low-frequency strategy needs either a longer testing period, more instruments, or additional forward-testing to reduce this uncertainty. The trend-following strategy's larger sample (~130 unique signals per pair) provides narrower confidence intervals on the per-pair metrics.
Testing and Journal Checklist
A strategy should be journaled by type — trend-following setups, breakout setups, and mean-reversion setups should not be mixed unless the comparison is deliberate and the rules are identical.
- Define the strategy type: trend following, breakout, range or mean reversion, swing trading, position trading, or another defined approach.
- Write the entry rule — specific enough that another trader could replicate it.
- Write the invalidation rule — the price, structure, or event that proves the trade thesis wrong.
- Write the exit rule — target, trailing stop, structure break, time-based review, or cost-based review.
- Calculate position size from stop distance — position size comes after the invalidation distance is known, not before.
- Record trading conditions: spread, slippage, swap, margin, and leverage for each trade.
- Record event exposure: central bank decisions, inflation data, employment releases, and other scheduled events during the expected holding period.
- Record the reason for entry — which written criteria were met.
- Record the reason for exit — target reached, invalidation hit, time review, event exit, or discretionary override.
- Tag execution errors: skipped valid setup, took invalid setup, moved stop, moved target, resized mid-trade, or exited emotionally.
- Review every 20 trades — separate execution errors from edge problems before adjusting parameters. If execution was clean and the problem persists, the edge may need refinement — but fix the trader first.
- Collect at least 100 trades per strategy type before evaluating whether the strategy has positive expectancy. Past samples are not proof of future performance.
- Test across multiple pairs before concluding the edge is real. A strategy that works on one pair may be exploiting pair-specific behavior that will not generalize.
- Forward-test on demo for 30–50 trades before going live. Compare fill prices with expected prices. If slippage is higher than the backtest assumption, adjust the expectancy estimate before risking capital.
Frequently Asked Questions
What is the most consistent forex strategy?
No single strategy type — trend following, breakout trading, range trading, or swing trading — is inherently more consistent than another. The educational backtest on this page tested three different strategy types across six pairs and ten years. None was positive across all pairs, but each had different consistency profiles. The takeaway: consistency is produced by the measurement and execution framework around the strategy, not by the strategy type itself. A daily trend-following approach with written entry and exit rules, fixed-fractional position sizing, and a review schedule can produce consistent results when executed as written — and the same approach traded with random position sizing, moved stops, and no journal will produce inconsistent results regardless of the underlying edge.
How many trades are needed to measure whether a strategy is consistent?
At least 100 trades provide an initial read on expectancy and win rate. For statistical confidence, 200 to 300 trades across multiple market regimes — trending, ranging, volatile, and quiet periods — is recommended. The educational backtest on this page shows why: the trend-following strategy generated over 3,500 trades per pair (including sensitivity runs), while the breakout strategy generated only about 400 per pair. At approximately 44 unique trade signals per pair for the breakout model, the standard error on the win rate is roughly ±7.5 percentage points — the true win rate could reasonably be anywhere from 35% to 50%. Low-frequency strategies require longer testing periods or more instruments to reach the same statistical confidence.
Can a strategy with a low win rate still be consistent?
Yes. Win rate only matters in relation to the average win size and average loss size. The breakeven formula — Required Win Rate = 1 ÷ (1 + Reward-to-Risk Ratio) — shows that at a 1:2 ratio, a trader only needs to win more than 33% of trades. The educational backtest on this page confirms this with real data: the breakout strategy had the highest win rate at 42%, yet its combined expectancy (-0.027R) was similar to the trend-following strategy's (-0.013R) at a 27% win rate. Win rate was higher, but average wins were smaller (+1.00R vs +1.79R). The more impressive-sounding number did not translate to better performance.
What is the difference between a consistent strategy and a profitable strategy?
A profitable strategy can be the result of a favorable market regime, a lucky run on one instrument, or a small sample that has not yet encountered its worst-case conditions. A consistent strategy produces similar risk-adjusted results across multiple instruments, market regimes, and time periods — its profitability is not concentrated in a few outlier trades or one favorable year. The educational backtest on this page demonstrates this: the breakout strategy was profitable on USDJPY (+0.25R expectancy, 1.85 profit factor) but lost money on AUDUSD (-0.215R expectancy, 0.59 profit factor). A trader who only tested USDJPY would call it a profitable strategy. A trader who tested all six pairs would see it was not consistent. Profitability is a point-in-time result. Consistency is the stability of the process that produces it.
How do I make my forex strategy more consistent?
Write down every rule before entry: the market condition that must be present, the entry trigger, the stop placement rule, the take-profit rule, and the position size formula. Track every trade in a journal that records whether each rule was followed. After every 20 trades, review the journal for execution errors first — skipped valid setups, taken invalid setups, moved stops — before considering whether the strategy needs adjustment. In the educational backtest on this page, the difference between the trend-following strategy's near-breakeven result and the mean-reversion strategy's deeply negative result was not the strategy type alone — it was that the mean-reversion entries at obvious daily swing levels were systematically broken by trend continuation, while the trend-following entries aligned with the larger direction. A journal that segments losses by market regime would reveal this pattern within 50 trades.
How do I test a forex strategy for consistency before going live?
Backtest the strategy across at least 200 trades on historical charts covering multiple years and market conditions, with realistic spread and slippage assumptions. Then forward-test on a demo account for 30 to 50 trades to confirm the backtest metrics hold up under live execution with real spreads and fills. Compare backtest, forward-test, and eventually live results. If the three diverge significantly, the cause is usually execution slippage, psychological interference, or a backtest that was curve-fitted. For advanced testing, walk-forward analysis — where the strategy is optimized on a rolling in-sample window and tested on the subsequent out-of-sample period — provides a more realistic measure of how the strategy would have performed if traded live with periodic re-optimization. Monte Carlo simulation can also stress-test expectancy by reshuffling the trade sequence to reveal how the strategy performs under different orderings of wins and losses.
What is risk-adjusted return in forex and how is it measured?
Risk-adjusted return measures how much return a strategy generates relative to the risk taken. The three most practical measures for forex strategy testing are: profit factor (gross profit ÷ gross loss — above 1.0 is profitable before costs), expectancy per trade in R (average outcome normalized to the risk unit), and the standard deviation of R-outcomes across trades. The educational backtest on this page illustrates why the standard deviation matters: the breakout strategy ranged from +0.25R (USDJPY) to -0.215R (AUDUSD) — a 0.465R spread — while the trend-following strategy ranged from +0.17R (GBPUSD) to -0.072R (USDCAD) — a 0.24R spread. Neither was positive overall, but the trend-following strategy's narrower range means its edge, though slightly negative, was more stable across instruments.
How do I know if my strategy has stopped working or is just in a normal drawdown?
Compare the current drawdown with what the backtest showed. If the backtest's maximum drawdown was -15R and the current drawdown is -12R, the strategy is behaving within historical norms. If the current drawdown exceeds the historical maximum and the losing streak is longer than the backtest's worst streak, review execution first: were rules followed on every trade? If execution was clean and the drawdown is unprecedented, segment the losing trades by market regime. The educational backtest on this page shows why regime segmentation matters: the mean-reversion strategy's entries consistently failed because the market trended through obvious support levels — a pattern visible only when losses are grouped by market condition rather than reviewed trade by trade.
Can a beginner build a consistent forex strategy?
Yes. A beginner can write a rule-based strategy, backtest it on historical data, forward-test on a demo account, and journal every trade within months. The educational backtest on this page demonstrates the process: define the rule, test it across pairs and cost assumptions, measure the results honestly regardless of whether they are positive or negative, and identify what would need to change before live testing. The consistency of execution — following the rules without deviation when real money is at stake — typically takes longer to develop because it requires experiencing and surviving losing streaks under live conditions. Starting with the smallest possible position size and scaling only after months of plan-adherent execution reduces the cost of this learning period.
Are the backtest results on this page proof that a strategy is consistent?
No. The results are hypothetical historical results from three educational rule models tested on public research data (yfinance), not FXGlory broker execution data. They show how consistency metrics behave across different strategy types, pairs, and cost assumptions. They do not prove future live-trading performance. The combined metrics aggregate multiple sensitivity runs — for example, the trend-following strategy's 21,546 trades represent approximately 800 unique trade signals multiplied by 27 cost and parameter scenarios and should not be read as a single live-account path. The Python script and trade log used to generate these results are available on request so the methodology can be reviewed and reproduced. Consistency must be re-measured under live execution with real spreads, slippage, swap, rollover, and fill quality.
Related Contents
Test Your Strategy Framework Under Real Execution Conditions
A consistent strategy needs an execution environment where spread, slippage, and fill quality do not erode the edge you measured in testing. Open an FXGlory account, test your framework on MT4 or MT5, and compare live results against your backtest and forward-test metrics before scaling position size.
Open A Real Account