
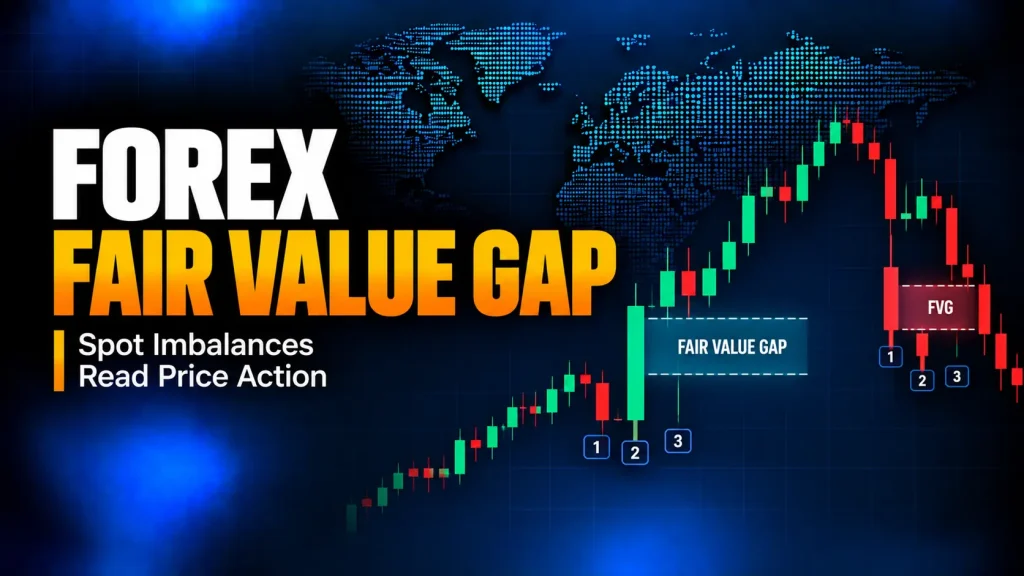
What Is a Fair Value Gap in Forex?
A fair value gap in forex is a visible price-action imbalance where a fast three-candle move leaves part of the price range not overlapped by surrounding candles.
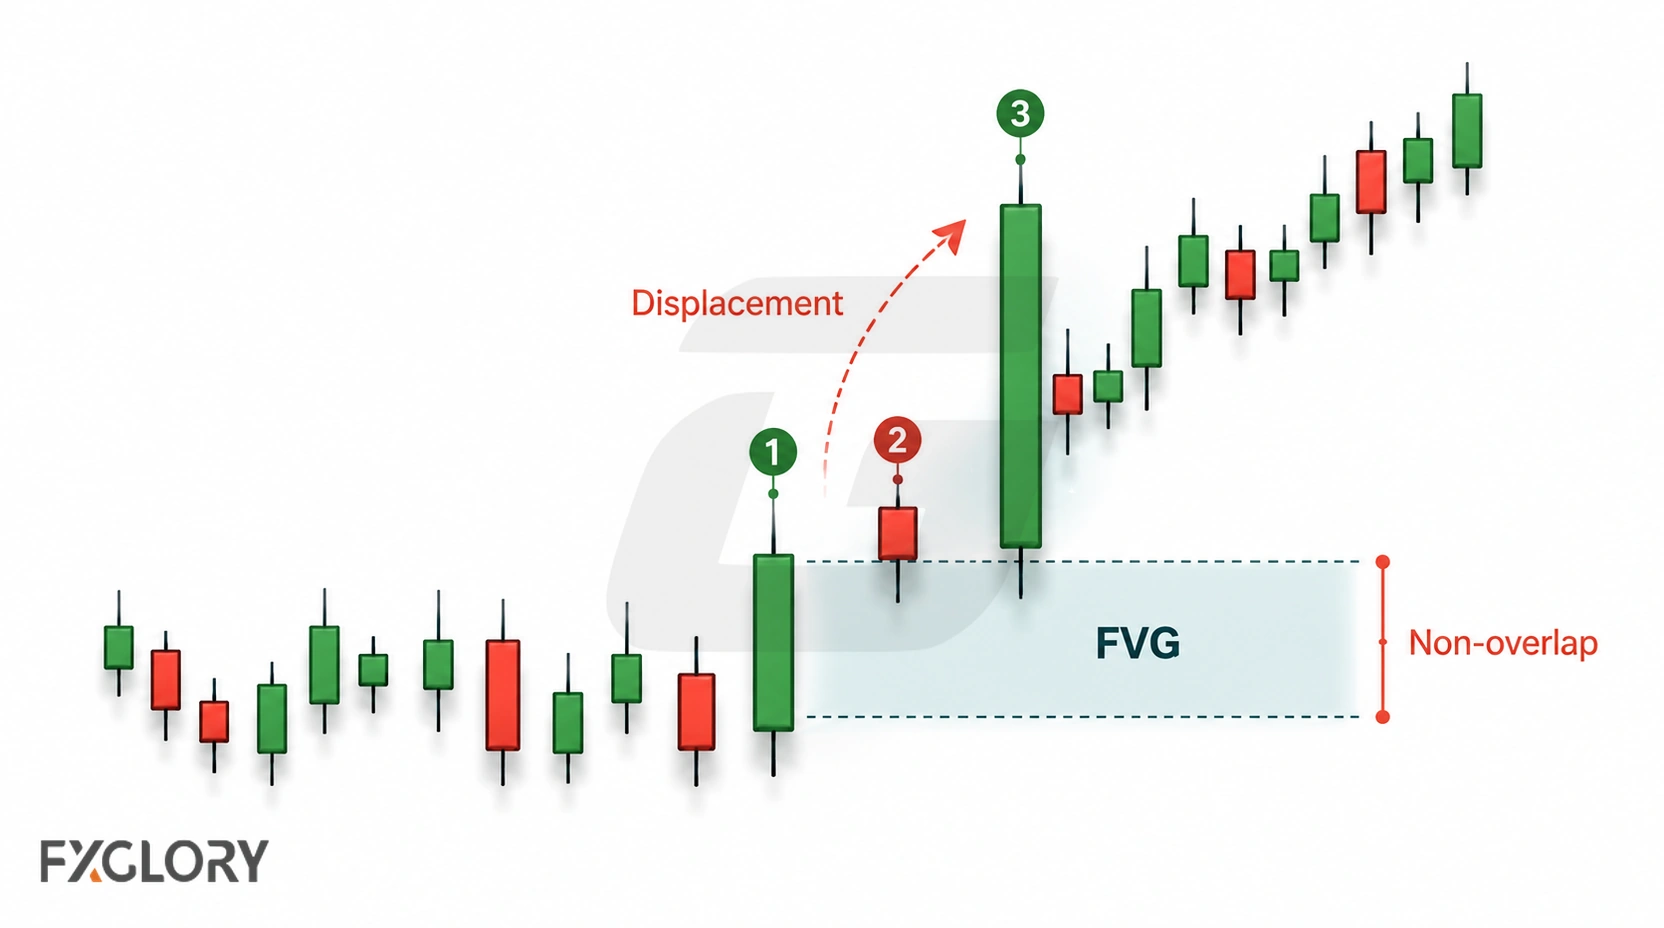
Traders often shorten fair value gap to FVG. The idea marks the part of a fast move where surrounding candles did not fully overlap the price range.
Traders can mark the non-overlapped area for later review, but the pattern alone does not define an entry, exit, position size, or future reaction.
This page treats fair value gaps as part of forex price action. For the parent concept, start with the direct price-movement layer. The price-action page explains broad chart behavior; this page focuses only on one imbalance pattern: the fair value gap.
How a Fair Value Gap Forms
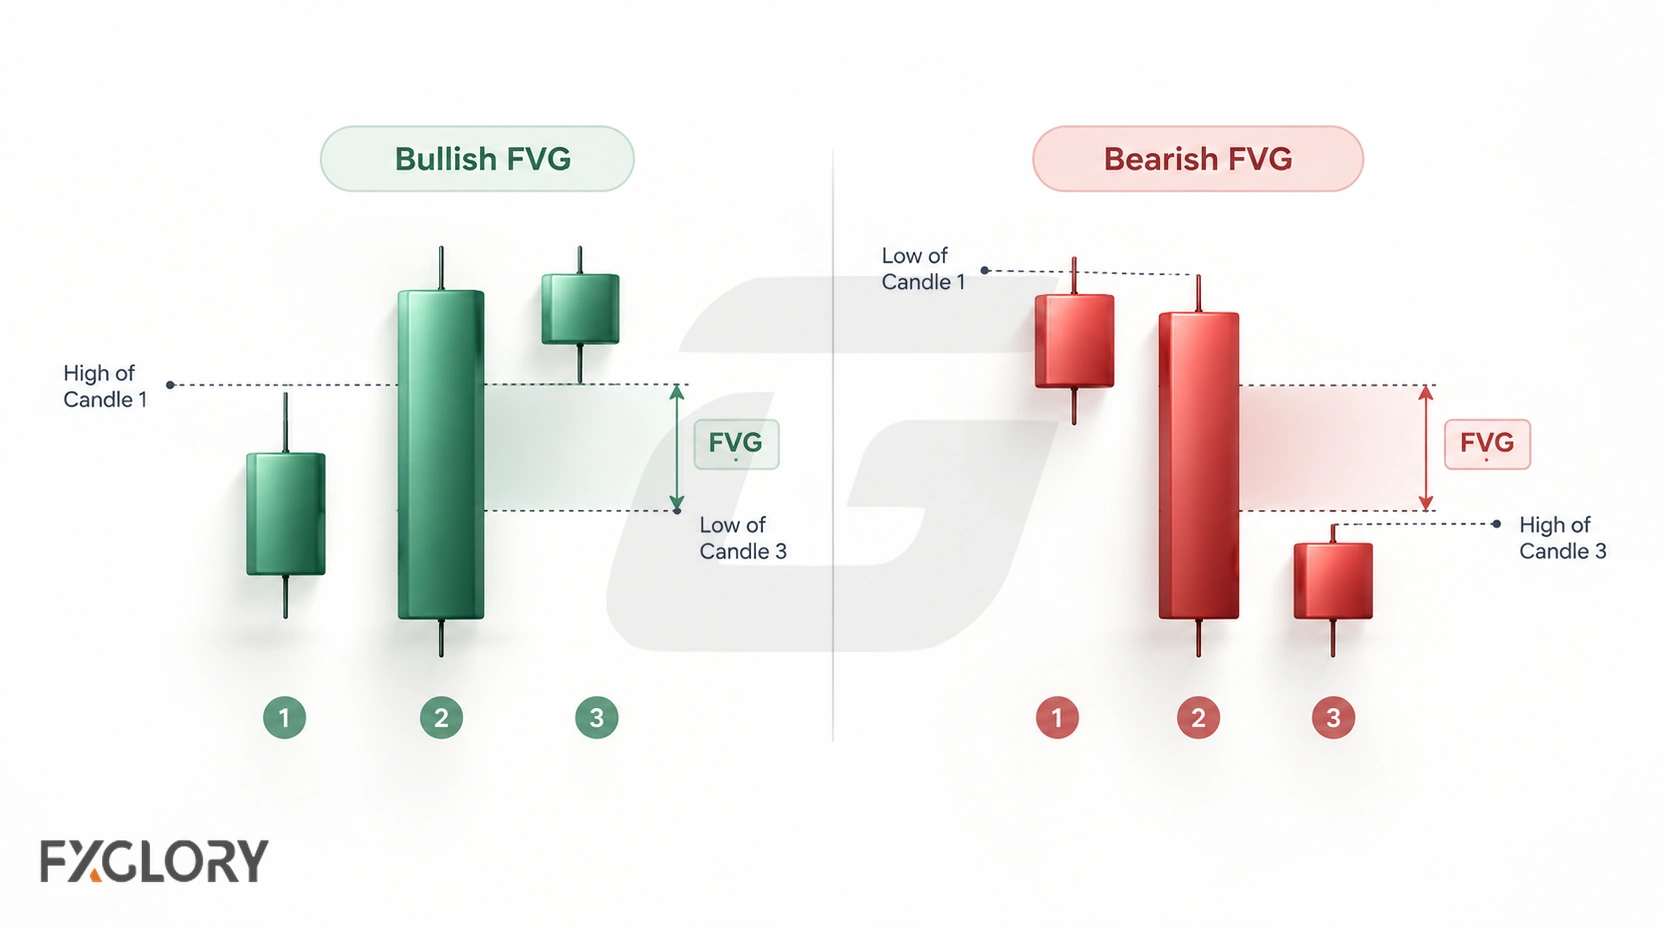
The middle candle is often the displacement candle. The key test is whether Candle 1 and Candle 3 leave a visible price area between them that does not overlap.
| FVG Type | Basic Chart Condition | What to Review Next |
|---|---|---|
| Bullish fair value gap | The third candle’s low is above the first candle’s high | Displacement, timeframe, direction, and later price behavior |
| Bearish fair value gap | The third candle’s high is below the first candle’s low | Displacement, timeframe, direction, and later price behavior |
| Inverse fair value gap | A previous FVG is broken and later reinterpreted by some traders in the opposite direction | Whether the reinterpretation fits the surrounding structure |
Size, displacement, timeframe, and surrounding structure affect whether a marked FVG is useful to review.
Because FVGs are drawn from candles, a different feed, timeframe, or candle close can change whether the gap appears at all.
Before marking any FVG, the chart itself should already be clear. For that foundation, use the chart-interface basics before marking an FVG.
Fair Value Gap vs Imbalance in Forex
The word imbalance can refer to different things. In this guide, it means visible candle structure rather than verified order-book data.
| Term | Meaning | Main Caution |
|---|---|---|
| Chart imbalance | A visible area where price moved quickly and left non-overlap on the chart | It shows chart behavior, not proof of who traded |
| Fair value gap | A common three-candle way of marking chart imbalance | It should not be treated as a guaranteed fill zone |
| Order imbalance | A mismatch between buy and sell orders in an order-flow or order-book context | A candle pattern alone does not prove actual order imbalance |
An FVG can show that price moved quickly through a range with limited overlap, but the candles do not identify who traded or establish the size or intent of the underlying orders.
Fair Value Gap vs Regular Forex Gap
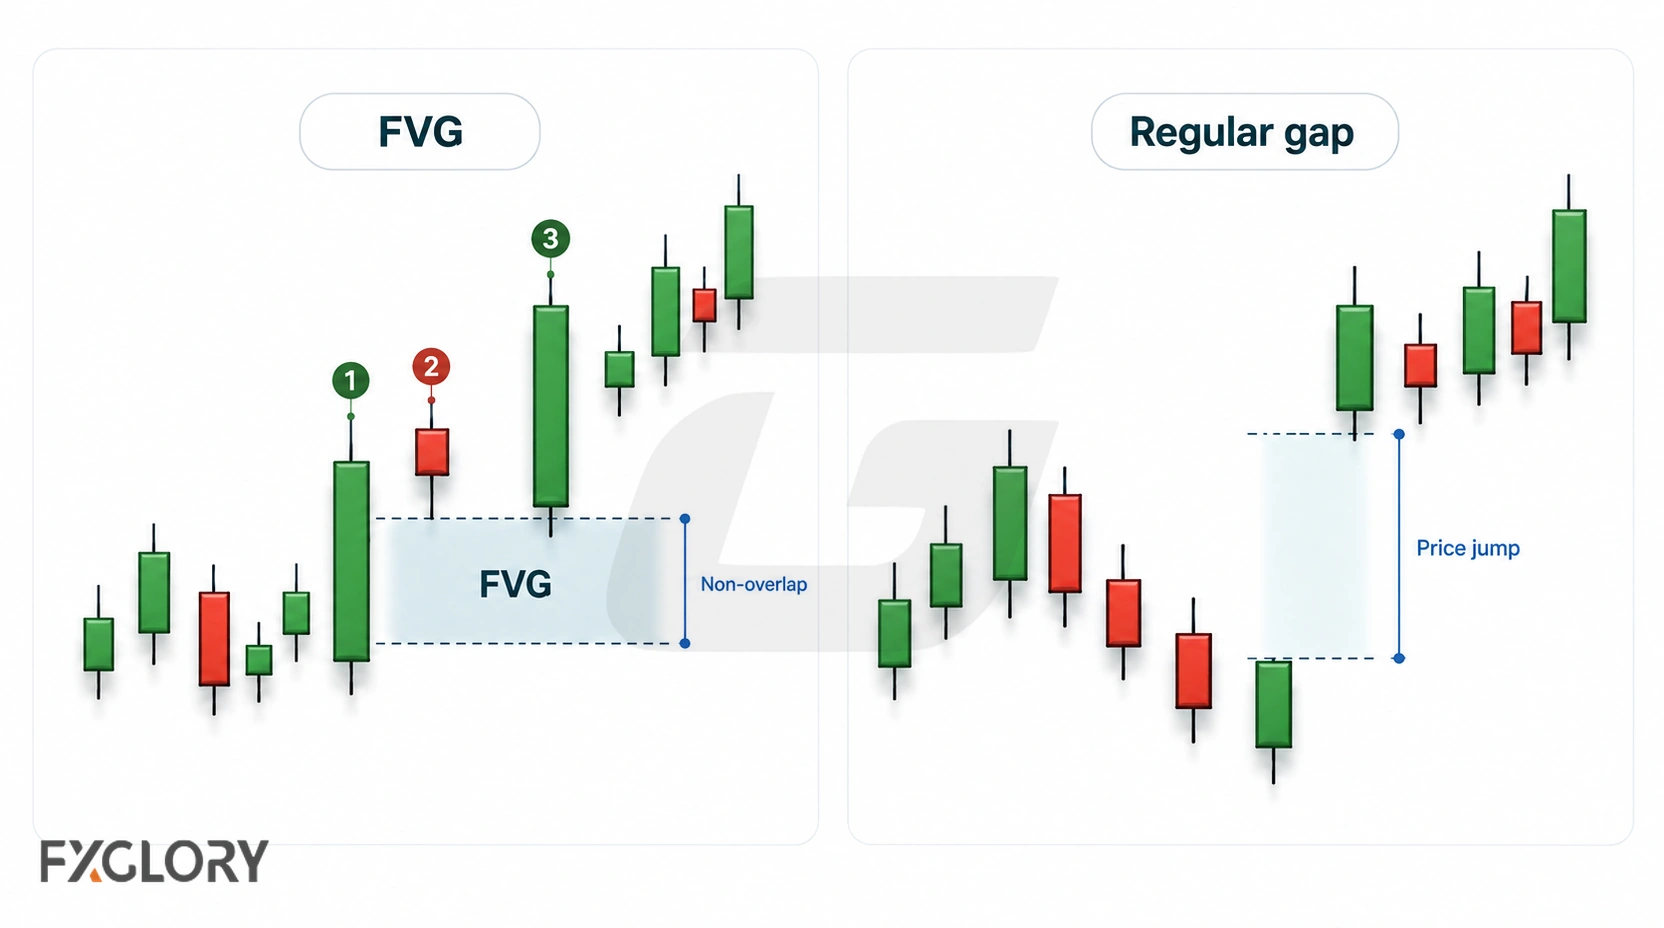
A fair value gap is not the same as a regular forex gap. The names sound similar, but the chart situations are different.
| Concept | What It Means | Main Risk |
|---|---|---|
| Fair value gap | A non-overlapped area inside a three-candle move | It may be mistaken for a guaranteed fill zone |
| Regular forex gap | A visible jump between adjacent shown prices | It may involve spread, slippage, or execution risk |
| Weekend gap | A difference between the closing area before the weekend and the reopening area after the weekend | Orders may fill away from expected levels |
For regular price jumps, weekend gaps, and execution-risk context, use the chart-jump gap risk layer.
Do Fair Value Gaps Always Fill?
No. Price may return through all of an FVG, enter only part of it, move beyond it, or never revisit it during the period being reviewed.
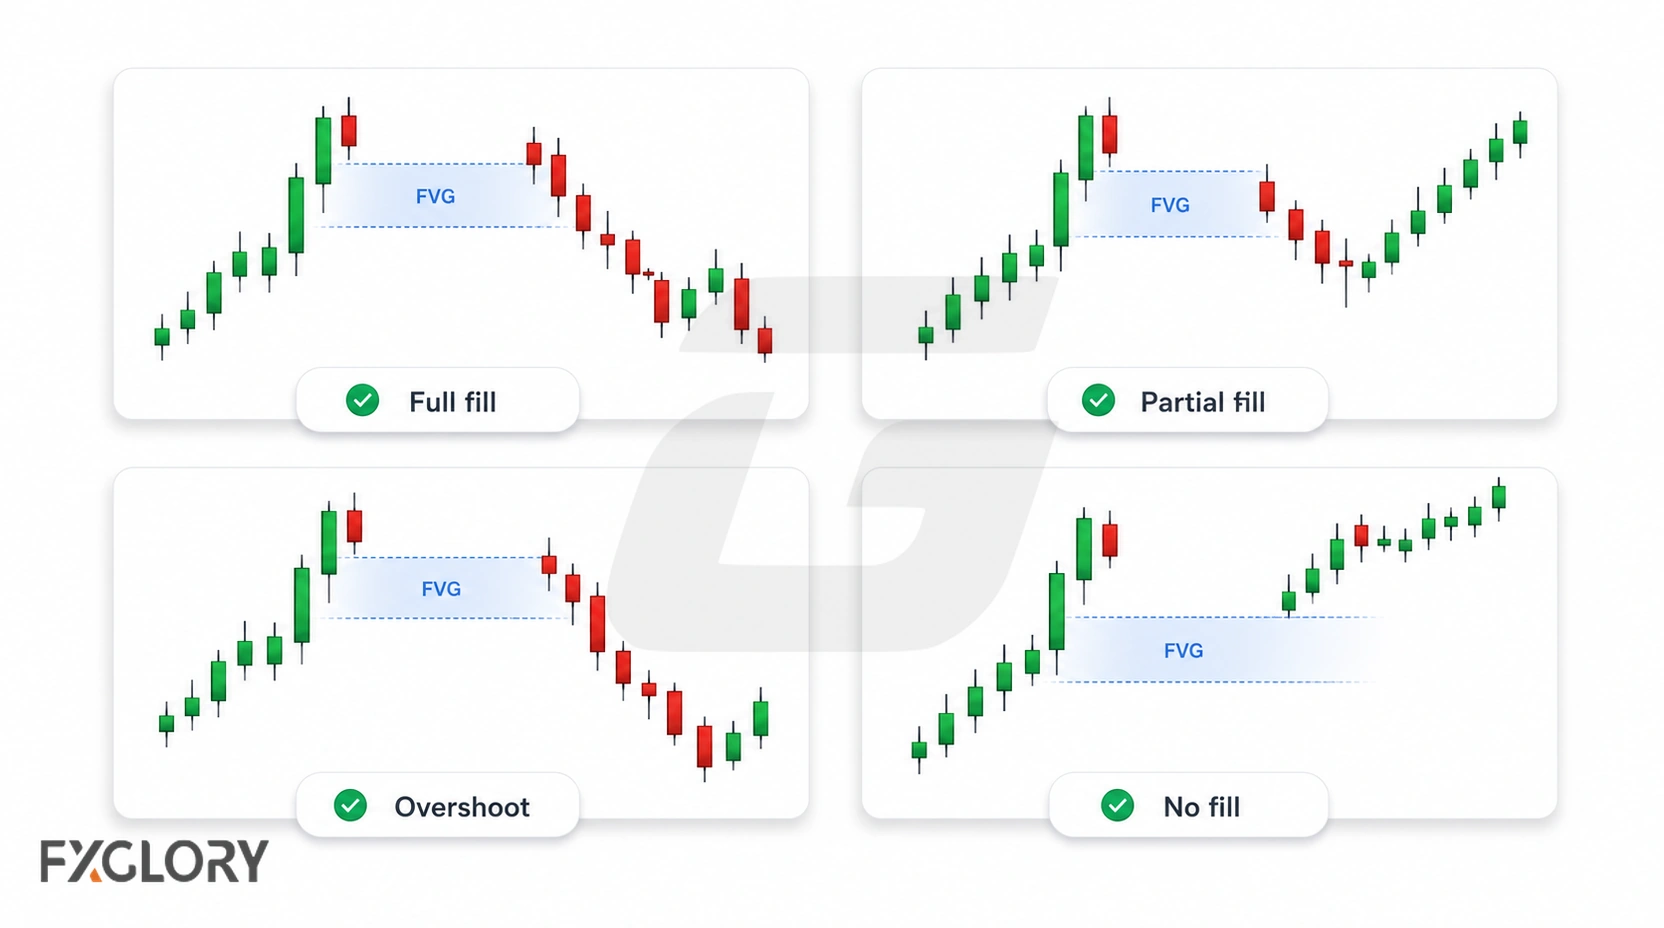
Some traders use the word mitigation when price returns into a prior FVG. Here, that is treated simply as a revisit to the marked zone.
| FVG Outcome | What It Means | Why It Matters |
|---|---|---|
| Full fill | Price returns through the marked FVG area | It does not prove the next direction |
| Partial fill | Price enters only part of the FVG area | The imbalance zone may remain partly open |
| Overshoot | Price moves beyond the marked FVG area | The zone did not contain price |
| No fill | Price does not return to the marked area | The gap may remain open for the period being reviewed |
Inverse Fair Value Gap: What IFVG Means
An inverse fair value gap, often shortened to IFVG, is usually discussed when price moves through a previous FVG and some traders reinterpret that area in the opposite direction.
For example, a bullish FVG that fails and is traded through may later be watched by some traders as a possible bearish reference area. A bearish FVG that fails may later be watched as a possible bullish reference area.
Fair Value Gap Indicators
A fair value gap indicator may automatically mark possible FVG areas on a chart. These tools can save time, but they should not replace manual chart review.
- Detection settings can differ: One indicator may mark zones another indicator ignores.
- Timeframe changes the pattern: A zone visible on one timeframe may not appear the same way on another.
- Chart feed matters: Different candle data can change whether an FVG appears.
- Automation is only detection: A marked zone still has to be interpreted in the surrounding chart context.
How Traders Review a Fair Value Gap
A fair value gap is more useful to review when the surrounding chart explains why the zone matters rather than when it appears as an isolated non-overlap.
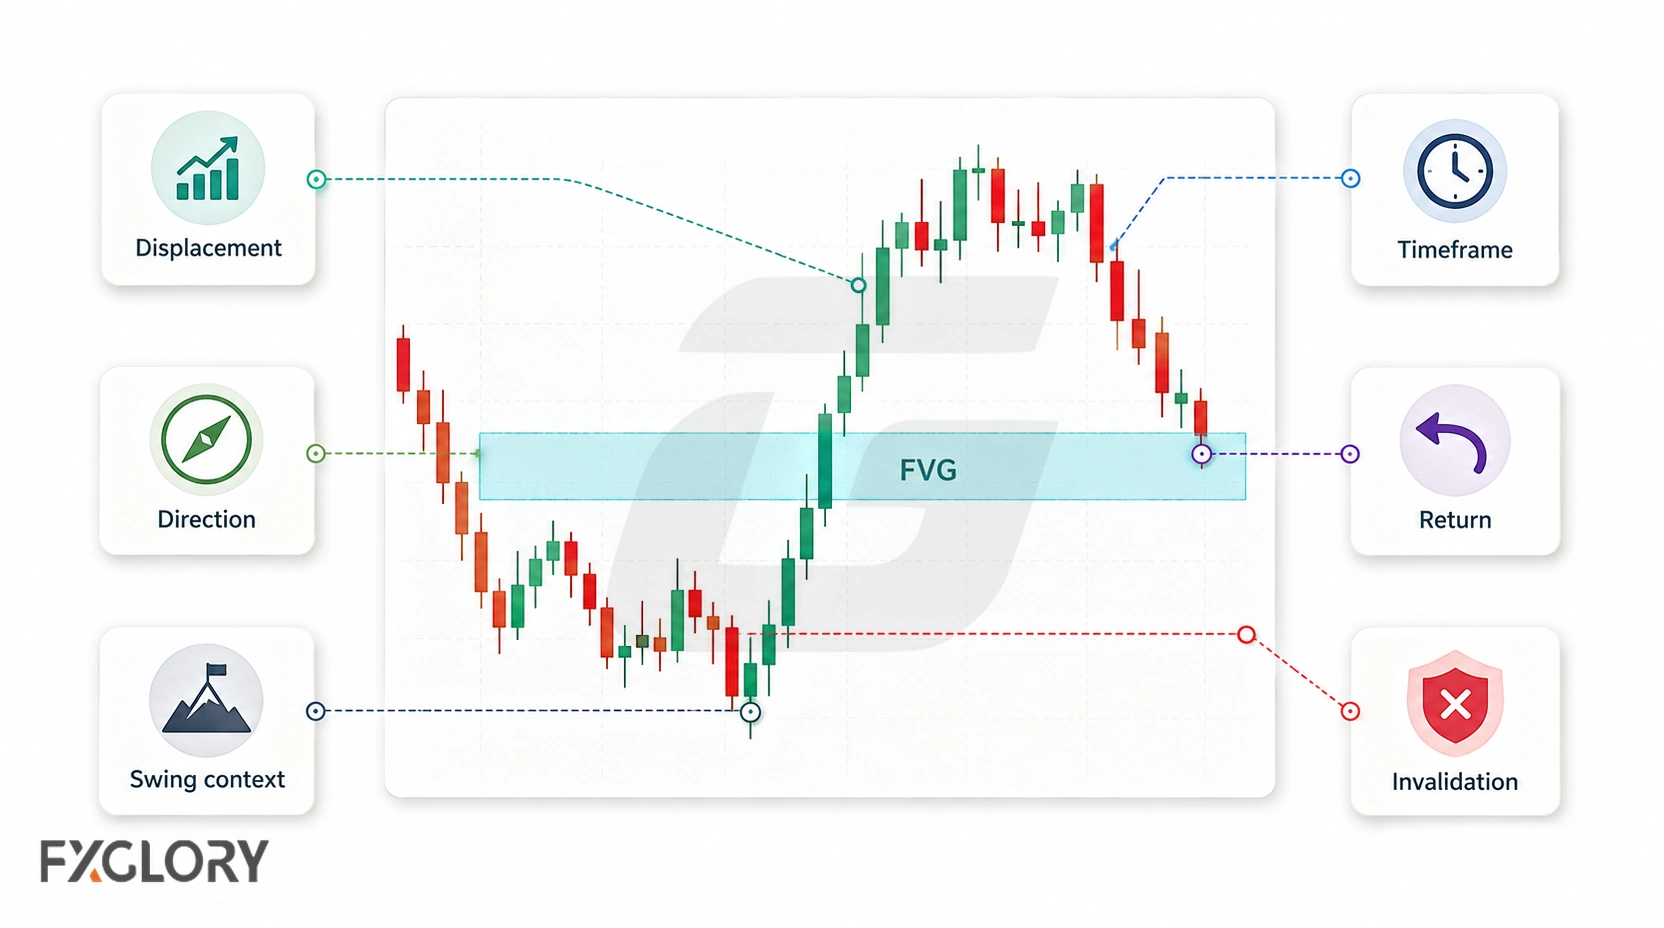
- Start with displacement: Was the FVG created by a clear fast move or by choppy candles?
- Check direction around the displacement: Was the broader chart moving upward, downward, sideways, or unclear? For this layer, review the direction around the displacement.
- Check swing context: Did the FVG appear near a meaningful swing area, or inside random noise? For that layer, use the swing context around the imbalance.
- Check the timeframe: A small FVG on a low timeframe may disappear or become less important in broader context.
- Observe a revisit: If price returns to the zone, note whether it pauses, rejects, trades through, or shows no clear response.
- Define invalidation: Decide what chart development would make the FVG idea no longer useful.
When an FVG Is Not Clear Enough
Some marked FVGs are difficult to interpret because the surrounding price action is ambiguous.
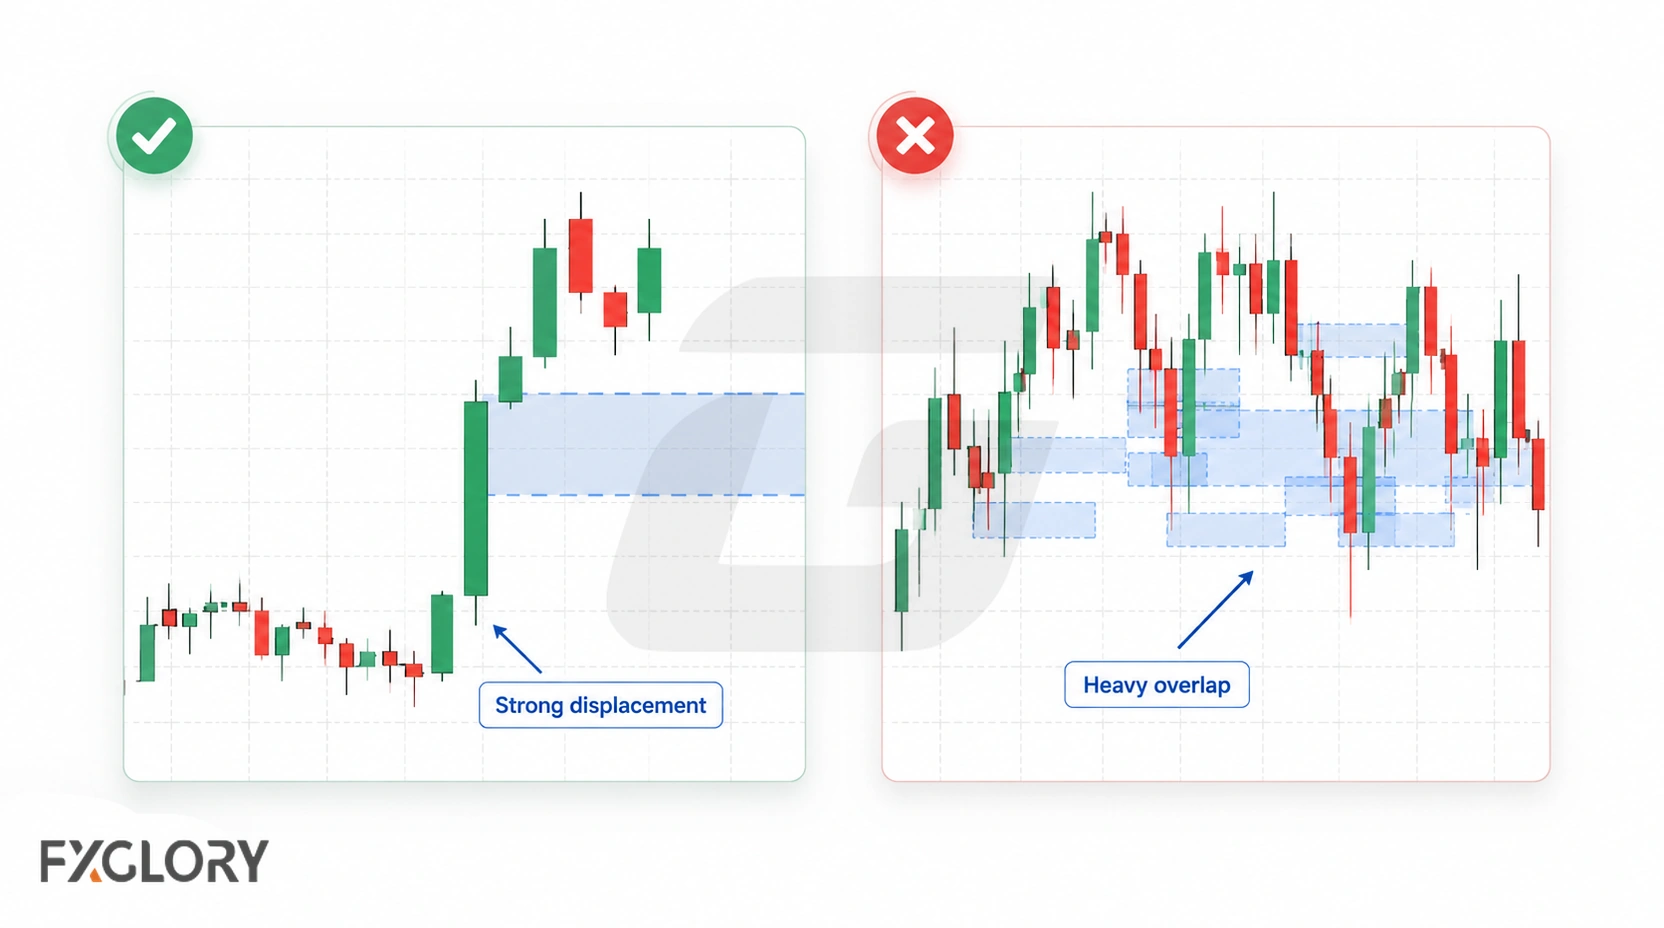
- Weak displacement: The middle candle does not show a clear strong move.
- Messy surrounding candles: Heavy overlap makes the boundaries or context difficult to read.
- Conflicting structure: The marked FVG points one way while broader price action is unclear or moving differently.
- Chart-feed difference: The FVG appears on one feed but not another.
- News spike: A sudden event creates an unusually sharp move that may be difficult to interpret from chart structure alone.
Common Mistakes With Fair Value Gaps
- Assuming every FVG must fill: A revisit is possible, not required.
- Calling every fast candle an FVG: The three-candle structure still matters.
- Confusing an FVG with a regular forex gap: They describe different chart structures.
- Overtrusting automated markings: Different indicators, timeframes, and feeds can mark different zones.
Example: Fair Value Gap on BTC/USD
Suppose BTC/USD moves sharply upward on the timeframe being studied. In a three-candle sequence, the third candle’s low remains above the first candle’s high, leaving a visible non-overlapped area.
That area can be marked as a bullish FVG. The next step is to review how the zone sits within the broader direction and swing structure, then observe what price does if it returns.