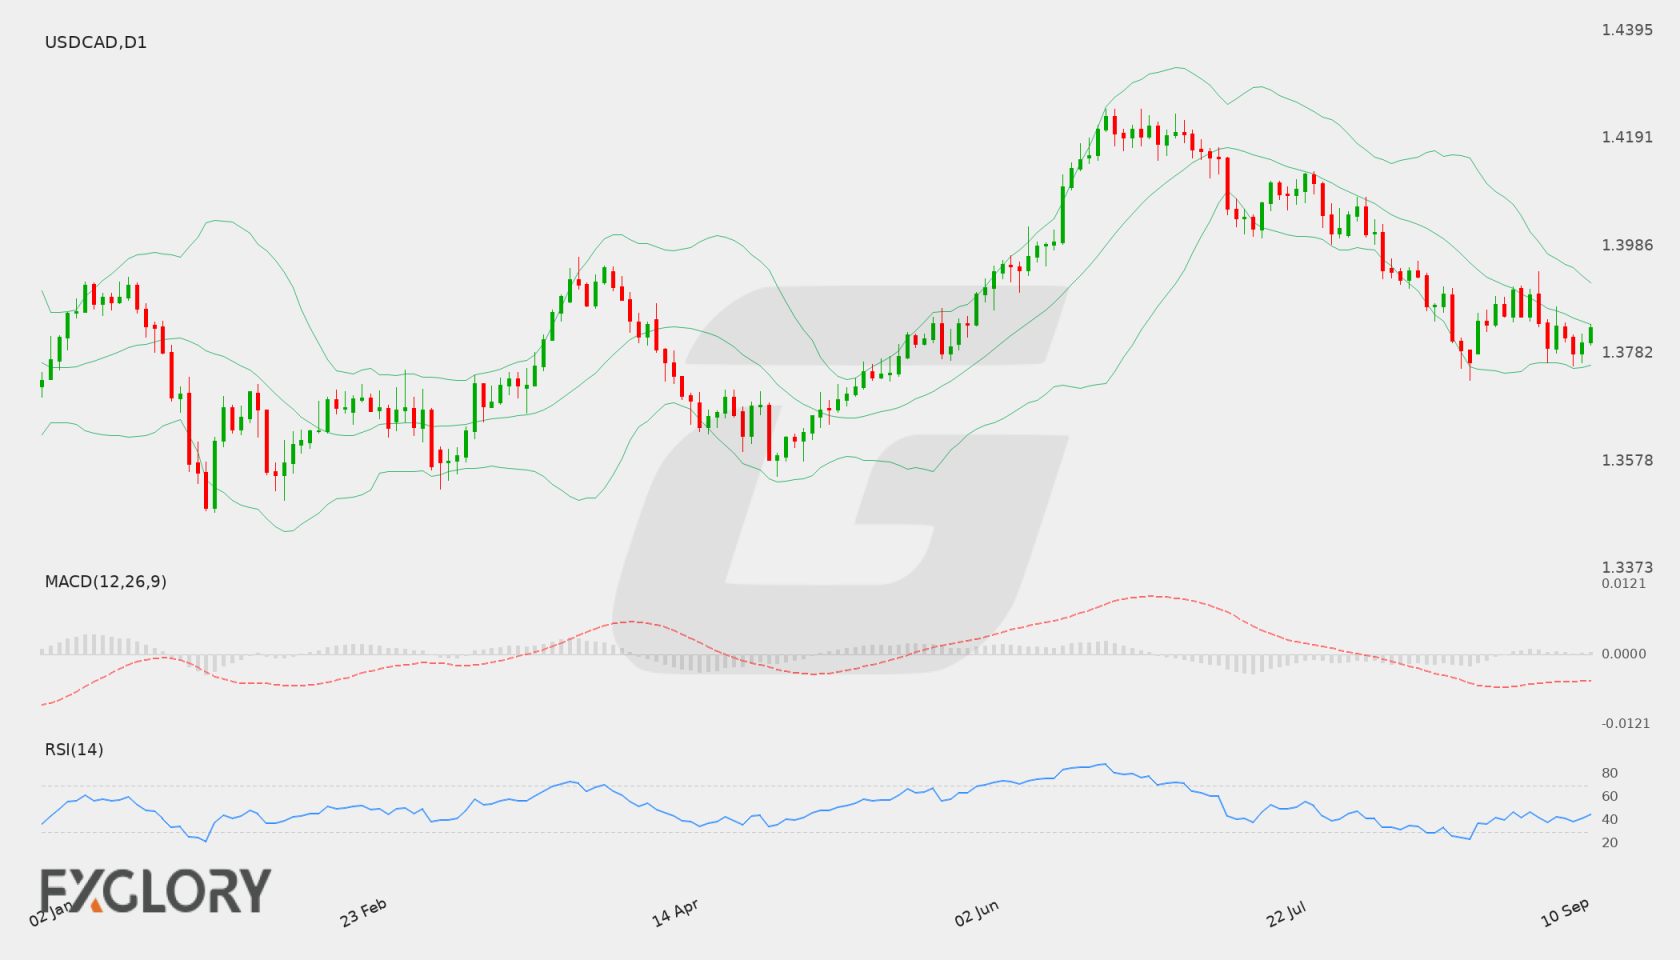
Current weekly forecast: This outlook covers 18–24 October 2026 and remains valid until 24 October 2026, unless its stated invalidation condition is triggered earlier.
In brief
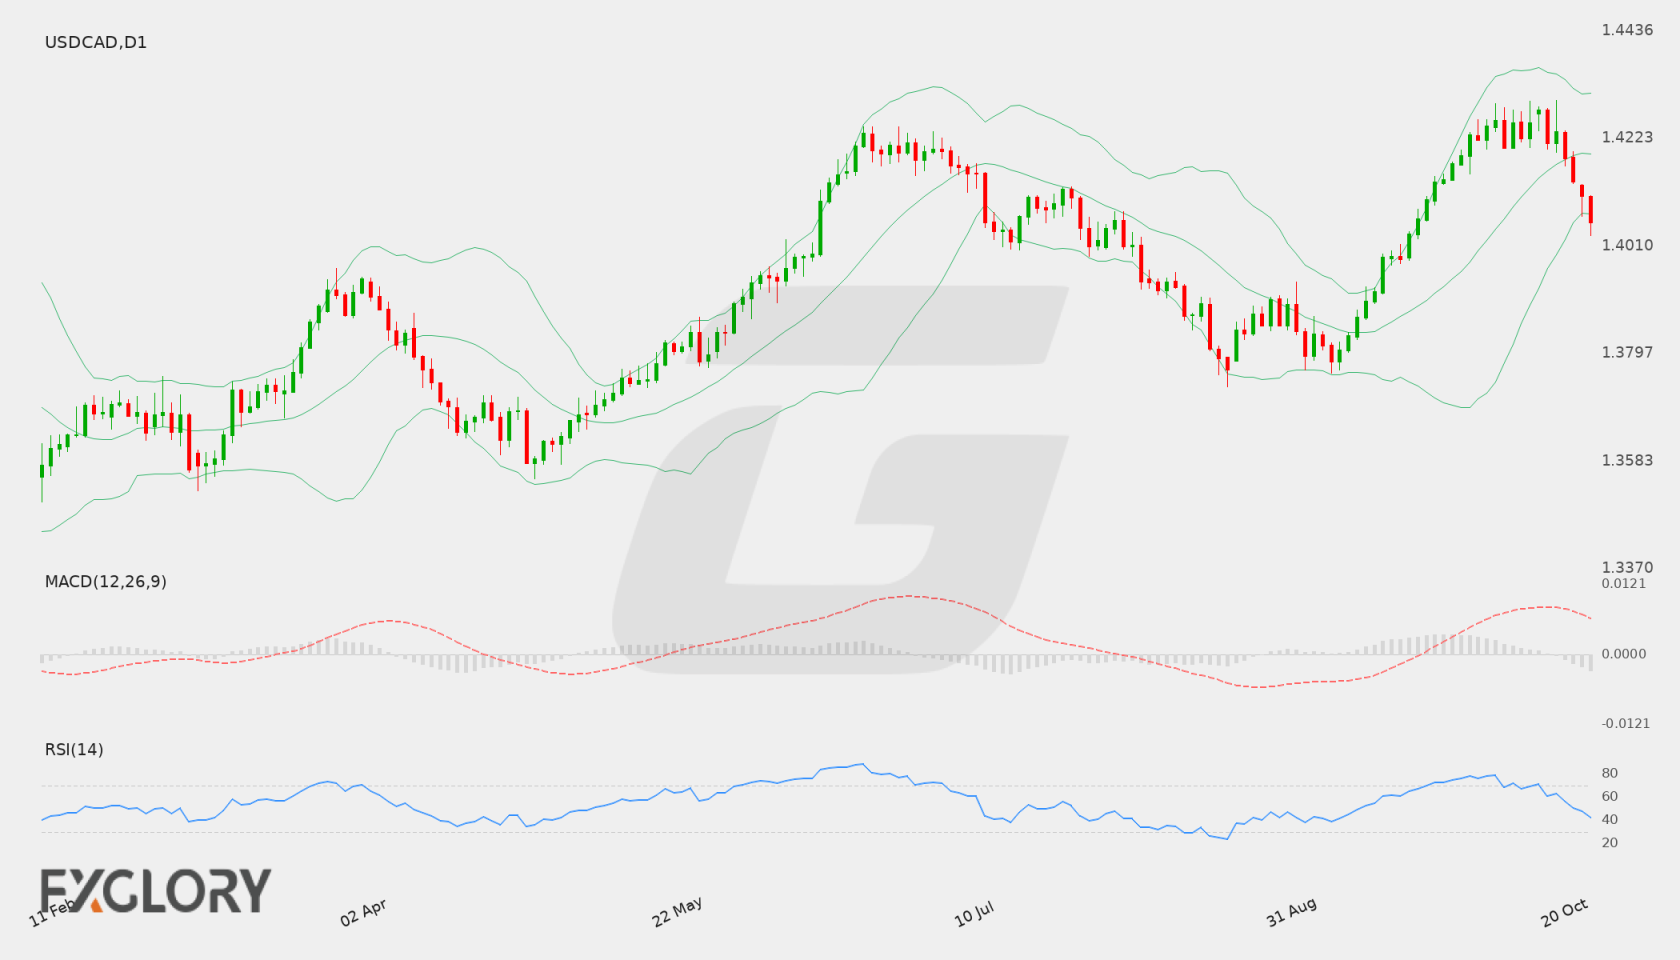
The weekly bias is neutral: consecutive lower D1 closes and negative momentum lean lower, but rising longer-term moving-average slopes and a neutral D1 trend state leave the broader direction unresolved.
The D1 close at 1.40574 is below the listed primary support at 1.40014? No: it is above that level, while remaining below primary resistance at 1.41095. Consecutive lower closes and negative MACD momentum weigh on the near-term structure, but the neutral D1 trend state and rising EMA50 and SMA200 slopes argue against treating that pressure as a settled weekly trend.
H4 is bearish, with its close below both supplied H4 moving averages and its RSI weak, reinforcing near-term downside pressure rather than resolving the D1 ambiguity. Stable volatility offers no directional signal. Canadian CPI releases on 19 Oct 2026 15:30 GMT+3 and US releases later in the week may prompt repricing around the existing levels.
USD/CAD D1 technical-analysis context for the weekly forecast. Chart data captured 21 October 2026.
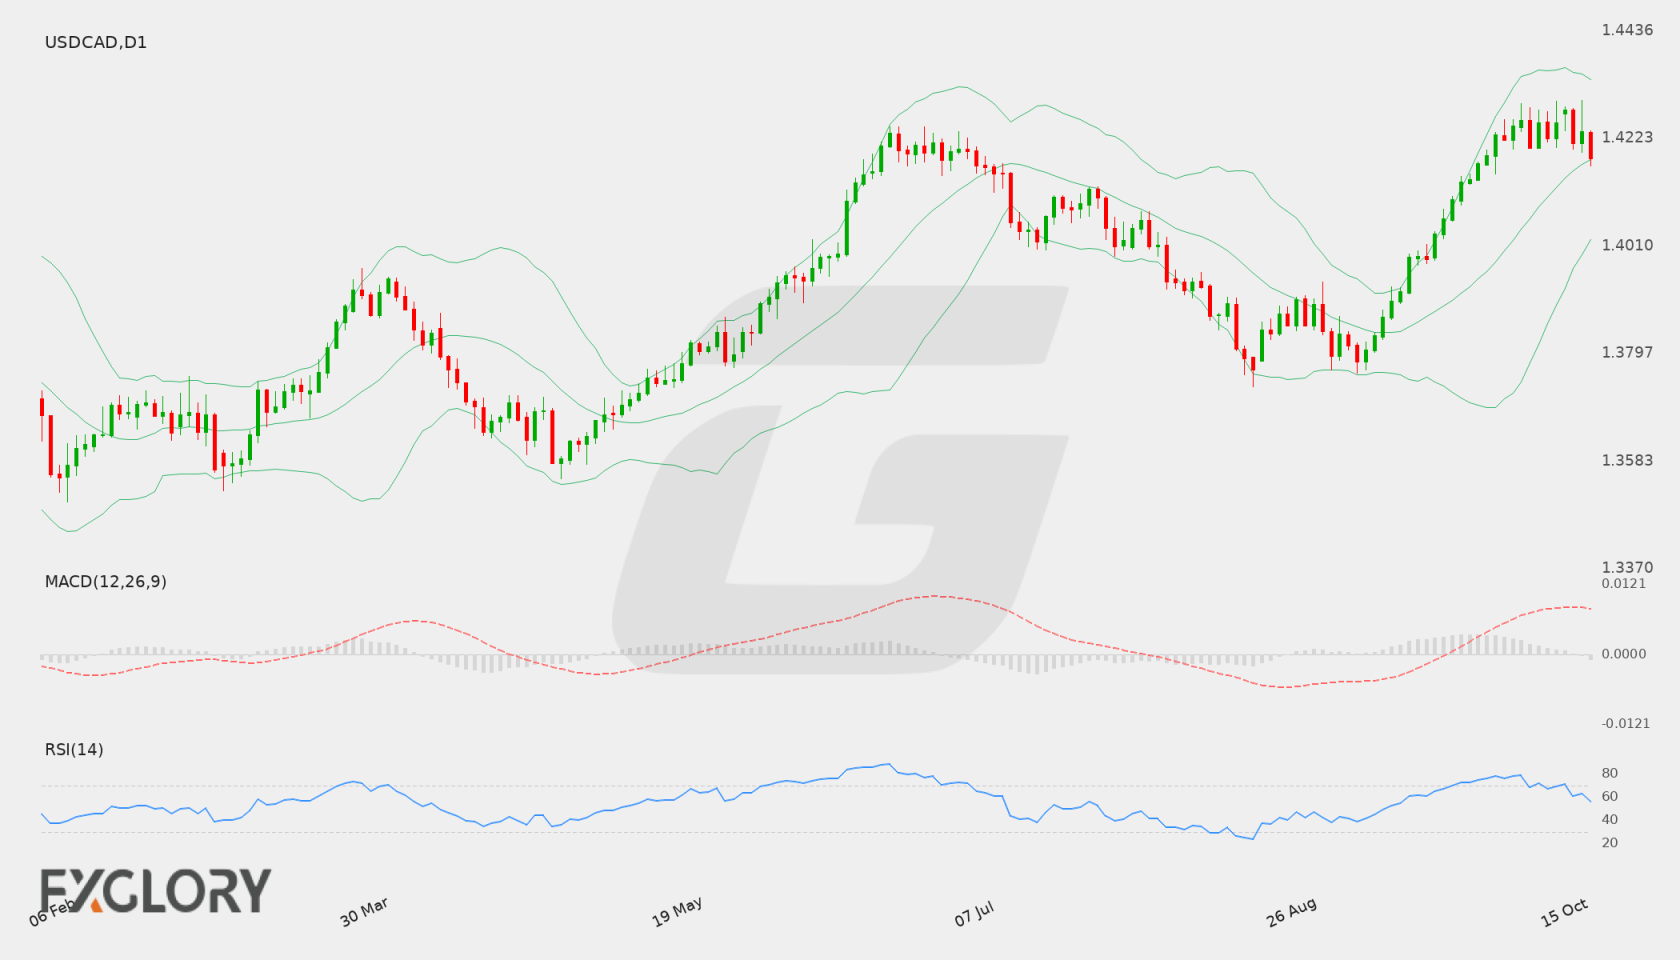
The weekly bias is Bullish, supported by positive D1 momentum and bullish H4 context, but the mixed D1 close sequence keeps resistance and downside structure important.
USD/CAD is assessed with a bullish weekly bias because the D1 trend state is bullish, momentum is positive, and both the EMA50 and SMA200 slopes are rising. The reference D1 close at 1.42537 is above the primary support at 1.42042 and below the primary resistance at 1.42917, leaving the forecast focused on how price resolves that area.
The bullish case would gain technical relevance if D1 price action develops through the resistance framework toward the permitted bullish target at 1.43587. H4 currently supports the direction, but its narrower tactical structure and the mixed D1 close sequence mean that a move toward 1.41673 or 1.41252 remains a credible countertrend path if support gives way.
USD/CAD D1 technical-analysis context for the weekly forecast. Chart data captured 16 October 2026.
USD/CAD dynamics continue to be steered by shifting macroeconomic expectations and economic data releases across North America. Comparative growth metrics, labor market developments, and central bank commentary from both the United States and Canada remain crucial in determining the relative strength of the two currencies, alongside broader market sentiment.
Price Action:
On the daily timeframe, USD/CAD has maintained a strong upward trajectory, rising steadily from previous lows to a recent close of 1.42197. The series of consecutive higher daily closes illustrates firm bullish momentum as price action approaches the overhead resistance barrier at 1.42607.
Key Technical Indicators:
Bollinger Bands: Bollinger Bands indicators show USD/CAD trading near the upper band at 1.42934, well above the middle band baseline of 1.39996. The lower band is situated at 1.37058, and the widening band structure highlights an expansion in daily market volatility accompanying the recent price climb.
RSI: The 14-period Relative Strength Index (RSI) is positioned at 76.06, placing USD/CAD firmly within overbought parameters above the standard 70 benchmark. While this confirms the strength of the ongoing rally, it also indicates elevated potential for a period of price consolidation or a corrective pullback.
MACD: The daily MACD line registers at 0.00828, holding in positive territory and reflecting active upward momentum for USDCAD. This positive alignment suggests buyers have remained in control, although traders will watch for any signs of deceleration in momentum.
Support and Resistance:
Immediate daily resistance is identified at 1.42607, slightly below the upper Bollinger Band. On the downside, major daily support is established at 1.37302, with the middle Bollinger Band at 1.39996 serving as a potential intermediate dynamic support level.
News to Watch for USDCAD This Week:
ISM Services PMI: Measures activity in the US service sector and can alter expectations for economic resilience.
The technical structure for USD/CAD remains constructive, supported by a positive daily MACD reading and strong upward price action toward the 1.42197 close. However, with the daily RSI extended at 76.06, the pair faces overbought headwinds as it challenges the 1.42607 resistance level and upper Bollinger Band at 1.42934. A breakout above this barrier could signal a continuation of the uptrend, while rejection at resistance may prompt a consolidation phase back toward the 1.39996 middle band or key support at 1.37302.
Disclaimer: The analysis provided for USD/CAD is for informational purposes only and does not constitute investment advice. Traders are encouraged to perform their own analysis and research before making any trading decisions. Market conditions can change quickly, so staying informed with the latest data is essential.
Economic conditions for USD/CAD are driven by upcoming macroeconomic developments in both Canada and the United States. Key growth readings from Canada alongside US inflation, manufacturing, and labor market metrics will play a pivotal role in dictating the direction of USDCAD.
Price Action:
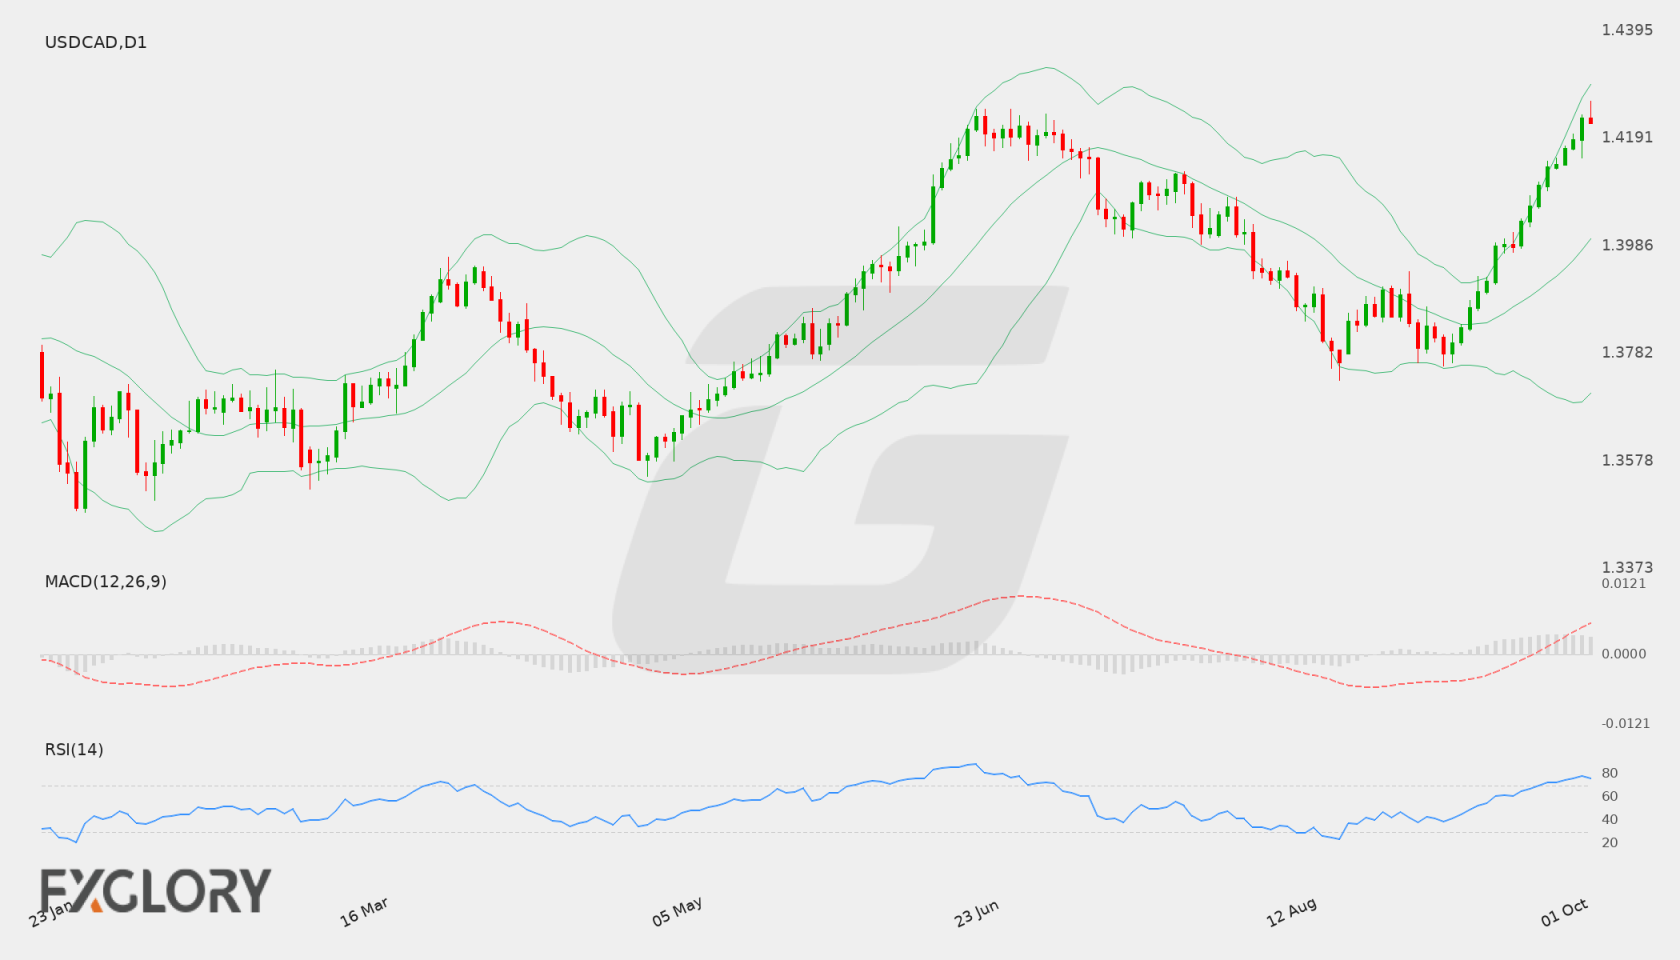
USD/CAD has recently demonstrated bullish momentum, climbing from the 1.37817 level to a close of 1.39889. The daily chart displays a succession of higher daily highs and higher daily closes, reflecting sustained buying interest over recent trading sessions.
Key Technical Indicators:
Bollinger Bands: The Daily Bollinger Bands show a middle line at 1.38590, a lower band at 1.37416, and an upper band at 1.39763. With the last close at 1.39889 pushing slightly above the upper band, the pair indicates elevated momentum while nearing potential short-term stretched conditions.
RSI: The 14-day Relative Strength Index (RSI) is currently at 61.12. This places the indicator above the neutral 50 level, supporting positive upward momentum without reaching overbought territory.
MACD: The MACD line stands at 0.000108, remaining in positive territory. This indicates moderate bullish momentum for USDCAD as buyers retain control over recent price action.
Support and Resistance:
Key technical levels for USD/CAD include primary daily support at 1.37302 and main overhead resistance at 1.42456. Intermediate technical support also aligns near the middle Bollinger Band at 1.38590.
News to Watch for USDCAD This Week:
GDP m/m: Measures Canadian economic growth which directly impacts domestic currency valuation.
CB Consumer Confidence: Reflects US consumer sentiment and potential household spending activity.
JOLTS Job Openings: Highlights labor market tightness and job demand in the United States.
ADP Non-Farm Employment Change: Offers an early look at private-sector employment growth in the US.
Core PCE Price Index m/m: Tracks key underlying inflation trends closely monitored by US monetary authorities.
Final GDP q/q: Signals overall broad-based economic growth output for the US economy.
ISM Manufacturing PMI: Assesses activity and conditions across the US manufacturing sector.
Average Hourly Earnings m/m: Evaluates wage growth pressures that influence US inflation prospects.
Non-Farm Employment Change: Measures headline net job creation and frequently drives US dollar volatility.
Unemployment Rate: Provides the percentage of the active workforce that is unemployed, signaling broader economic health.
Weekly Outlook and Consideration:
USD/CAD enters the week displaying positive technical momentum, supported by an RSI of 61.12 and a positive MACD value of 0.000108. Price action has closed at 1.39889, slightly above the upper Bollinger Band of 1.39763. If buyers hold prices above the middle band at 1.38590, the pair may attempt a move toward resistance at 1.42456. However, if sellers force a pullback, technical support at 1.37302 remains a key reference level. High-impact US labor and inflation data alongside Canadian GDP figures will likely drive volatility.
Disclaimer: The analysis provided for USD/CAD is for informational purposes only and does not constitute investment advice. Traders are encouraged to perform their own analysis and research before making any trading decisions. Market conditions can change quickly, so staying informed with the latest data is essential.
The USD/CAD pair faces potential volatility driven by critical economic updates from both Canada and the United States. Canadian inflation data, including various CPI metrics, will offer insight into the Bank of Canada’s monetary policy trajectory. Meanwhile, major US indicators such as retail sales data and the upcoming FOMC rate decision, policy statement, and press conference are expected to influence US Dollar sentiment and overall market direction.
Price Action:
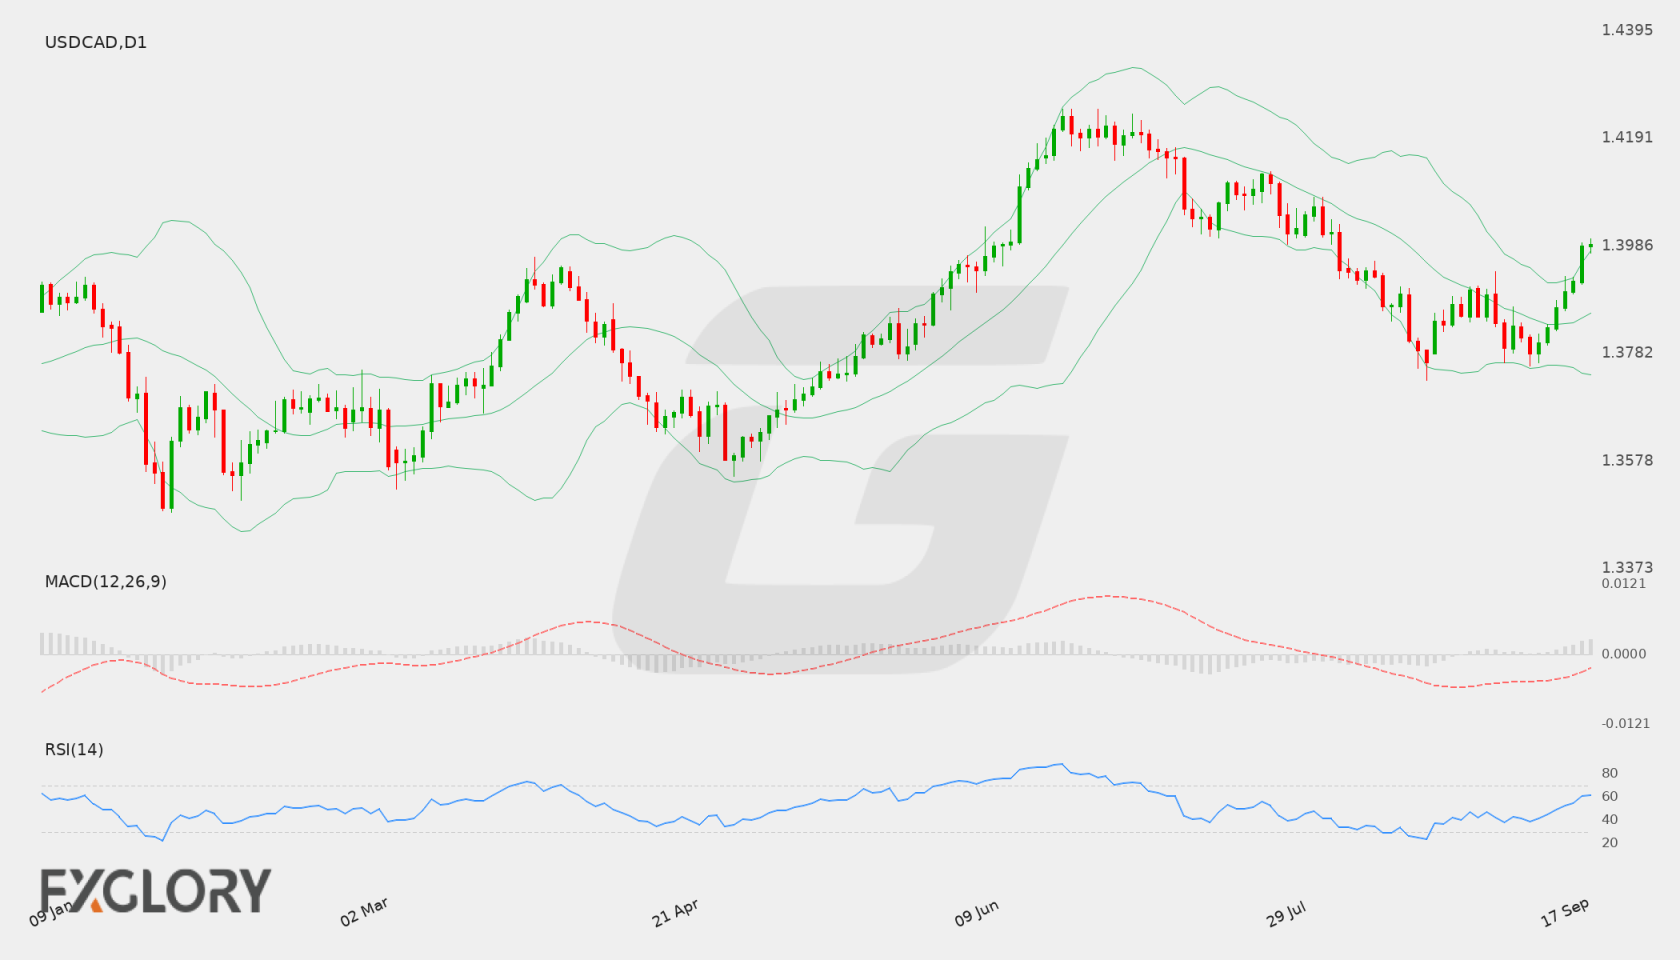
On the daily D1 chart, USD/CAD recently closed at 1.3831, consolidating after a brief bounce from lower levels near 1.37817. Price action reflects a neutral stance, balancing between recent swing lows and overhead supply areas.
Key Technical Indicators:
Bollinger Bands: The daily Bollinger Bands show a middle band at 1.383753, placing the latest close of 1.3831 right near the center of the indicator. The lower band is situated at 1.375915, while the upper band rests at 1.391591, defining the current short-term range.
RSI: The 14-period Relative Strength Index (RSI) stands at 44.78, remaining in neutral territory below the 50 midpoint and indicating moderate underlying market momentum.
MACD: The MACD indicator registers a reading of -0.004167, maintaining a negative value that highlights ongoing mild bearish momentum, though histogram bars suggest steady consolidation.
Support and Resistance:
Key technical levels for USD/CAD include strong support at 1.37302 and major resistance at 1.42463 based on recent daily swing levels.
News to Watch for USDCAD This Week:
Trimmed CPI y/y: Updates on underlying Canadian core inflation could impact Bank of Canada policy expectations.
Median CPI y/y: Measures key price trends in Canada that may influence the Canadian Dollar.
Common CPI y/y: Provides additional perspective on Canadian underlying inflationary pressures.
Core Retail Sales m/m: Evaluates US consumer spending trends excluding volatile items to gauge economic strength.
Retail Sales m/m: Reflects overall US consumer activity and potential demand conditions.
FOMC Economic Projections: Offers updated Federal Reserve expectations for interest rates and economic growth.
FOMC Statement: Delivers critical insights into Federal Reserve policy decisions and economic views.
Federal Funds Rate: Sets the benchmark US interest rate and directly influences the US Dollar.
FOMC Press Conference: Features remarks from Fed leadership clarifying monetary policy direction.
Weekly Outlook and Consideration:
USD/CAD enters the week hovering near its daily Bollinger middle band of 1.383753 with a recent close of 1.3831. Indicators reflect balanced market conditions, as seen in the neutral RSI of 44.78 and a slightly negative MACD of -0.004167. Price action remains bounded between technical support at 1.37302 and resistance at 1.42463. Upcoming high-impact releases, particularly Canadian CPI readings and the FOMC policy announcement, are likely to dictate the pair’s next directional movement.
Disclaimer: The analysis provided for USD/CAD is for informational purposes only and does not constitute investment advice. Traders are encouraged to perform their own analysis and research before making any trading decisions. Market conditions can change quickly, so staying informed with the latest data is essential.