Time Zone: GMT +3
Time Frame: Daily (D1) / Weekly Outlook
Weekly Fundamental Overview:
The USD/CAD pair faces an active trading environment shaped by key economic metrics from both Canada and the United States. Canadian inflation measurements will be central to assessing potential Bank of Canada policy shifts, while US labor market updates and Federal Reserve documentation are set to influence broader sentiment around the US dollar. Drivers such as energy market fluctuations and macroeconomic updates continue to anchor medium-term market dynamics for USDCAD.
Price Action:
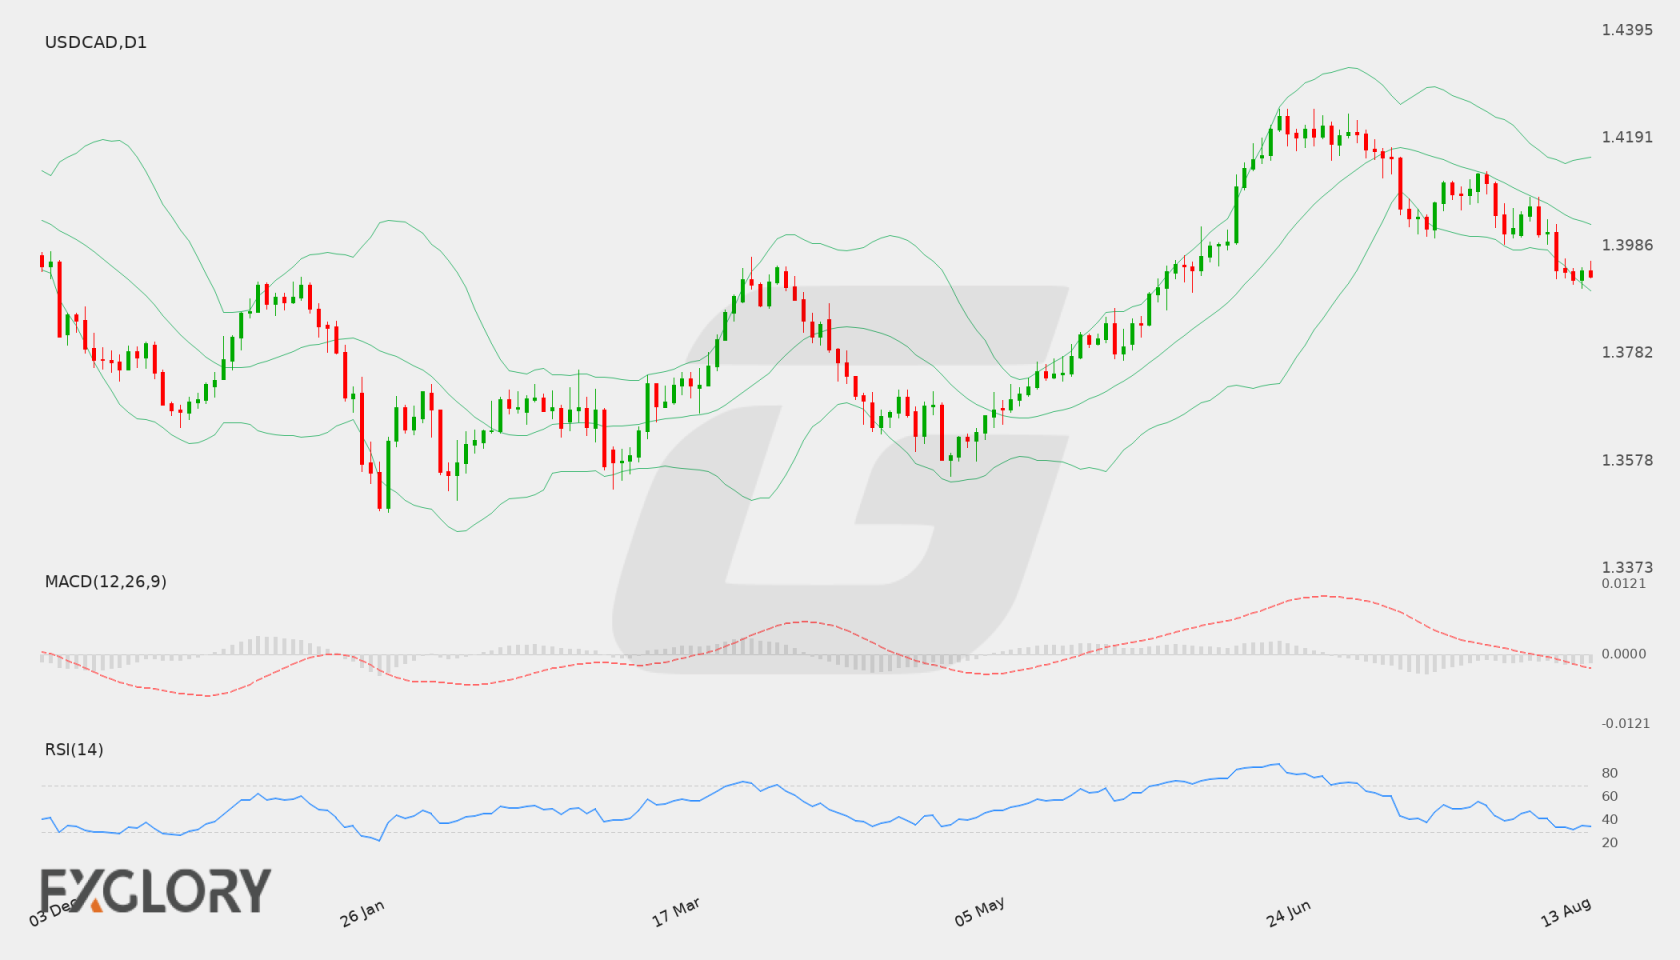
On the Daily (D1) timeframe, USD/CAD has experienced a steady downward drift over recent sessions, declining from levels above 1.4100 down to the latest close at 1.3929. The pair continues to print lower daily highs and lower daily lows, highlighting sustained selling pressure toward key downside zones.
Key Technical Indicators:
Bollinger Bands: The daily Bollinger Bands show a middle band at 1.40277, an upper band at 1.41547, and a lower band at 1.39006. With the last close at 1.39290, USD/CAD is hovering near the lower boundary of the channel, signaling elevated downside volatility and pressure on support limits.
RSI: The 14-day Relative Strength Index (RSI) stands at 34.21. Operating in lower territory above the oversold boundary of 30, it indicates persistent seller dominance while leaving room for potential consolidation if selling pressure abates.
MACD: The MACD indicator prints a negative reading of -0.00396. Positioned beneath the signal line and zero axis, this indicator reinforces the prevailing bearish momentum visible across recent daily candles.
Support and Resistance:
Key technical levels on the daily chart display firm support at 1.37684, which serves as a notable downside pivot. On the upside, major resistance is established at 1.42463, marking a ceiling for potential bullish recoveries.
News to Watch for USDCAD This Week:
- Median CPI y/y: This release offers critical insights into underlying inflation trends in Canada, potentially influencing central bank policy expectations.
- CPI m/m: Headline monthly consumer price changes provide an immediate measure of inflationary momentum affecting the Canadian dollar.
- Trimmed CPI y/y: Core inflation figures help isolate persistent price shifts from volatile components.
- Common CPI y/y: Broad inflation data gives additional depth regarding Canadian price stability and economic capacity.
- Prelim Benchmark Payrolls Revision: Updates to US employment metrics can alter perceptions of historical labor market strength.
- FOMC Meeting Minutes: Detailed insights into Federal Reserve deliberations reveal internal perspectives on interest rate pathways.
- Unemployment Claims: Weekly jobless claims serve as a timely health check on US labor market stability.
- Philly Fed Manufacturing Index: Regional manufacturing indicators reflect operational health and output across US industrial sectors.
Weekly Outlook and Consideration:
The technical outlook for USD/CAD remains tilted to the downside following a series of negative daily closes leading to 1.3929. Price action trades near the lower Bollinger Band at 1.39006, backed by a negative MACD of -0.00396 and an RSI of 34.21. A sustained move lower could see price test major daily support at 1.37684. Conversely, a technical bounce would first need to clear the middle Bollinger Band near 1.40277 before challenging upper resistance at 1.42463. Incoming Canadian inflation reports and US policy insights will likely dictate direction over the coming sessions.
Disclaimer: The analysis provided for USD/CAD is for informational purposes only and does not constitute investment advice. Traders are encouraged to perform their own analysis and research before making any trading decisions. Market conditions can change quickly, so staying informed with the latest data is essential.