Time Zone: GMT +3
Time Frame: Daily (D1) / Weekly Outlook
Weekly Fundamental Overview:
Market sentiment for USD/CAD (USDCAD) continues to be shaped by upcoming economic releases and broader fiscal announcements. Investors and traders are closely evaluating consumer and producer price trends alongside employment metrics to anticipate future central bank policy adjustments.
Price Action:
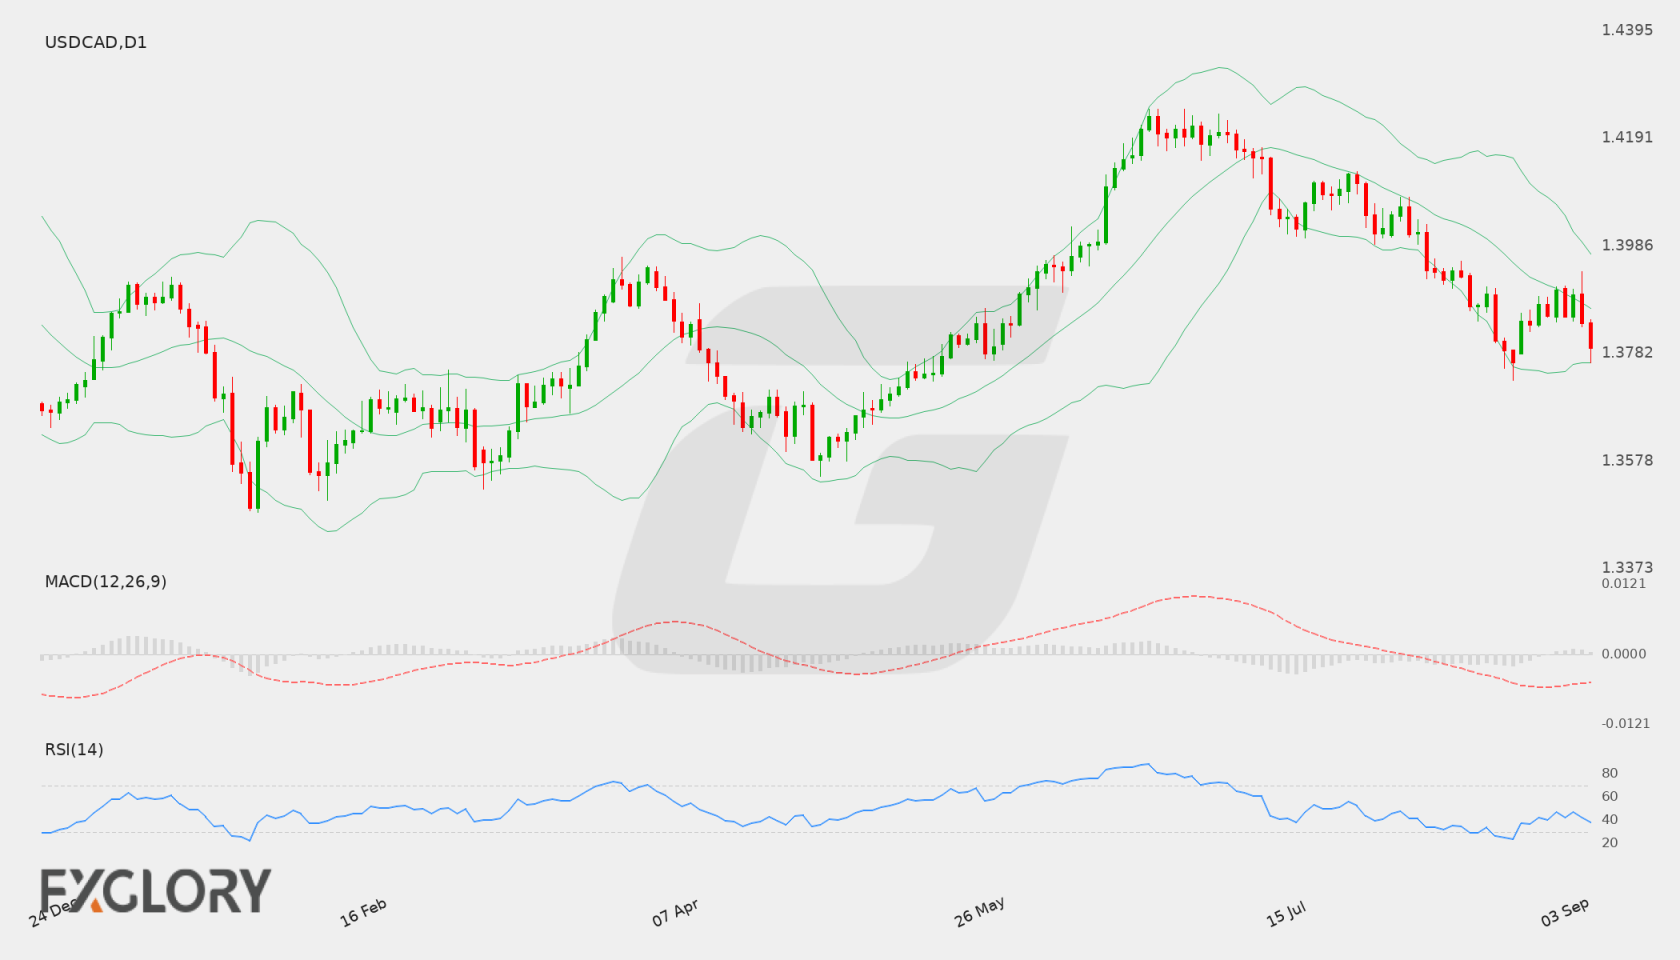
On the Daily (D1) timeframe, USD/CAD (USDCAD) recorded a recent close at 1.37923. The price action reflects a downward push over recent sessions, bringing the pair closer to its key daily support zone while remaining well below recent high swing levels.
Key Technical Indicators:
Bollinger Bands: The Bollinger Bands indicator highlights a middle band at 1.38678, an upper band at 1.39715, and a lower band at 1.37641. USD/CAD is trading near the lower band and below the middle moving average line, pointing to persistent selling pressure in the current setup.
RSI: The 14-day Relative Strength Index (RSI) stands at 37.75. This value places the pair in weaker territory below the 50 neutral mark, approaching oversold conditions without showing an immediate reversal signal.
MACD: The MACD indicator is currently reading -0.00452, lingering below the zero line. This negative territory signals sustained bearish momentum across daily price action for USD/CAD.
Support and Resistance:
For USD/CAD (USDCAD), immediate daily technical support is identified at 1.37302, while major resistance stands overhead at 1.42463.
News to Watch for USDCAD This Week:
- Annual Budget Release: Updates on government fiscal projections can influence overall economic sentiment and local currency demand.
- PPI m/m: Wholesale price shifts offer early signals regarding broader inflationary trends in the supply chain.
- Core PPI m/m: Stripping out volatile factors provides a clearer view of underlying producer price trends.
- Unemployment Claims: Weekly employment trends provide insight into labor market strength and economic activity.
- Core CPI m/m: Essential indicator for measuring core consumer price shifts without food and energy influences.
- CPI y/y: Annual consumer inflation metrics heavily impact central bank rate expectations.
- Core CPI y/y: Reflects long-term consumer inflation stability and dictates broader monetary policy outlooks.
- CPI m/m: Monthly price changes signal short-term shifts in inflation trends.
- Prelim UoM Inflation Expectations: Consumer expectations offer perspective on future economic behavior and price pressures.
Weekly Outlook and Consideration:
USD/CAD (USDCAD) enters the session with a bearish tilt as daily indicators remain subdued. With price hovering around 1.37923, market participants will be observing how price interacts near support at 1.37302 and the lower Bollinger Band at 1.37641. A firm hold around support could allow for a consolidation phase, while an extension of the decline keeps attention on lower levels. Conversely, any rebound will face dynamic resistance near the 1.38678 middle band before approaching major resistance at 1.42463.
Disclaimer: The analysis provided for USD/CAD is for informational purposes only and does not constitute investment advice. Traders are encouraged to perform their own analysis and research before making any trading decisions. Market conditions can change quickly, so staying informed with the latest data is essential.