Time Zone: GMT +3
Time Frame: Daily (D1) / Weekly Outlook
Weekly Fundamental Overview:
Economic conditions for USD/CAD are driven by upcoming macroeconomic developments in both Canada and the United States. Key growth readings from Canada alongside US inflation, manufacturing, and labor market metrics will play a pivotal role in dictating the direction of USDCAD.
Price Action:
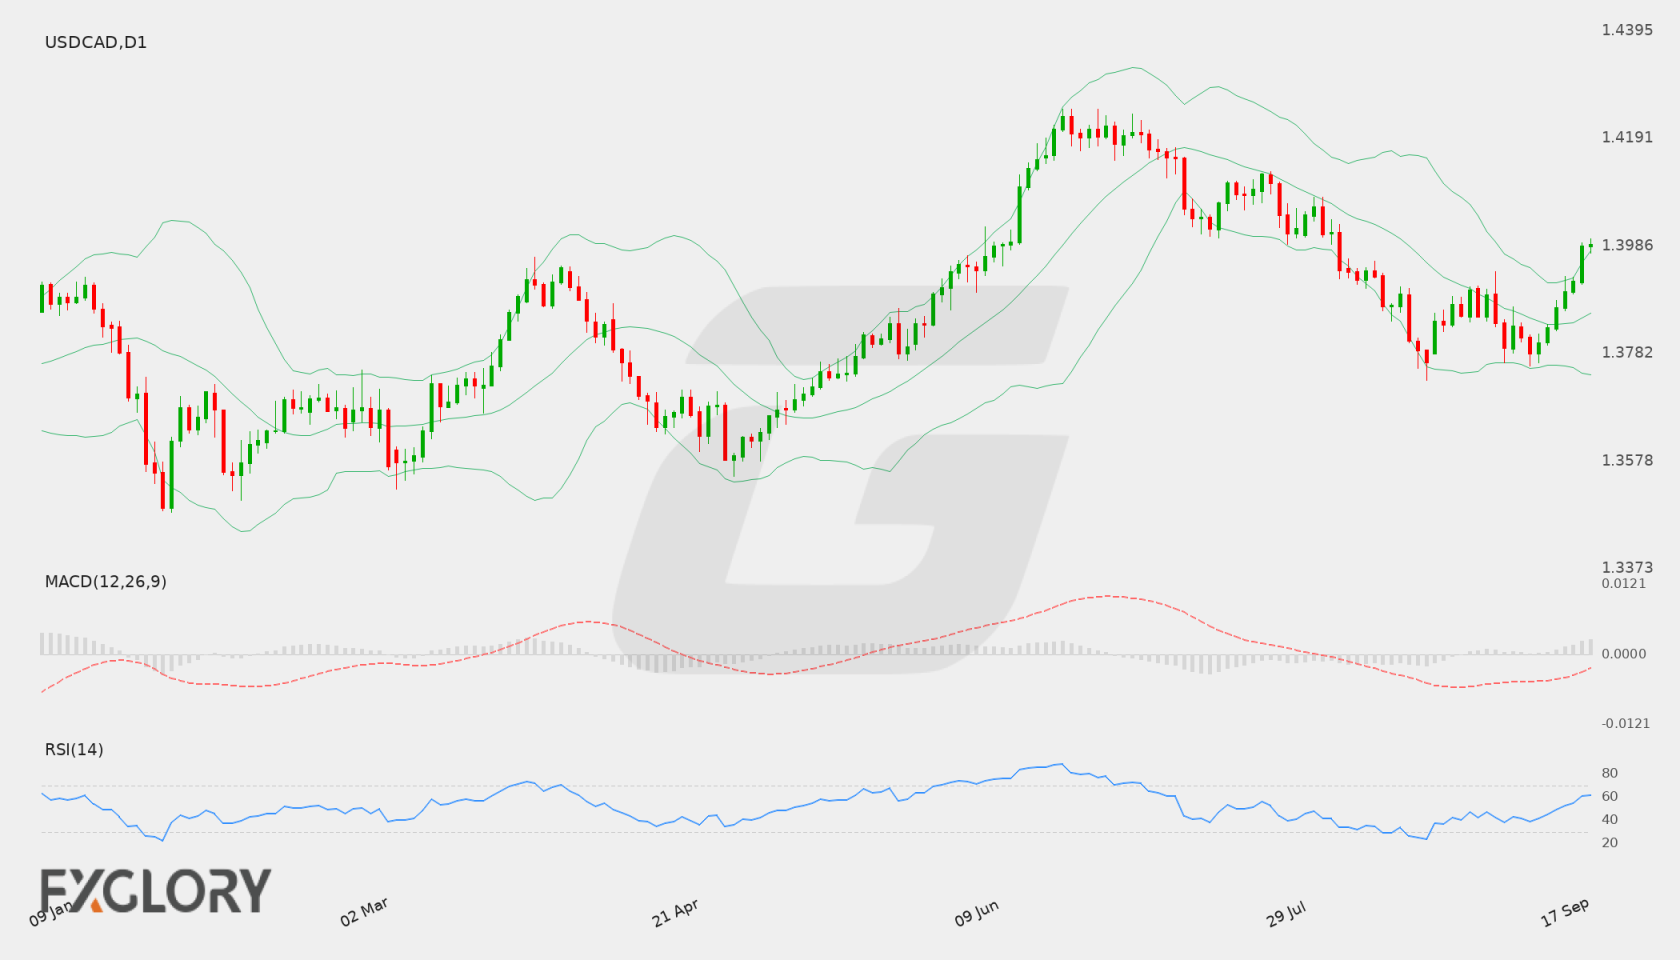
USD/CAD has recently demonstrated bullish momentum, climbing from the 1.37817 level to a close of 1.39889. The daily chart displays a succession of higher daily highs and higher daily closes, reflecting sustained buying interest over recent trading sessions.
Key Technical Indicators:
Bollinger Bands: The Daily Bollinger Bands show a middle line at 1.38590, a lower band at 1.37416, and an upper band at 1.39763. With the last close at 1.39889 pushing slightly above the upper band, the pair indicates elevated momentum while nearing potential short-term stretched conditions.
RSI: The 14-day Relative Strength Index (RSI) is currently at 61.12. This places the indicator above the neutral 50 level, supporting positive upward momentum without reaching overbought territory.
MACD: The MACD line stands at 0.000108, remaining in positive territory. This indicates moderate bullish momentum for USDCAD as buyers retain control over recent price action.
Support and Resistance:
Key technical levels for USD/CAD include primary daily support at 1.37302 and main overhead resistance at 1.42456. Intermediate technical support also aligns near the middle Bollinger Band at 1.38590.
News to Watch for USDCAD This Week:
- GDP m/m: Measures Canadian economic growth which directly impacts domestic currency valuation.
- CB Consumer Confidence: Reflects US consumer sentiment and potential household spending activity.
- JOLTS Job Openings: Highlights labor market tightness and job demand in the United States.
- ADP Non-Farm Employment Change: Offers an early look at private-sector employment growth in the US.
- Core PCE Price Index m/m: Tracks key underlying inflation trends closely monitored by US monetary authorities.
- Final GDP q/q: Signals overall broad-based economic growth output for the US economy.
- ISM Manufacturing PMI: Assesses activity and conditions across the US manufacturing sector.
- Average Hourly Earnings m/m: Evaluates wage growth pressures that influence US inflation prospects.
- Non-Farm Employment Change: Measures headline net job creation and frequently drives US dollar volatility.
- Unemployment Rate: Provides the percentage of the active workforce that is unemployed, signaling broader economic health.
Weekly Outlook and Consideration:
USD/CAD enters the week displaying positive technical momentum, supported by an RSI of 61.12 and a positive MACD value of 0.000108. Price action has closed at 1.39889, slightly above the upper Bollinger Band of 1.39763. If buyers hold prices above the middle band at 1.38590, the pair may attempt a move toward resistance at 1.42456. However, if sellers force a pullback, technical support at 1.37302 remains a key reference level. High-impact US labor and inflation data alongside Canadian GDP figures will likely drive volatility.
Disclaimer: The analysis provided for USD/CAD is for informational purposes only and does not constitute investment advice. Traders are encouraged to perform their own analysis and research before making any trading decisions. Market conditions can change quickly, so staying informed with the latest data is essential.