Current weekly forecast: This outlook covers 11–17 October 2026 and remains valid until 17 October 2026, unless its stated invalidation condition is triggered earlier.
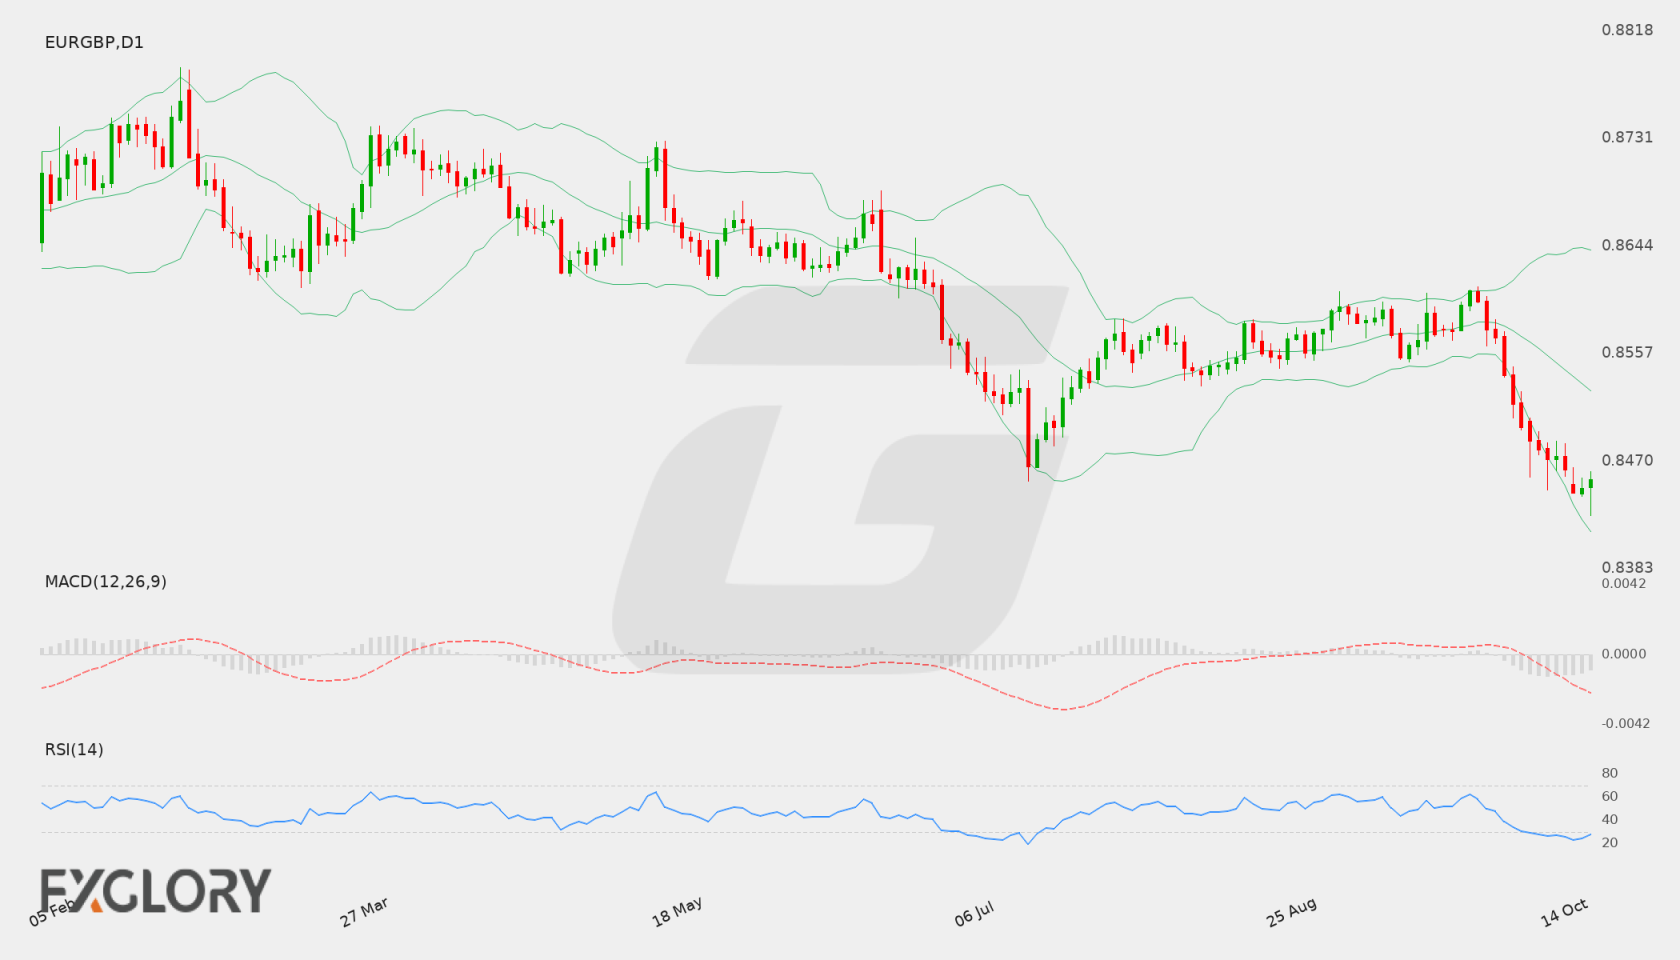
Daily check — 15 October 2026: The latest completed D1 close was 0.84554 on 14 October 2026. It remains below the upper formal invalidation level 0.85134; the lower calibrated boundary 0.84467 is an extension/confirmation boundary. The authored weekly thesis remains valid.
In brief
The weekly bias is Bearish, led by negative D1 momentum and bearish H4 structure, although mixed D1 closes and oversold RSI leave room for consolidation.
EUR/GBP enters the week with a D1 close of 0.84739, below the D1 EMA20 at 0.8535, EMA50 at 0.85562 and SMA200 at 0.86284. The bearish D1 trend state, falling EMA50 and SMA200 slopes, and negative MACD structure create a consistent directional backdrop. The close remains above the listed support at 0.84571, so the downside thesis is active but not yet expressed as a break of that level.
H4 is also classified as bearish, with its close at 0.8459 below the H4 EMA20 at 0.84768 and EMA50 at 0.85002. However, H4 MACD histogram is positive at 0.000149 and RSI is 33.4, while the D1 RSI is 27.11, creating a tactical counterweight to the broader D1 pressure. That combination favors conditional downside analysis with consolidation risk around 0.84571 and 0.85134 rather than a one-way assumption.
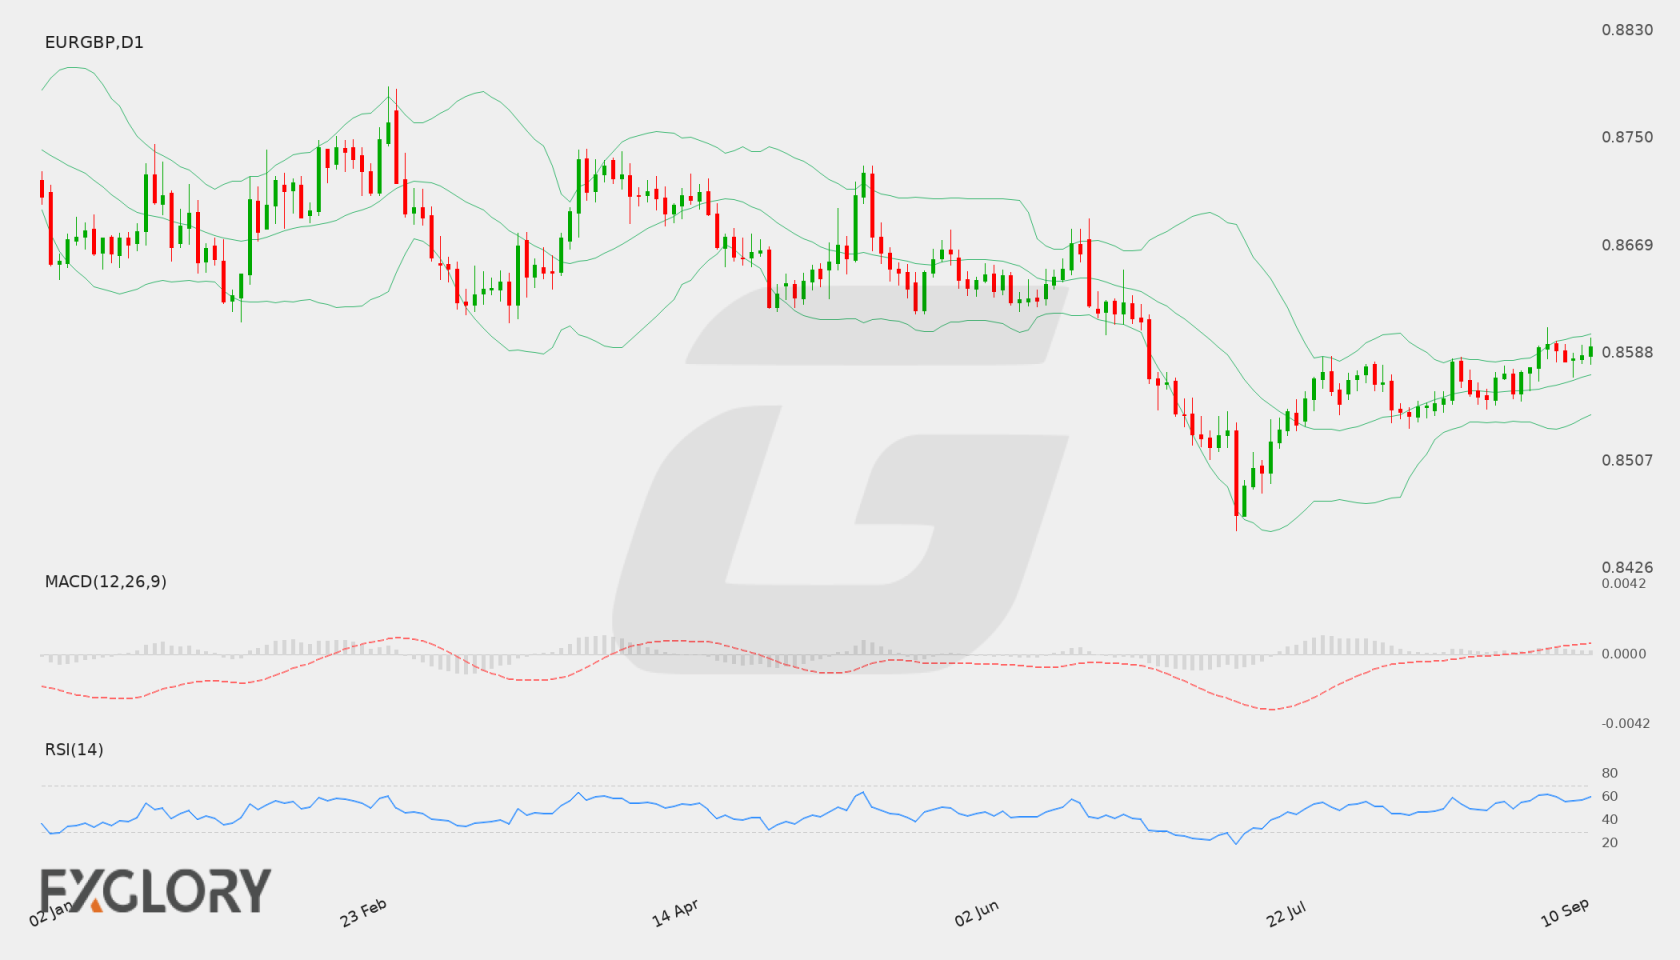
EUR/GBP D1 technical-analysis context for the weekly forecast. Chart data captured 15 October 2026.
EUR/GBP (EURGBP) continues to be shaped by shifting monetary policy expectations and incoming macroeconomic data. Market participants are closely evaluating economic resilience, wage growth, and central bank commentary to determine policy trajectories. Broader risk sentiment and comparative growth metrics between the two economic areas remain primary drivers for cross-currency momentum, with traders waiting to see how upcoming productivity and labor data influence medium-term valuations.
Price Action:
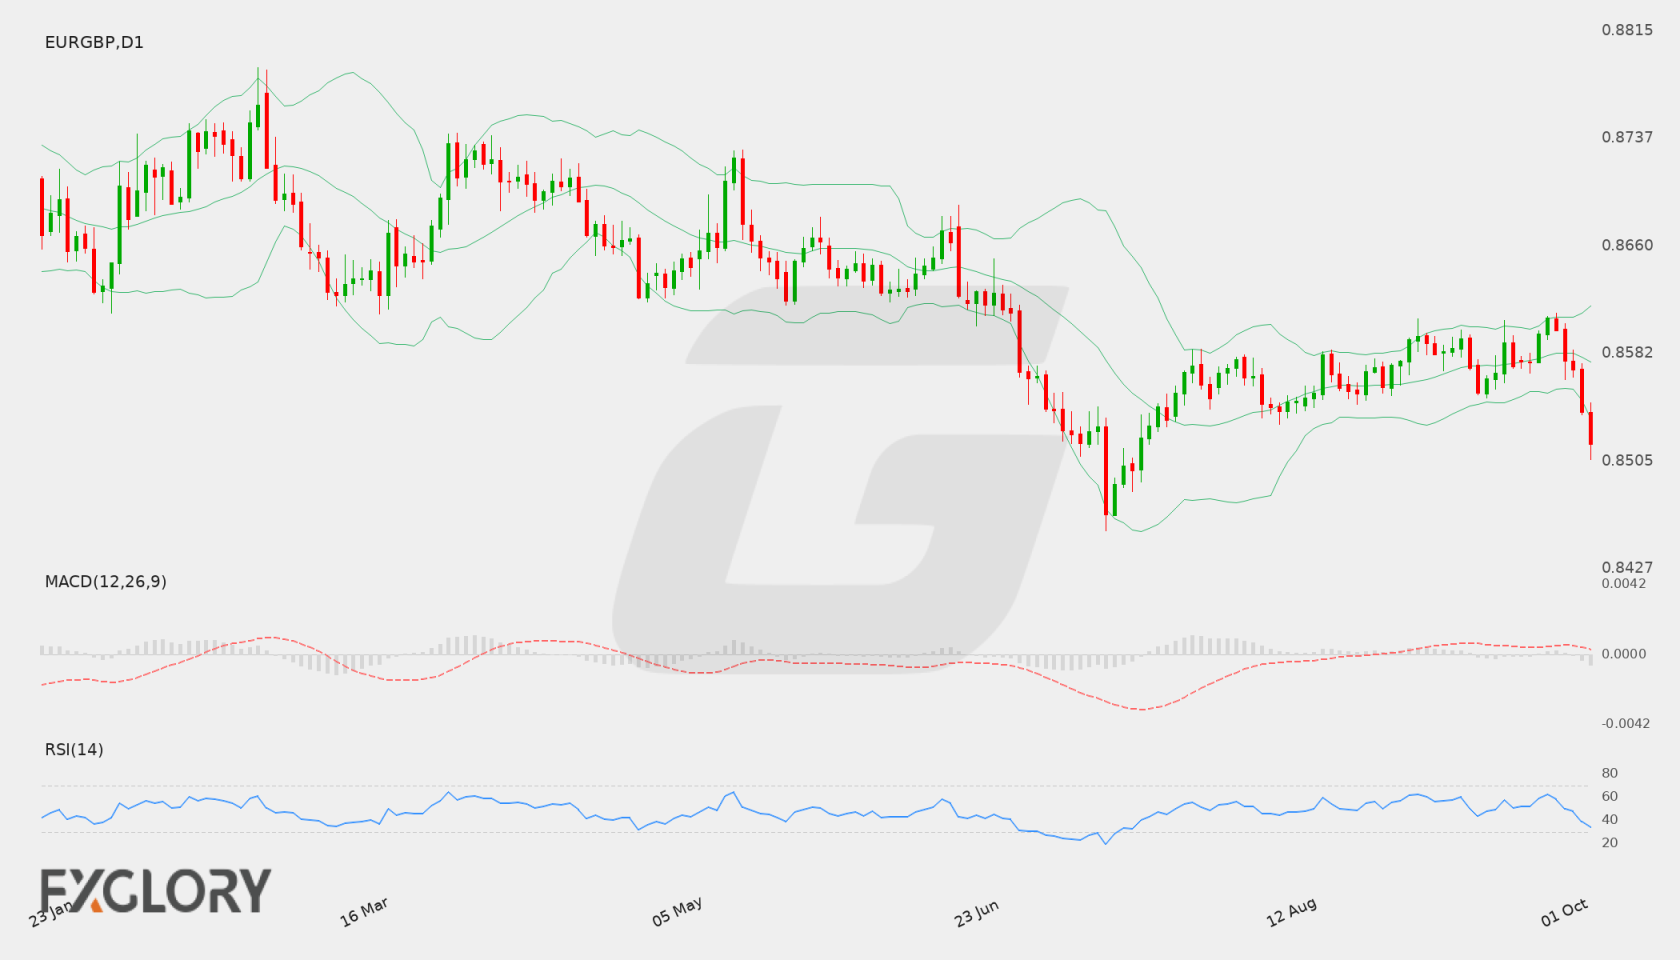
EUR/GBP recently witnessed a clear shift to the downside on the daily chart, declining from swing highs near 0.86112 to close at 0.85169. Consecutive lower daily closes at 0.85770, 0.85706, 0.85399, and 0.85169 confirm active selling pressure, pushing the pair toward the lower boundary of its multi-month trading range.
Key Technical Indicators:
Bollinger Bands: On the daily timeframe, the Bollinger Bands display a middle band at 0.85758, an upper band at 0.86167, and a lower band at 0.85349. With the latest close at 0.85169, EUR/GBP has broken beneath the lower band, reflecting heightened downward volatility and an extended bearish impulse.
RSI: The 14-day Relative Strength Index (RSI) stands at 33.96, hovering just above the oversold boundary. While this indicates sustained bearish pressure in recent sessions, it also suggests that momentum is approaching levels where downside continuation may face slowing velocity.
MACD: The daily MACD indicator registers a reading of -0.00040, holding in negative territory. This placement below the zero mark reflects persistent downward momentum and suggests that sellers currently maintain control of the prevailing trend.
Support and Resistance:
Technical structure on the daily chart highlights primary support at 0.8454, which marks a significant prior floor. On the upside, primary resistance is positioned at 0.86112, with intermediate resistance situated around the 20-day middle Bollinger Band at 0.85758.
News to Watch for EURGBP This Week:
Claimant Count Change: Shifts in unemployment claimant numbers provide updated insight into labor market tightness and potential policy adjustments.
GDP m/m: Monthly economic output data reveals current growth trends and can impact macroeconomic sentiment.
Average Earnings Index 3m/y: Measuring wage progression helps assess domestic inflation pressures that could influence central bank rate paths.
Weekly Outlook and Consideration:
EUR/GBP (EURGBP) heads into the weekly trading period with a technical bias leaning to the downside following its recent daily close at 0.85169. Trading below the lower Bollinger Band of 0.85349, alongside an RSI of 33.96 and a negative MACD of -0.00040, points to pronounced selling pressure. If this momentum persists, the pair could test key daily support at 0.8454. Alternatively, any technical stabilization or consolidation would likely face immediate resistance near the middle Bollinger Band at 0.85758 before sellers potentially challenge the higher ceiling at 0.86112. Market participants will gauge technical reactions around these defined levels against incoming economic indicators.
Disclaimer: The analysis provided for EUR/GBP is for informational purposes only and does not constitute investment advice. Traders are encouraged to perform their own analysis and research before making any trading decisions. Market conditions can change quickly, so staying informed with the latest data is essential.
The EUR/GBP currency pair continues to reflect shifting macroeconomic sentiment between the Eurozone and the UK economies. Market participants monitor underlying inflationary signals and monetary policy outlooks from European and British central bank officials, alongside broader regional risk dynamics.
Price Action:
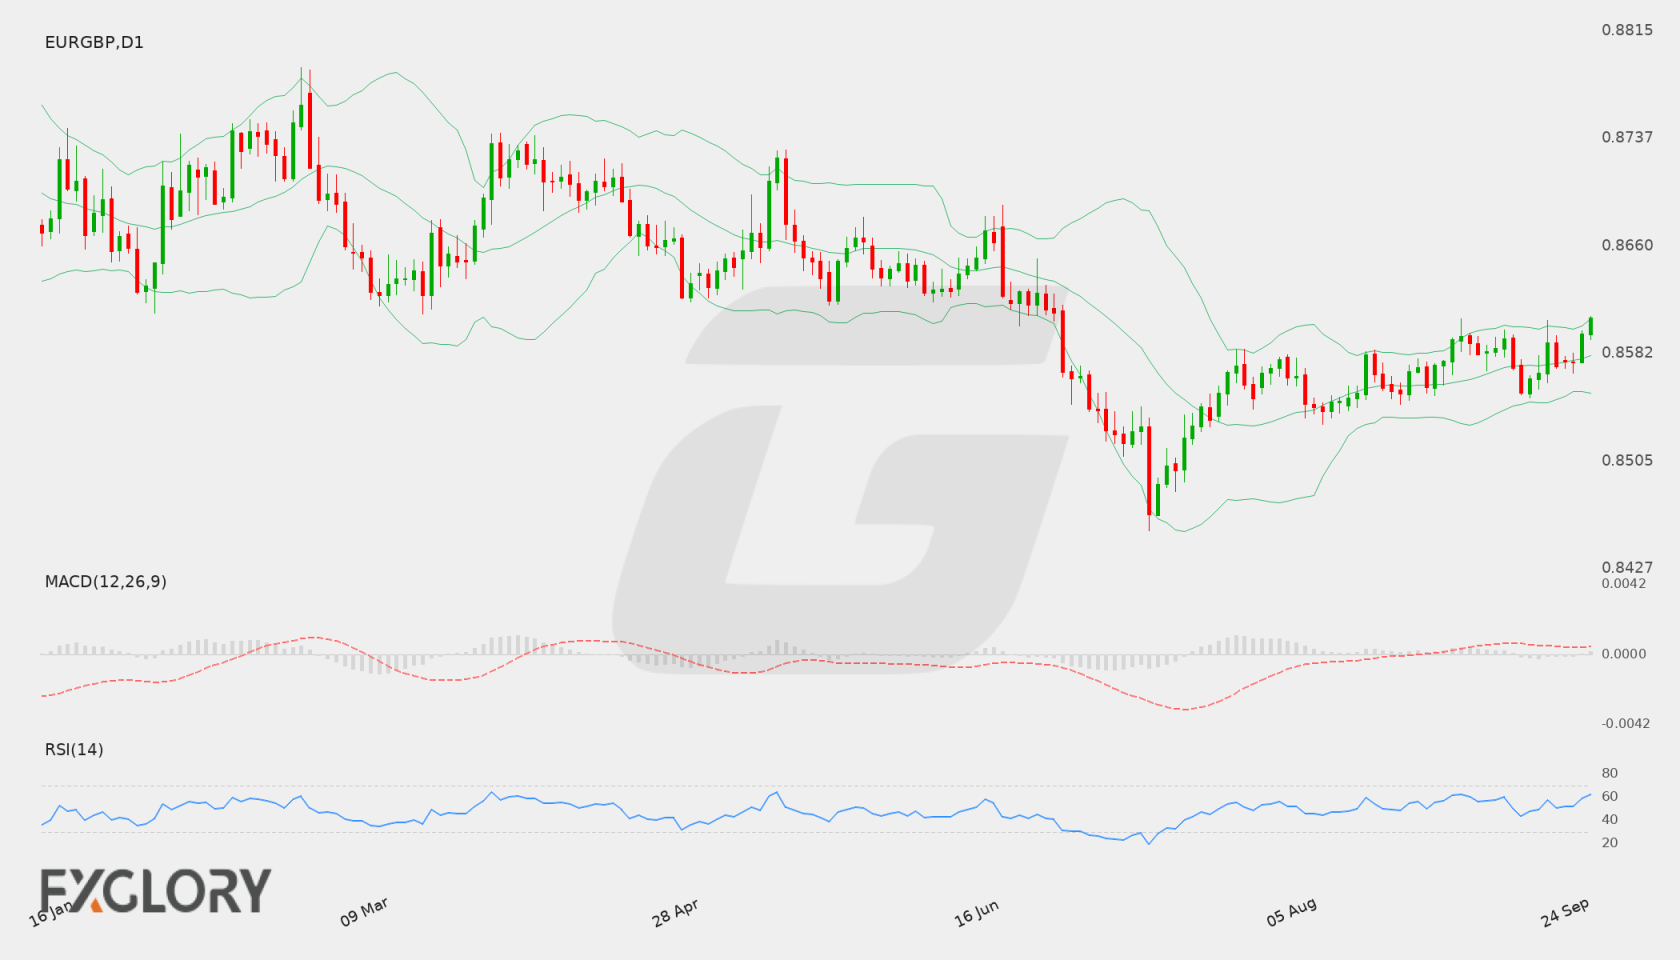
On the daily D1 chart, EUR/GBP closed at 0.86079 after climbing consistently from recent lows around 0.85722 and 0.85759. Price action is currently pressing against the technical resistance boundary near 0.86086, testing buyer strength at these elevated daily levels.
Key Technical Indicators:
Bollinger Bands: The Bollinger Bands indicator on the daily chart reflects a middle band at 0.85803, an upper band at 0.86070, and a lower band at 0.85536. EUR/GBP trading at 0.86079 puts price right along the upper band, indicating bullish expansion and increased volatility.
RSI: The 14-day Relative Strength Index (RSI) is recorded at 61.78. This reflects strong buying momentum while remaining below the overbought threshold of 70.
MACD: The daily MACD line stands in positive territory at 0.000639. This above-zero reading highlights sustained bullish momentum over recent trading sessions.
Support and Resistance:
Key technical levels for EUR/GBP include immediate resistance at 0.86086 and dynamic support at the middle Bollinger Band of 0.85803. Major structural support is identified further down at 0.8454.
News to Watch for EURGBP This Week:
German Prelim CPI m/m: This release offers essential inflation data from Germany that may impact Euro sentiment and central bank rate expectations.
Weekly Outlook and Consideration:
EUR/GBP maintains a bullish tone as it approaches technical resistance at 0.86086 with a daily close of 0.86079. Indicator support from a positive MACD of 0.000639 and an RSI of 61.78 suggests upward pressure remains active. If buyers manage to push decisively past 0.86086, the pair could see continued bullish expansion. Conversely, a rejection at resistance could prompt a consolidation or pullback toward the middle Bollinger Band near 0.85803, with major downside protection anchored at 0.8454.
Disclaimer: The analysis provided for EUR/GBP is for informational purposes only and does not constitute investment advice. Traders are encouraged to perform their own analysis and research before making any trading decisions. Market conditions can change quickly, so staying informed with the latest data is essential.
Economic conditions across the Eurozone continue to be evaluated as traders monitor inflation trends and central bank policy expectations. Broader macroeconomic dynamics in Europe and the UK remain central to defining the fundamental background for EUR/GBP.
Price Action:
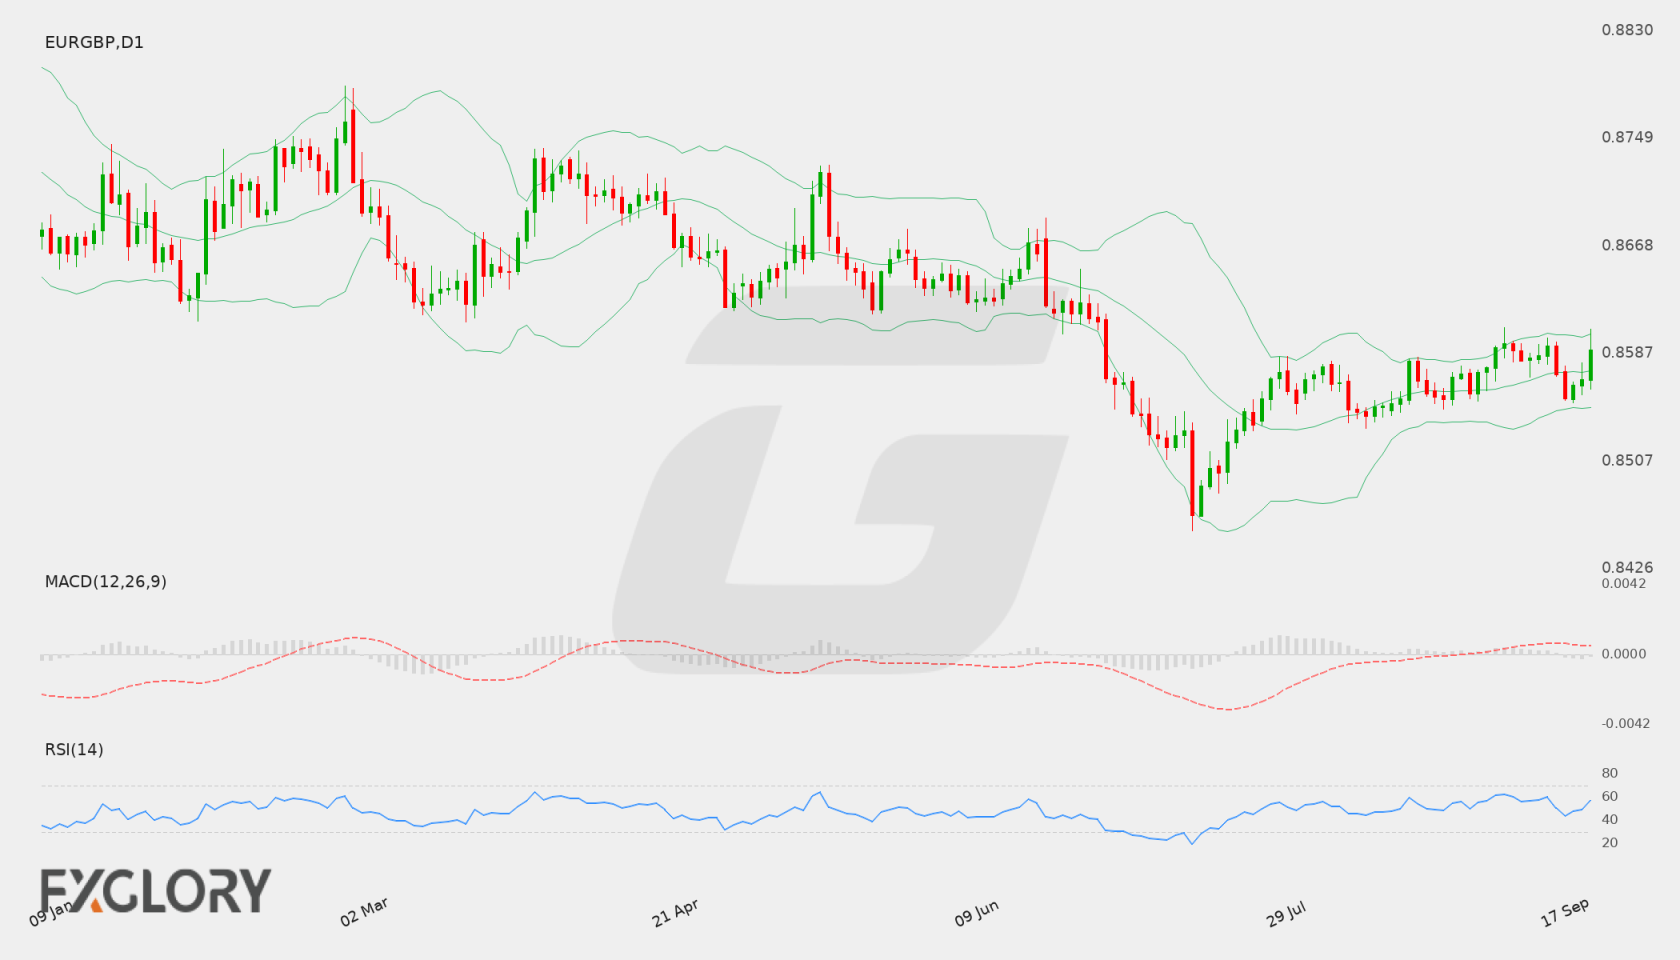
The daily chart for EUR/GBP reveals a recent upward push, with the instrument closing at 0.85897 after advancing from recent daily lows. Price action demonstrates buying interest above key moving averages, keeping short-term momentum tilted to the upside.
Key Technical Indicators:
Bollinger Bands: The Bollinger Bands on the D1 chart reflect a middle band at 0.85742, an upper band at 0.86018, and a lower band at 0.85467. With the latest close at 0.85897, price action is hovering near the upper boundary, pointing to heightened bullish momentum.
RSI: The 14-day Relative Strength Index (RSI) stands at 56.94. This reading above the 50 level indicates mild buyer control while remaining clear of overbought territory.
MACD: The daily MACD indicator holds a positive reading of 0.000373. Positioned above the signal line, it suggests that upward momentum remains active on the daily timeframe.
Support and Resistance:
Key technical levels for EUR/GBP include a primary support level at 0.8454 and a resistance level at 0.86506. These parameters define the current daily trading framework.
News to Watch for EURGBP This Week:
German Prelim CPI m/m: This metric provides preliminary monthly inflation data for Germany.
CPI Flash Estimate y/y: This release reflects broad headline consumer price movements across the Eurozone.
Core CPI Flash Estimate y/y: This measure tracks underlying Eurozone inflation by excluding volatile energy and food components.
Weekly Outlook and Consideration:
EUR/GBP enters the upcoming sessions with a bullish lean following its close at 0.85897. Technical indicators such as an RSI of 56.94 and a positive MACD value of 0.000373 support the potential for further tests toward the resistance zone at 0.86506. Conversely, a turn lower could see prices retreat back toward the middle Bollinger Band at 0.85742 or lower support at 0.8454.
Disclaimer: The analysis provided for EUR/GBP is for informational purposes only and does not constitute investment advice. Traders are encouraged to perform their own analysis and research before making any trading decisions. Market conditions can change quickly, so staying informed with the latest data is essential.
EUR/GBP traders will focus on major economic releases including UK labor statistics, consumer price inflation, and monetary policy decisions. Market participants will gauge economic resilience and prospective interest rate shifts to assess the relative strength of EURGBP.
Price Action:
On the daily D1 chart, EUR/GBP has demonstrated a gradual upward recovery from recent lows near 0.8540 up to the last close of 0.85927. The consistent sequence of higher daily closes reflects steady buying interest as price trades near the top of its recent range.
Key Technical Indicators:
Bollinger Bands: The D1 Bollinger Bands show a middle line at 0.857181, an upper band at 0.860245, and a lower band at 0.854117. With the last close at 0.85927, EUR/GBP is trading above the middle band and pressing toward the upper boundary, indicating positive short-term momentum.
RSI: The 14-day RSI currently reads 59.92, positioning EUR/GBP in moderate bullish territory above the neutral 50 level without signaling overbought condition.
MACD: The MACD indicator records a value of 0.000849, remaining above the zero line. This positive reading aligns with the recent upward movement observed on the daily timeframe for EURGBP.
Support and Resistance:
Key technical levels on the daily chart highlight primary support at 0.8454 and key resistance at 0.86891.
News to Watch for EURGBP This Week:
Claimant Count Change: Shifts in unemployment claims provide insight into labor market strength.
Average Earnings Index 3m/y: Wage growth metrics offer clues regarding underlying inflationary pressures.
Official Bank Rate: The central bank rate decision directly influences yield differentials and market sentiment.
MPC Official Bank Rate Votes: The vote split among committee members reveals internal policy sentiment.
Monetary Policy Summary: Central bank commentary provides key guidance on the economic outlook and interest rate trajectory.
Retail Sales m/m: Consumer spending figures provide key insight into underlying domestic demand.
Weekly Outlook and Consideration:
EUR/GBP carries constructive momentum into the new week following a close at 0.85927 on the daily chart. Price action remains positioned above the D1 Bollinger middle band at 0.857181, supported by a positive MACD value of 0.000849 and an RSI of 59.92. Near-term resistance stands at 0.86891, while major support is located at 0.8454. High-impact economic announcements could introduce volatility and determine whether EURGBP breaches resistance or consolidates within its current range.
Disclaimer: The analysis provided for EUR/GBP is for informational purposes only and does not constitute investment advice. Traders are encouraged to perform their own analysis and research before making any trading decisions. Market conditions can change quickly, so staying informed with the latest data is essential.