
GBPNZD Forecast

GBP iconNZD icon
GBP/NZD

British Pound vs New Zealand Dollar

GBP/NZD Live Price

2.33399
-0.06%

GBP/NZD Forecast — 12 September 2026

Time Zone: GMT +3

Time Frame: Daily (D1) / Weekly Outlook

Weekly Fundamental Overview:

The GBP/NZD exchange rate faces an event-heavy week featuring UK labor metrics, inflation figures, retail sales data, and the latest central bank interest rate decision alongside New Zealand quarterly growth indicators. These economic releases are expected to drive sentiment and influence price momentum across both currencies.

Price Action:

On the daily chart, GBP/NZD has demonstrated strong bullish price action, advancing steadily over recent sessions from lower levels near 2.28775 to a latest close of 2.32975. The sequential higher daily highs and lows confirm sustained short-term buying pressure.

Key Technical Indicators:

Bollinger Bands: The pair is trading above the upper Bollinger Band of 2.32126, with the last close reaching 2.32975. The middle band sits at 2.29678 while the lower band is located at 2.27230, indicating an expansion in volatility and strong upward price movement.

RSI: The 14-period RSI is currently positioned at 69.06, approaching the overbought threshold and reflecting strong bullish sentiment.

MACD: The MACD indicator remains in positive territory with a value of 0.00485, confirming that upside momentum is currently favoring buyers.

Support and Resistance:

Key daily technical levels for GBPNZD highlight immediate technical resistance at 2.35338 and key support at 2.27772.

News to Watch for GBPNZD This Week:

  • Claimant Count Change: Provides updated labor market data that can influence central bank rate expectations.
  • Average Earnings Index 3m/y: Highlights wage growth trends that impact broader inflation prospects.
  • CPI y/y: Offers a key measure of consumer price inflation affecting monetary policy decisions.
  • GDP q/q: Delivers important insight into overall economic expansion and output growth.
  • Official Bank Rate: Determines key policy interest rate settings for borrowing costs.
  • MPC Official Bank Rate Votes: Discloses the internal vote distribution among central bank policymakers.
  • Monetary Policy Summary: Contains commentary explaining recent policy decisions and economic views.
  • Retail Sales m/m: Reflects consumer spending strength and consumer economic health.

Weekly Outlook and Consideration:

GBP/NZD exhibits notable strength heading into the week, closing at 2.32975 above the upper Bollinger Band with an RSI near 69.06. While MACD points to ongoing momentum, upcoming economic news events and nearby resistance at 2.35338 could introduce two-way volatility, with major support resting lower at 2.27772.

Disclaimer: The analysis provided for GBP/NZD is for informational purposes only and does not constitute investment advice. Traders are encouraged to perform their own analysis and research before making any trading decisions. Market conditions can change quickly, so staying informed with the latest data is essential.
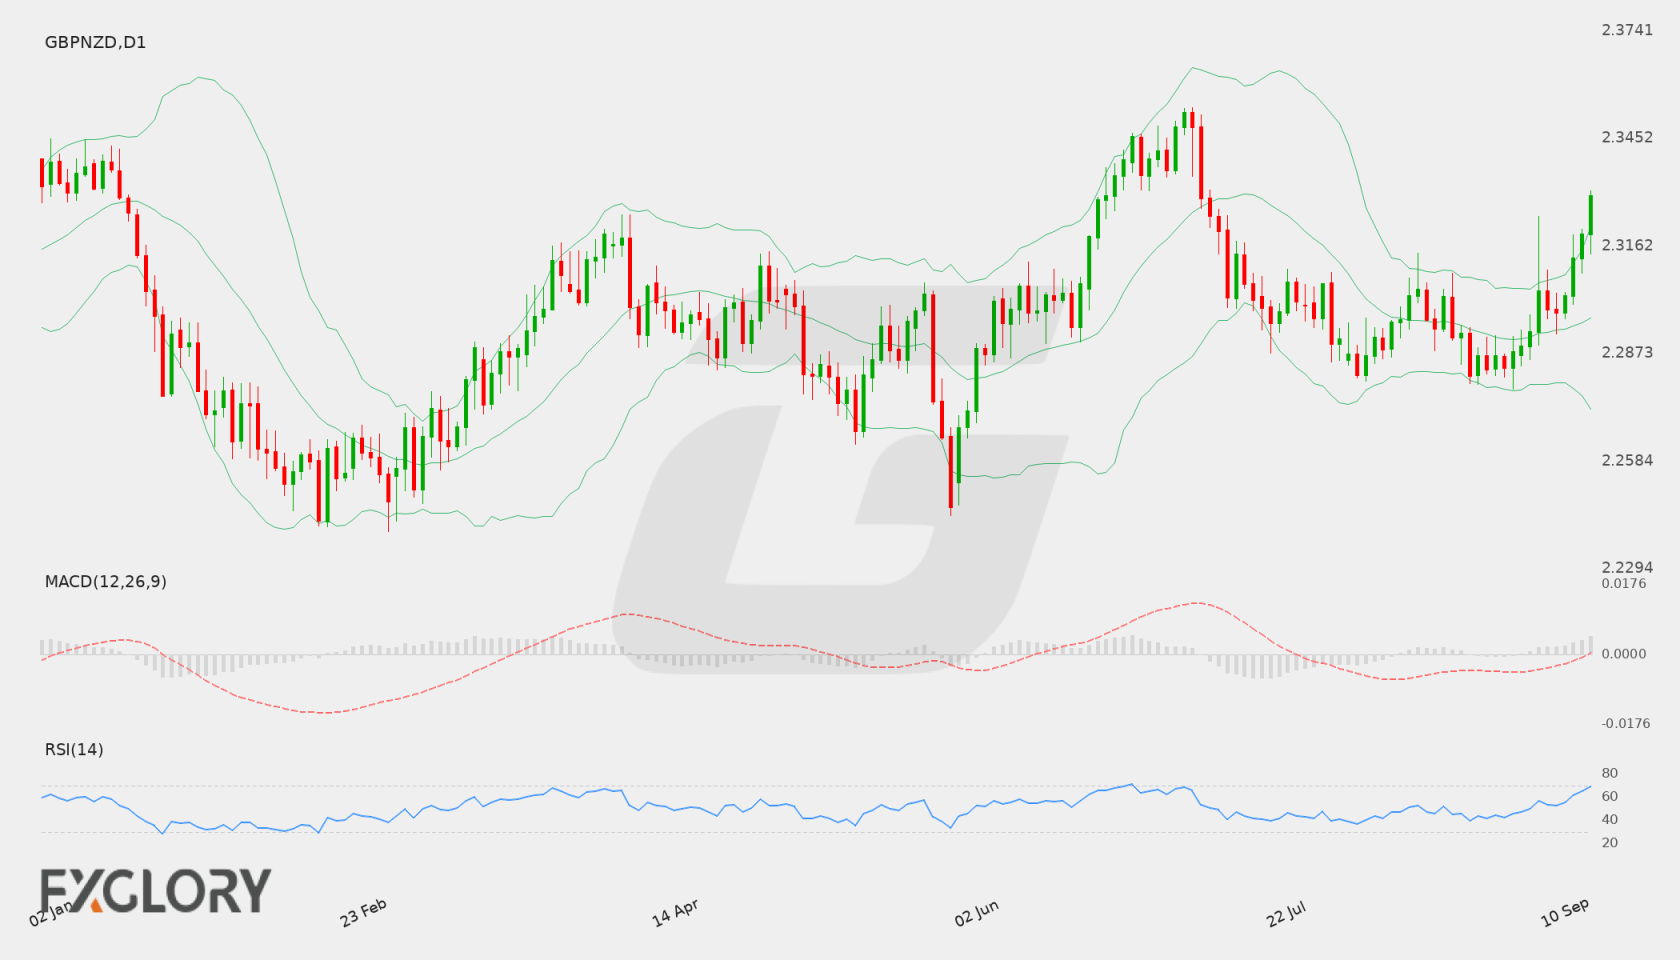
GBP/NZD D1 technical analysis chart
GBP/NZD D1 Technical Analysis for 09.12.2026

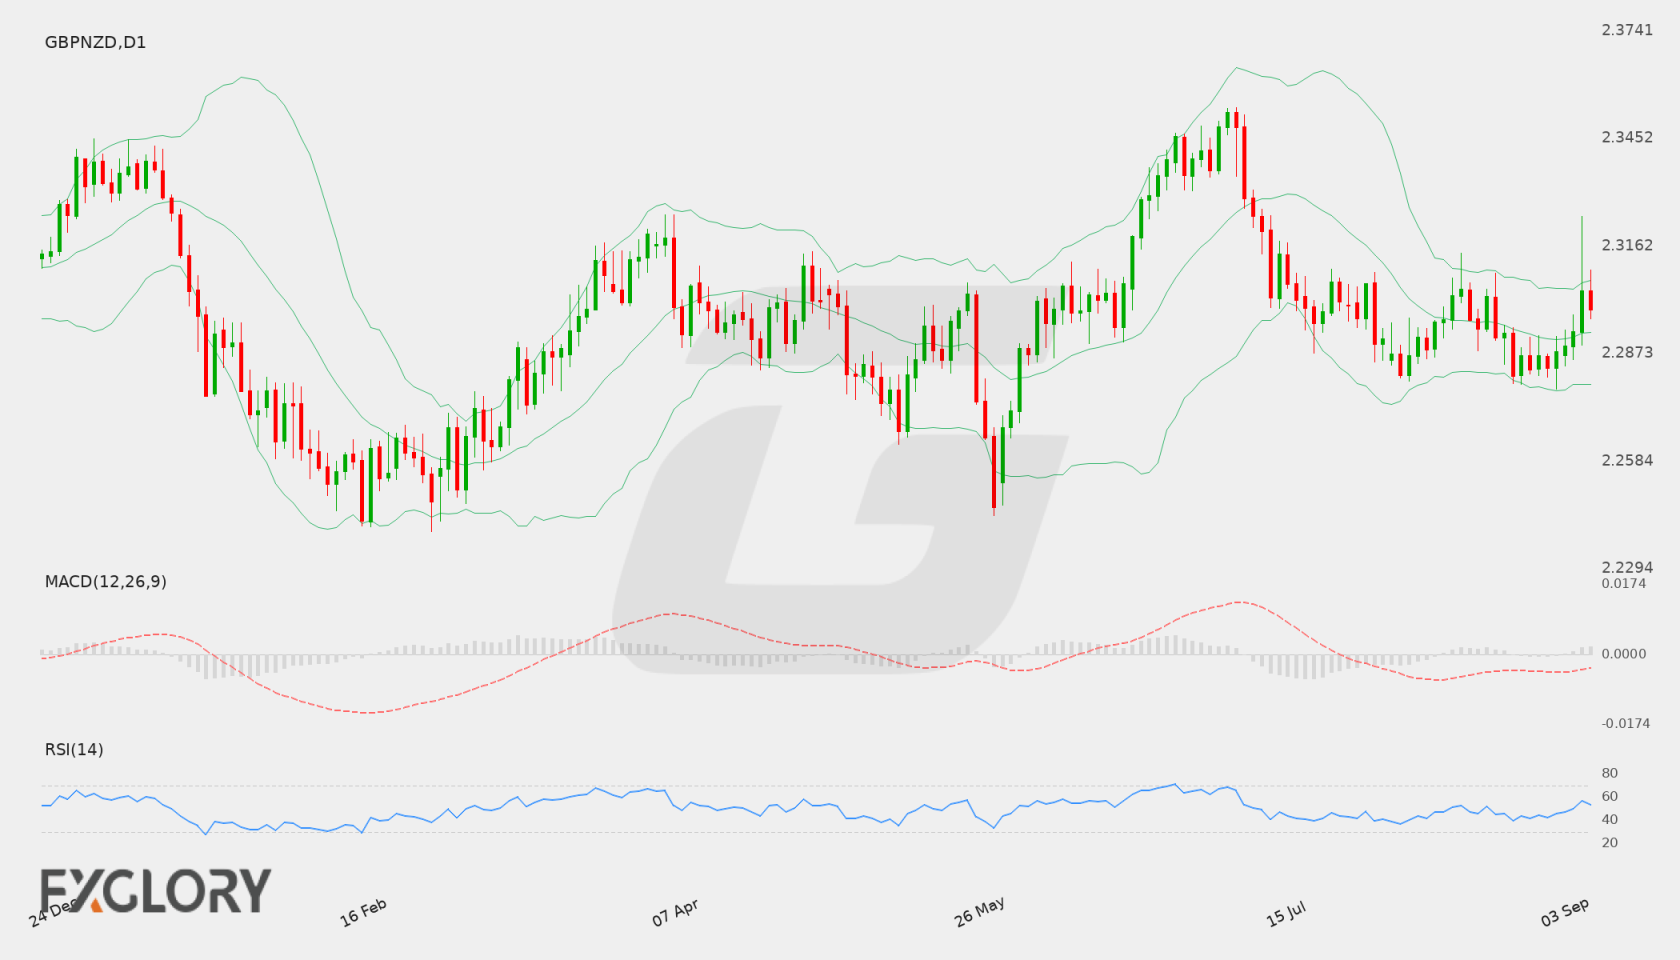
GBP/NZD Forecast — 5 September 2026

Time Zone: GMT +3

Time Frame: Daily (D1) / Weekly Outlook

Weekly Fundamental Overview:

GBP/NZD continues to respond to shifting global risk sentiment and domestic economic signals. Investors are evaluating sovereign growth momentum and trade conditions, which influence demand for the currency pair. The pair’s trajectory remains sensitive to macro data performance and broader appetite across international capital markets.

Price Action:

On the daily D1 chart, GBP/NZD closed at 2.29911 after a recent rebound from lower support areas. The recent price action indicates consolidation, as candles trade near the center of the recent range while testing intermediate moving averages and volatility bands.

Key Technical Indicators:

Bollinger Bands: The D1 Bollinger Bands indicate a middle band at 2.29301, with the upper band at 2.30702 and the lower band at 2.27900. Trading at 2.29911 positions GBP/NZD slightly above the middle band, reflecting a mild upward bias within the current volatility envelope.

RSI: The 14-day Relative Strength Index (RSI) is currently at 52.995. This places the pair in neutral territory, indicating balanced market sentiment without immediate overbought or oversold pressure.

MACD: The MACD indicator on the daily chart stands at -0.00160. This reading below the zero line shows weak bearish sentiment, though the narrowing gap suggests potential stabilization if buying interest persists.

Support and Resistance:

Key technical support for GBP/NZD is located around 2.27772, with additional lower boundary support near 2.27900. Overhead resistance is established at 2.35338, while the upper Bollinger Band near 2.30702 serves as a nearer-term upside target.

News to Watch for GBPNZD This Week:

  • GDP m/m: Monthly economic growth data provides insight into national output trends and potential monetary policy shifts.

Weekly Outlook and Consideration:

The GBP/NZD pair approaches the upcoming week hovering near 2.29911, positioned just above its daily middle Bollinger Band of 2.29301. With a neutral RSI of 52.995 and a slightly negative MACD of -0.00160, price action could continue consolidating within established boundaries. A sustained move higher may test resistance at 2.35338, whereas a reversal lower could bring support at 2.27772 back into focus.

Disclaimer: The analysis provided for GBP/NZD is for informational purposes only and does not constitute investment advice. Traders are encouraged to perform their own analysis and research before making any trading decisions. Market conditions can change quickly, so staying informed with the latest data is essential.
GBP/NZD D1 technical analysis chart
GBP/NZD D1 Technical Analysis for 09.05.2026

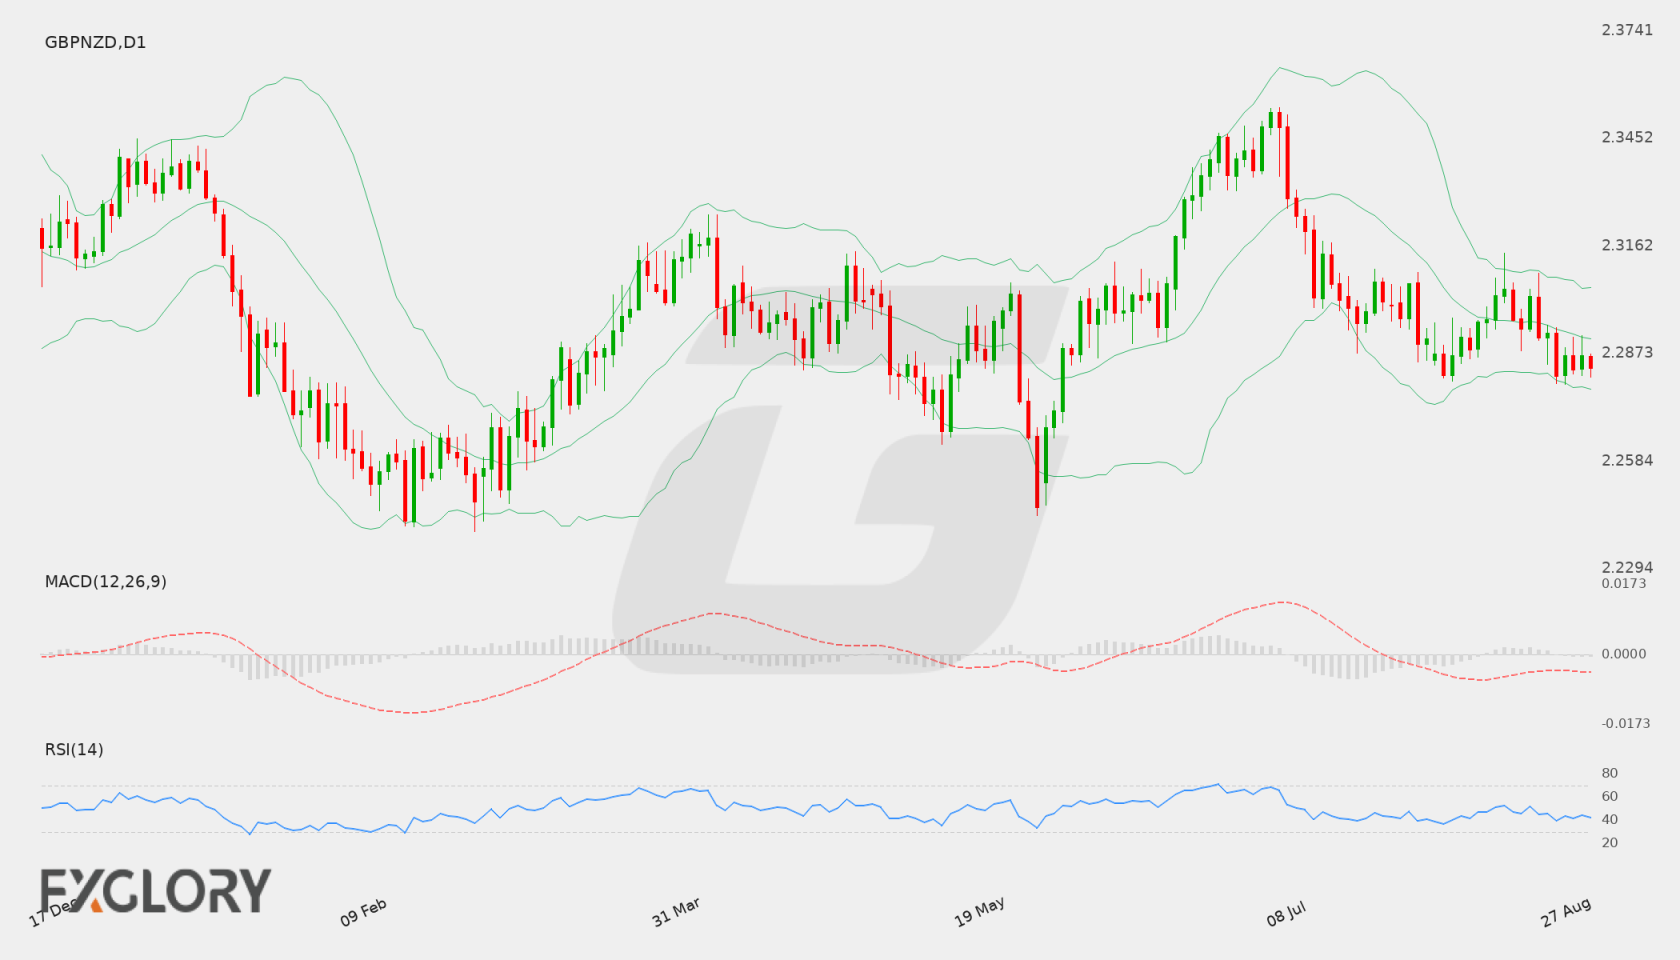
GBP/NZD Forecast — 29 August 2026

Time Zone: GMT +3

Time Frame: Daily (D1) / Weekly Outlook

Weekly Fundamental Overview:

The GBP/NZD currency pair faces fundamental drivers from both sides of the globe. Market focus is firmly anchored on monetary policy outlooks from the Reserve Bank of New Zealand and the Bank of England, alongside broader global risk sentiment that typically influences high-yielding currencies like the New Zealand dollar against the British pound.

Price Action:

On the Daily (D1) time frame, GBP/NZD has experienced a steady descent from recent swing highs near 2.35338, settling around the 2.28356 level. The recent candlestick patterns signal persistent selling pressure, keeping price action beneath key short-term moving averages and testing lower support zones.

Key Technical Indicators:

Bollinger Bands: The Bollinger Bands on the D1 chart show a middle boundary at 2.29125, an upper band at 2.30490, and a lower band at 2.27760. Trading below the middle band confirms a short-term bearish slant, with prices trending towards the lower band where dynamic support may be tested.

RSI: The 14-period Relative Strength Index (RSI) stands at 42.27. Sitting below the neutral 50 threshold without entering oversold territory, the indicator reflects ongoing downside momentum with room for further price movement in either direction.

MACD: The Daily MACD indicator displays a reading of -0.00500, remaining in negative territory. This negative baseline indicates that bearish momentum continues to dominate price structure, though traders will watch for any signs of momentum loss near current levels.

Support and Resistance:

Key technical parameters for GBPNZD place immediate daily support near 2.2789, a critical level that could prevent deeper retracements toward the lower Bollinger Band. On the upside, major daily resistance is identified around 2.35338, representing a key barrier for any bullish recovery.

News to Watch for GBPNZD This Week:

  • RBNZ Rate Statement: Delivers critical insights into New Zealand's economic outlook and future monetary direction.
  • Official Cash Rate: Sets the baseline interest rate policy for New Zealand, directly impacting the value of the NZD.
  • RBNZ Monetary Policy Statement: Outlines detailed macroeconomic forecasts that shape interest rate expectations.
  • RBNZ Press Conference: Provides commentary and Q&A from policymakers that can spark significant volatility in NZD pairs.
  • Monetary Policy Report Hearings: Gives market participants clarity on Bank of England policy views and inflation expectations.

Weekly Outlook and Consideration:

Looking ahead, GBP/NZD retains a tilted bearish bias on the daily timeframe as long as price remains beneath the 2.29125 middle Bollinger Band. A sustained hold below this level leaves support at 2.2789 vulnerable to testing. Conversely, if buyers reclaim ground above 2.29125, GBP/NZD could consolidate toward higher resistance zones, though fundamental policy updates will ultimately dictate the pair’s directional breakout.

Disclaimer: The analysis provided for GBP/NZD is for informational purposes only and does not constitute investment advice. Traders are encouraged to perform their own analysis and research before making any trading decisions. Market conditions can change quickly, so staying informed with the latest data is essential.
GBP/NZD D1 technical analysis chart
GBP/NZD D1 Technical Analysis for 08.29.2026

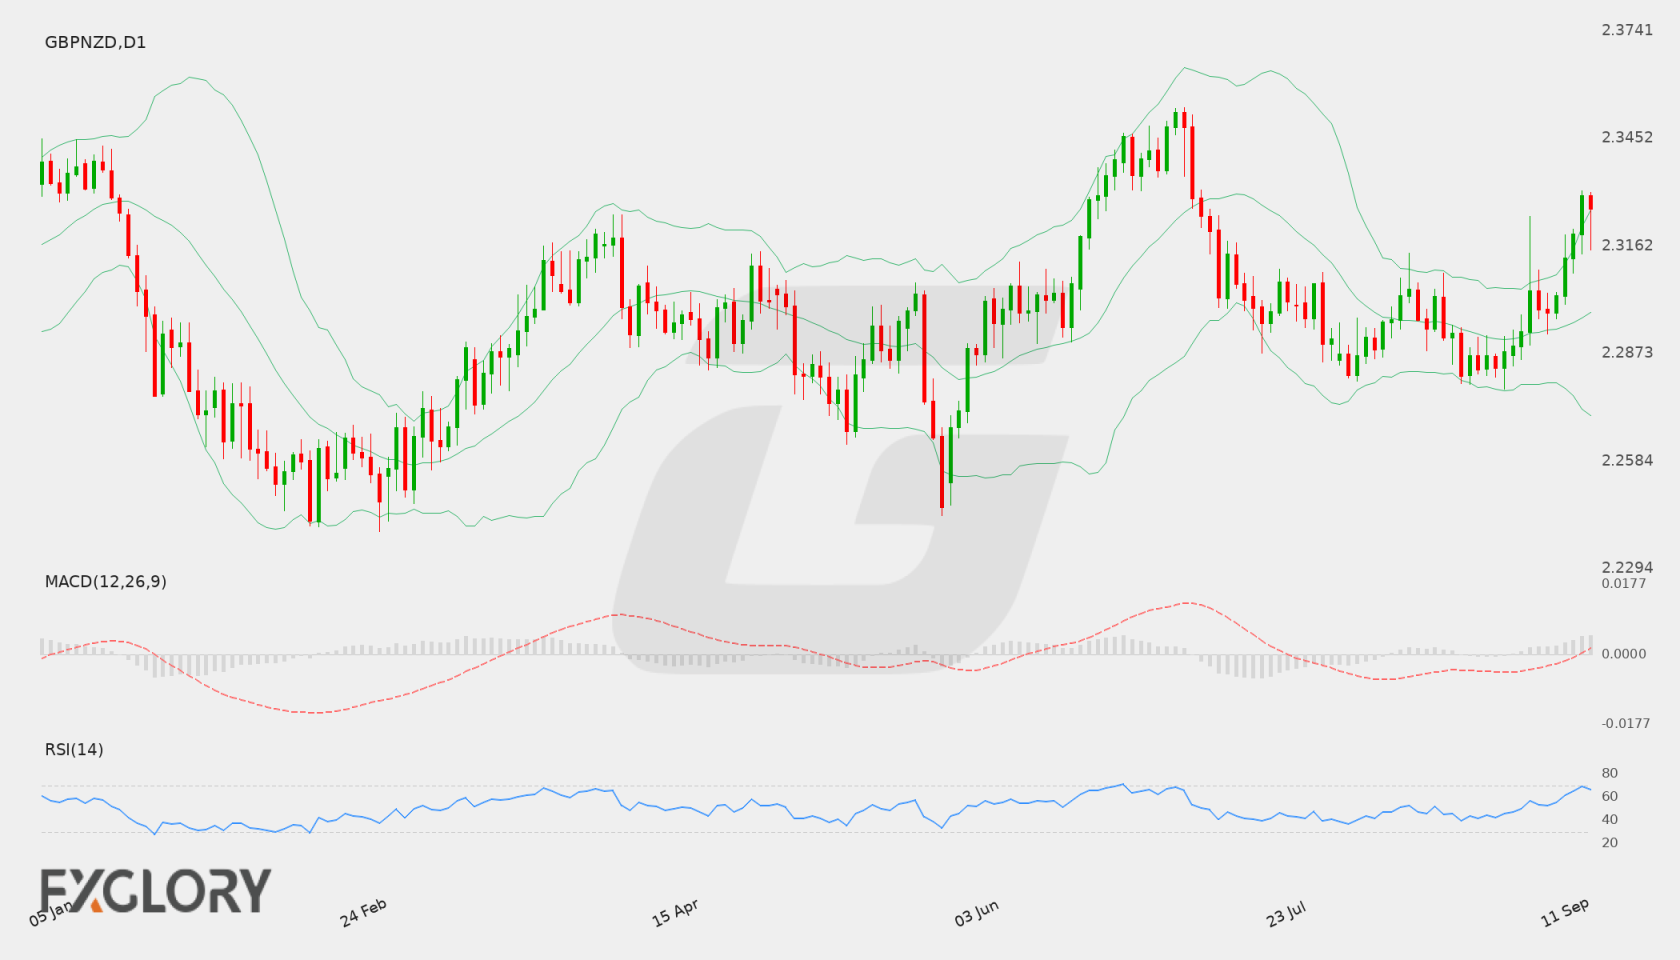
GBP/NZD Forecast — 14 September 2026

Time Zone: GMT +3

Time Frame: Daily (D1) / Weekly Outlook

Weekly Fundamental Overview:

The GBP/NZD currency pair reflects shifting macroeconomic expectations between the United Kingdom and New Zealand economies. Sterling sentiment is closely tied to incoming economic survey data, while the New Zealand Dollar remains sensitive to global risk appetite and commodity markets.

Price Action:

On the D1 chart, GBP/NZD has demonstrated sustained bullish price action in recent sessions, rising from key swing lows near 2.2832 to reach a high of 2.33096 before closing at 2.32639. The series of higher daily closes indicates active buying demand.

Key Technical Indicators:

Bollinger Bands: The recent close of 2.32639 places GBP/NZD slightly above the upper Bollinger Band at 2.32595. The middle band sits at 2.29828 and the lower band at 2.27061, highlighting strong upside volatility as price stretches near the upper boundary.

RSI: The 14-period Relative Strength Index (RSI) is recorded at 66.14. This reading indicates firm buyer momentum without yet entering extreme overbought conditions above 70.

MACD: The Daily MACD indicator displays a reading of 0.00615, remaining in positive territory. This configuration signals ongoing bullish momentum for the pair on the daily timeframe.

Support and Resistance:

Technical support for GBPNZD is defined at 2.27772, while major overhead resistance is situated at 2.35338. A test of these levels could determine the sustainability of current market trends.

News to Watch for GBPNZD This Week:

  • Flash Services PMI: Assesses economic activity in the UK service sector and serves as a key indicator of economic sentiment.
  • Flash Manufacturing PMI: Measures manufacturing output and business conditions within the UK economy.

Weekly Outlook and Consideration:

GBP/NZD maintains a firm stance on the daily chart, with price settling at 2.32639 near the upper Bollinger Band of 2.32595. Technical indicators remain positive, highlighted by a 14-day RSI of 66.14 and a positive MACD value of 0.00615. Resistance stands at 2.35338, while support lies at 2.27772. Traders will evaluate upcoming economic releases, including UK Flash Services PMI and Flash Manufacturing PMI, to gauge whether the bullish drive can persist.

Disclaimer: The analysis provided for GBP/NZD is for informational purposes only and does not constitute investment advice. Traders are encouraged to perform their own analysis and research before making any trading decisions. Market conditions can change quickly, so staying informed with the latest data is essential.

GBP/NZD D1 technical analysis chart
GBP/NZD D1 Technical Analysis for 09.14.2026

GBP/NZD Forecast — 22 August 2026

Time Zone: GMT +3

Time Frame: Daily (D1) / Weekly Outlook

Weekly Fundamental Overview:

The GBP/NZD pair faces an intriguing fundamental outlook as traders weigh UK economic conditions against major central bank announcements in New Zealand. Diverging monetary policy expectations continue to play a pivotal role in guiding exchange rate sentiment. Market participants are closely monitoring central bank communications and inflation dynamics to gauge the trajectory of future policy rate adjustments. Broader risk sentiment in global equity and commodity markets also serves as a key driver, given the sensitive nature of commodity-linked currencies during periods of shifting global liquidity.

Price Action:

On the daily D1 chart, GBP/NZD closed at 2.29279 after oscillating between moderate highs near 2.3080 and recent lows around 2.2840. The market shows a phase of lateral consolidation, failing to establish a strong directional breakout above recent minor peaks. Price action remains bounded within a medium-term range, reflecting a balanced tug-of-war between buyers attempting to regain upward momentum and sellers pushing price lower toward recent swing support levels.

Key Technical Indicators:

Bollinger Bands: The daily Bollinger Bands highlight a consolidation structure with the middle band positioned at 2.29491. The upper band resides at 2.30785 while the lower band sits at 2.28196. The current close at 2.29279 sits slightly below the middle band, indicating a slight bearish tilt within the channel. A firm move above the middle band could open room toward the upper band at 2.30785, whereas persistent weakness beneath 2.29491 keeps the lower band at 2.28196 exposed.

RSI: The 14-day Relative Strength Index (RSI) registers at 45.58, keeping the indicator in neutral territory comfortably above oversold conditions. Sitting below the mid-50 threshold, the RSI signals a mild preference for sellers without confirming an extreme directional bias, allowing flexibility for price moves in either direction based on incoming fundamental catalysts.

MACD: The D1 MACD indicator is currently trading at -0.00319, residing below the zero line. This negative value reflects modest underlying bearish momentum and suggests that upside attempts remain restrained. However, the lack of steep downside divergence indicates that momentum is relatively stable rather than expanding rapidly to the downside.

Support and Resistance:

Key technical levels on the daily timeframe outline clear boundaries for GBP/NZD. Major overhead resistance is located at 2.35338, representing a key barrier for extended bullish continuation. On the downside, primary structural support is identified at 2.24369. Intermediary technical reference points remain defined by the Bollinger lower band at 2.28196 and the upper band near 2.30785.

News to Watch for GBPNZD This Week:

  • RBNZ Monetary Policy Statement: This statement outlines central bank economic projections and policy decisions that can drive significant market movement.
  • Official Cash Rate: The benchmark rate decision heavily influences yield expectations and valuation for the currency.
  • RBNZ Rate Statement: This commentary clarifies the central bank policy stance and guides future rate expectations.
  • RBNZ Press Conference: Remarks from monetary officials offer detailed context regarding inflation trends and future monetary policy.
  • Monetary Policy Report Hearings: Central bank leaders address parliamentary inquiries, providing insights into economic conditions and policy outlook.

Weekly Outlook and Consideration:

The weekly outlook for GBP/NZD points toward a range-bound environment with potential volatility tied to upcoming central bank events. With price hovering near 2.29279, just beneath the daily Bollinger middle band at 2.29491, technical indicators like the RSI at 45.58 and MACD at -0.00319 present a neutral to slightly cautious tone. A sustained breakout above 2.30785 could pave the way toward resistance at 2.35338. Conversely, if selling pressure intensifies beneath 2.28196, price may gradually slide toward key support at 2.24369.

Disclaimer: The analysis provided for GBP/NZD is for informational purposes only and does not constitute investment advice. Traders are encouraged to perform their own analysis and research before making any trading decisions. Market conditions can change quickly, so staying informed with the latest data is essential.

1GBP = –––NZD –––%
GBPNZD
Loading chart...