GBPNZD Forecast

GBP iconNZD icon
GBP/NZD

British Pound vs New Zealand Dollar

GBP/NZD Live Price

2.30699
+0.23%

GBP/NZD Forecast — 9 May 2024

Time Zone: GMT +3

Time Frame: 4 Hours (H4)

Fundamental Analysis:

The GBP/NZD analysis reflects the dynamic between the British Pound and the New Zealand Dollar. Today, key economic indicators such as the Official Bank Rate and speeches by BOE Governor Bailey may significantly influence GBP. The Bank Rate has aligned with forecasts in recent months, stabilizing expectations, but any deviation today could sway GBP value. The MPC’s unanimous vote projection suggests a more hawkish monetary policy stance, which traditionally strengthens the currency.

Price Action Analysis:

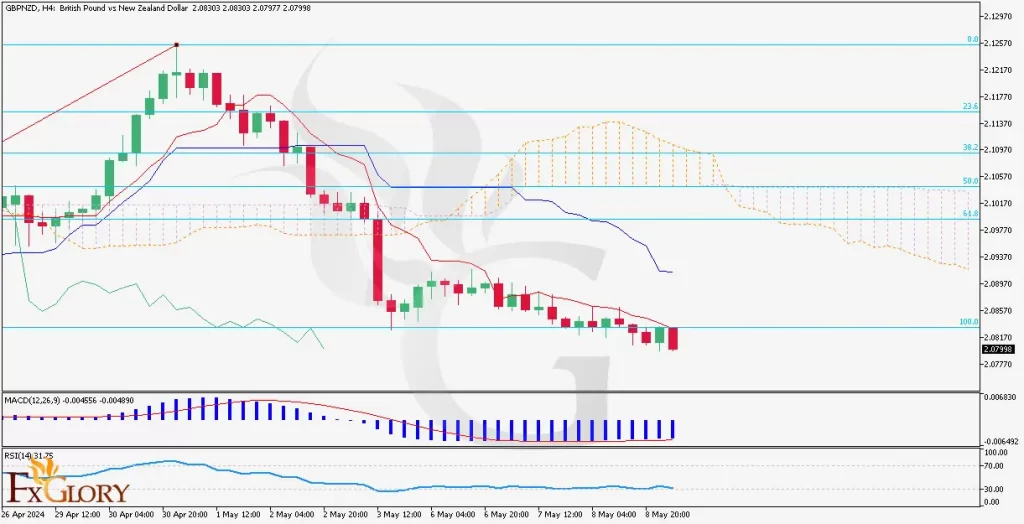
In the H4 timeframe, the GBP/NZD price action analysis shows a volatile trend with recent bullish momentum. The formation of a series of higher lows over the past sessions suggests an upward corrective movement within a broader bearish context. The price is currently testing a key resistance level, and the reaction here will indicate whether the bullish sentiment can sustain.

Key Technical Indicators:

Ichimoku Cloud: The price is approaching the lower boundary of the Ichimoku cloud, indicating potential resistance. If the price breaks through, it may signal a stronger bullish trend reversal.

MACD (Moving Average Convergence Divergence): The MACD line is above the signal line but still below zero, indicating improving bullish momentum yet within an overall bearish trend.

RSI (Relative Strength Index): The RSI is above 50, suggesting increased buying momentum, but is not yet indicating overbought conditions, allowing room for further upside.

Fibonacci Retracement: Key Fibonacci levels from recent highs to lows show the price nearing the 61.8% retracement level, which may act as significant resistance.

Support and Resistance:

Support: The recent swing low around 1.9280 serves as the primary support level.

Resistance: Immediate resistance is found near the 61.8% Fibonacci retracement level at 1.9500.

Conclusion and Consideration:

The GBPNZD analysis is currently experiencing a bullish correction within a larger bearish trend on the H4 chart. The upcoming economic announcements and BOE Governor Bailey’s speech could heavily impact GBP strength. Traders should monitor these events closely, as any hawkish surprise could reinforce the bullish trend. However, the presence near significant resistance levels suggests caution, with potential reversal risks if the bullish momentum cannot sustain.

Disclaimer: The provided GBPNZD chart forecast is for informational purposes only and does not constitute investment advice. Traders should conduct their own research and analysis before making any trading decisions.

gbpnzd H4 chart analysis on 09-05-2024

GBP/NZD Forecast — 26 April 2024

Time Zone: GMT +2

Time Frame: 4 Hours (H4)

Fundamental Analysis:

The GBPNZD pair reflects the economic dynamics between the UK and New Zealand. Factors such as interest rate differentials, economic releases from both nations, and global risk sentiment significantly influence this pair. The UK’s economic health can be assessed by indicators like GDP, employment data, and Brexit developments, while New Zealand’s dairy exports and tourism sector are critical to its currency’s strength. Trade relations and commodity price fluctuations also play pivotal roles in the direction of this pair.

Price Action:

On the H4 chart, GBPNZD has shown volatility with a mix of bullish and bearish candlesticks. Recently, there has been a slight bearish movement, indicated by the presence of long upper wicks, suggesting rejection at higher levels. The price has fluctuated around the Ichimoku cloud, indicating uncertainty and a potential transition phase.

Key Technical Indicators:

Ichimoku: Price is interacting with the Ichimoku Cloud, which suggests indecision in the market. The cloud ahead appears to be turning bullish, potentially forecasting an upcoming positive trend.

MACD: The MACD histogram shows weak momentum as it hovers around the baseline, with the MACD line slightly above the signal line, indicating a weak bullish momentum.

RSI: The RSI is near the 50-level, which is neutral territory, suggesting a balance between buyers and sellers without clear dominance from either side.

Support and Resistance:

Support: The nearest support is observed around the lower boundary of the Ichimoku Cloud.

Resistance: Immediate resistance can be identified at the recent highs just above the cloud.

Conclusion and Consideration:

The GBPNZD pair is currently exhibiting signs of indecision. The mixed signals from the technical indicators suggest traders should proceed with caution. Considering the fundamental backdrop, traders should stay attuned to economic releases and policy decisions from the UK and New Zealand. Risk management is crucial, as the market could pivot in either direction. A break above the Ichimoku cloud could signal bullish momentum, while a drop below could indicate bearish pressure.

Disclaimer: The analysis provided is for informational purposes only and should not be construed as investment advice. Always perform your own due diligence before making trading decisions.

GBPNZD-H4--Daily-Technical-Analysis-on-26.04

GBP/NZD Forecast — 29 March 2024

Time Zone: GMT +2

Time Frame: 4 Hours (H4)

Fundamental Analysis:

The GBPNZD pair reflects the economic dynamics between the United Kingdom and New Zealand. Key factors influencing this currency pair include interest rate differentials between the Bank of England and the Reserve Bank of New Zealand, trade balance data, and geopolitical events affecting either economy. In addition, the impact of commodity prices, especially dairy products which are significant to New Zealand’s exports, and post-Brexit trade policies of the UK, play vital roles in shaping the pair’s fundamental outlook.

Price Action:

The H4 chart for GBPNZD shows a consistent uptrend, with the price sustaining above the key moving averages. The series of higher highs and higher lows suggests the presence of strong bullish momentum. The price has recently made a bullish breakout, signaling the potential for continued upward movement.

Key Technical Indicators:

Bollinger Bands: The price is trading near the upper Bollinger Band, indicating that the market is in a high volatility phase with potential resistance near the band’s edge.

Ichimoku Cloud: Price candles are above the Ichimoku cloud, and the cloud is green, suggesting that the trend is bullish and the cloud is acting as a support zone.

RSI (Relative Strength Index): The RSI is above 60, signaling strong buying pressure, although approaching overbought territory could suggest a near-term pullback.

MACD (Moving Average Convergence Divergence): The MACD histogram is above the baseline and the MACD line is above the signal line, confirming the bullish momentum in the market.

Support and Resistance:

Support: Immediate support is found at the top boundary of the Ichimoku cloud, followed by the middle Bollinger Band.

Resistance: Resistance can be anticipated at the recent high, with further resistance potentially near the upper Bollinger Band.

Conclusion and Consideration:

The GBPNZD pair on the H4 chart suggests a strong bullish trend, backed by the indicators like the Bollinger Bands, Ichimoku, RSI, and MACD. The technical outlook is supported by a bullish price action pattern. Traders should consider the impact of upcoming economic releases and any changes in monetary policy from the respective central banks, which could affect this trend. As the price is near the upper Bollinger Band and RSI indicates overbought conditions may be near, careful risk management and readiness for potential pullbacks are essential.

Disclaimer: The provided analysis is for informational purposes only and does not constitute investment advice. Traders should conduct their own research and analysis before making any trading decisions.

GBPNZDH4-Daily-Technical-Analysis-29.03.2024

GBP/NZD Forecast — 9 November 2023

Time Zone: GMT +2

Time Frame: 4 Hours (H4)

Fundamental Analysis:

The GBPNZD currency pair reflects the exchange rate between the British Pound (GBP) and the New Zealand Dollar (NZD). Factors that may affect this pair include differences in the economic outlook and monetary policies of the Bank of England and the Reserve Bank of New Zealand, trade relations between the United Kingdom and New Zealand, and global commodity prices, particularly dairy products which are a significant export of New Zealand. Additionally, risk sentiment among investors, driven by geopolitical events and global economic performance, can cause fluctuations in this currency pair.

Price Action:

The H4 timeframe shows that the GBPNZD pair has been experiencing some volatility with a recent downtrend followed by a modest recovery. After a period of decline, the price has moved above the Alligator’s jaws, suggesting a potential shift in momentum. The latest candles are forming above the moving averages, indicating that the bulls may be attempting to regain control of the market direction.

Key Technical Indicators:

RSI (Relative Strength Index): The RSI is just above the midline at 57, suggesting that the momentum is slightly more in favor of the buyers but not yet indicating overbought conditions.

Volumes: The volume bars show some spikes, which correspond with large price movements, signaling active market participation and potential shifts in market sentiment at those times.

Alligator: The Alligator lines have started to intertwine, and the price is currently above these lines, hinting at a possible emerging bullish phase if the price continues to stay above the Alligator’s jaws.

Support and Resistance:

Resistance: The previous high near the 2.0840 level may act as a resistance in the short term.

Support: A support zone can be identified around the 2.0573 level, where the price has recently bounced, showing some buying interest.

Conclusion and Consideration:

The GBPNZD pair on the H4 chart suggests a market trying to find its footing after a period of bearish movement, with potential early signs of a bullish correction. The RSI and Alligator indicators provide mild bullish signals, while volume analysis indicates engagement by traders during significant moves. Traders should watch for the ability of the price to stay above the Alligator’s jaws and the RSI to remain stable for further bullish confirmation. Keeping an eye on economic announcements from both the UK and New Zealand is crucial, as they could significantly impact the pair’s movement. Caution should be maintained, and risk management strategies, including stop-loss orders, should be in place to protect against sudden reversals.

Disclaimer: We do not suggest any investment advice, and these analyses are just to increase the traders’ awareness but not a certain instruction for trading.

1GBP = –––NZD –––%
GBPNZD
Loading chart...