Time Zone: GMT +3
Time Frame: Daily (D1) / Weekly Outlook
Weekly Fundamental Overview:
GBP/NZD continues to respond to shifting global risk sentiment and domestic economic signals. Investors are evaluating sovereign growth momentum and trade conditions, which influence demand for the currency pair. The pair’s trajectory remains sensitive to macro data performance and broader appetite across international capital markets.
Price Action:
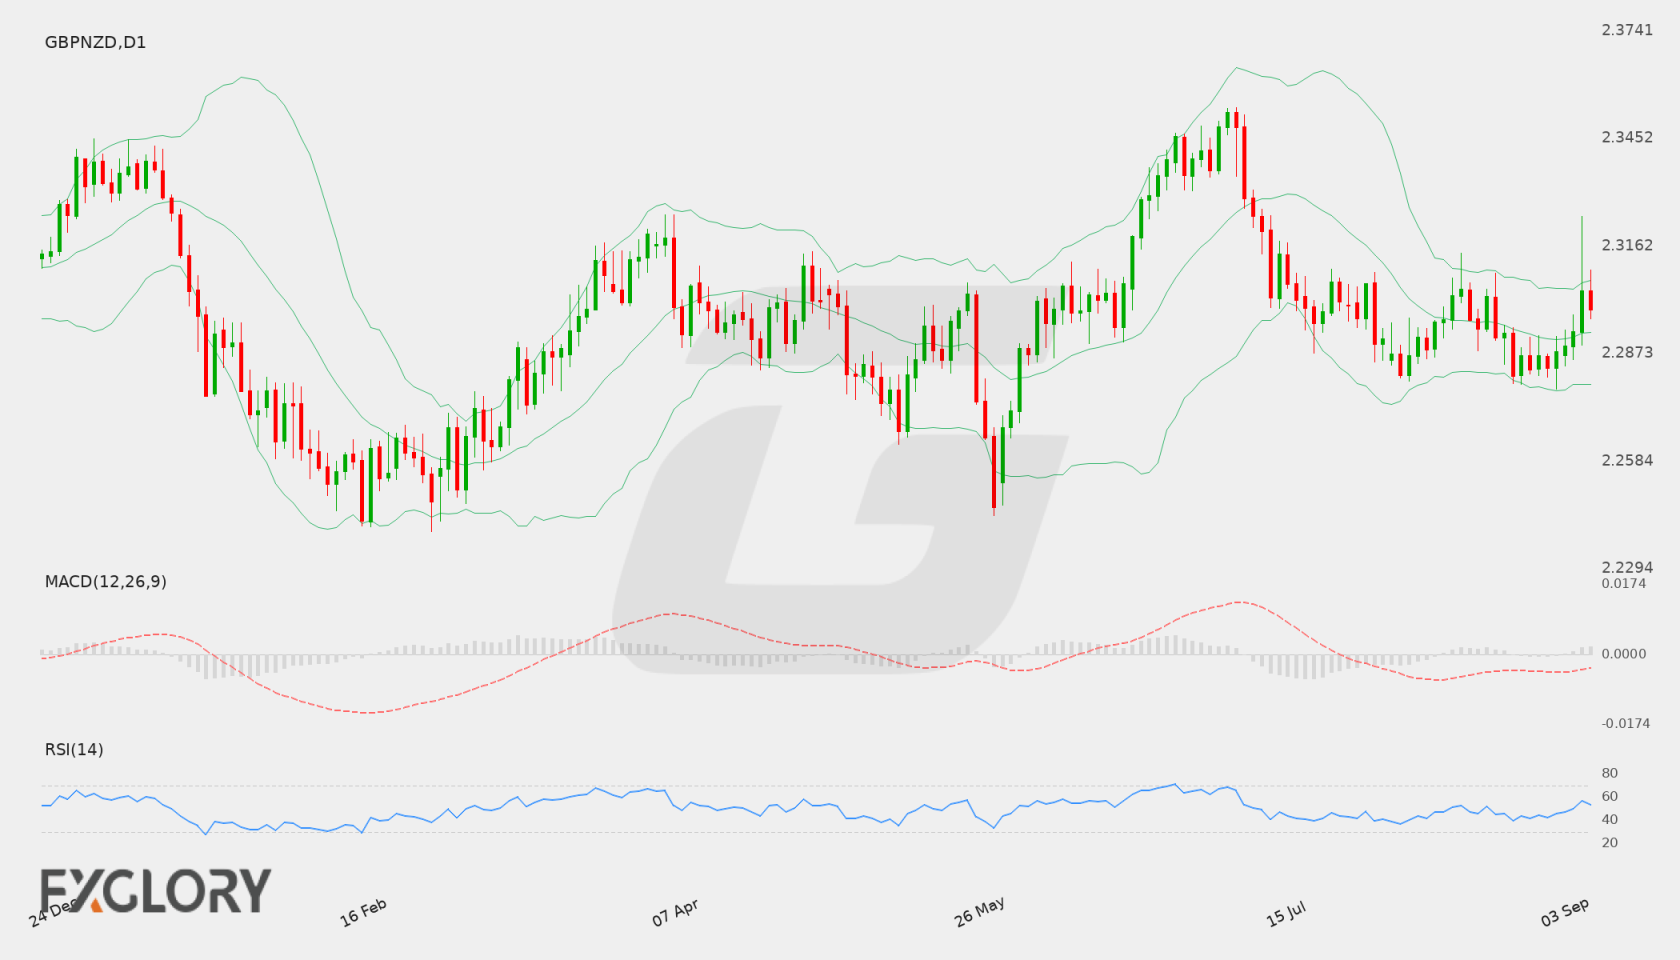
On the daily D1 chart, GBP/NZD closed at 2.29911 after a recent rebound from lower support areas. The recent price action indicates consolidation, as candles trade near the center of the recent range while testing intermediate moving averages and volatility bands.
Key Technical Indicators:
Bollinger Bands: The D1 Bollinger Bands indicate a middle band at 2.29301, with the upper band at 2.30702 and the lower band at 2.27900. Trading at 2.29911 positions GBP/NZD slightly above the middle band, reflecting a mild upward bias within the current volatility envelope.
RSI: The 14-day Relative Strength Index (RSI) is currently at 52.995. This places the pair in neutral territory, indicating balanced market sentiment without immediate overbought or oversold pressure.
MACD: The MACD indicator on the daily chart stands at -0.00160. This reading below the zero line shows weak bearish sentiment, though the narrowing gap suggests potential stabilization if buying interest persists.
Support and Resistance:
Key technical support for GBP/NZD is located around 2.27772, with additional lower boundary support near 2.27900. Overhead resistance is established at 2.35338, while the upper Bollinger Band near 2.30702 serves as a nearer-term upside target.
News to Watch for GBPNZD This Week:
- GDP m/m: Monthly economic growth data provides insight into national output trends and potential monetary policy shifts.
Weekly Outlook and Consideration:
The GBP/NZD pair approaches the upcoming week hovering near 2.29911, positioned just above its daily middle Bollinger Band of 2.29301. With a neutral RSI of 52.995 and a slightly negative MACD of -0.00160, price action could continue consolidating within established boundaries. A sustained move higher may test resistance at 2.35338, whereas a reversal lower could bring support at 2.27772 back into focus.
Disclaimer: The analysis provided for GBP/NZD is for informational purposes only and does not constitute investment advice. Traders are encouraged to perform their own analysis and research before making any trading decisions. Market conditions can change quickly, so staying informed with the latest data is essential.