GBP/NZD Forecast — 22 August 2026
Time Zone: GMT +3
Time Frame: Daily (D1) / Weekly Outlook
Weekly Fundamental Overview:
The GBP/NZD pair faces an intriguing fundamental outlook as traders weigh UK economic conditions against major central bank announcements in New Zealand. Diverging monetary policy expectations continue to play a pivotal role in guiding exchange rate sentiment. Market participants are closely monitoring central bank communications and inflation dynamics to gauge the trajectory of future policy rate adjustments. Broader risk sentiment in global equity and commodity markets also serves as a key driver, given the sensitive nature of commodity-linked currencies during periods of shifting global liquidity.
Price Action:
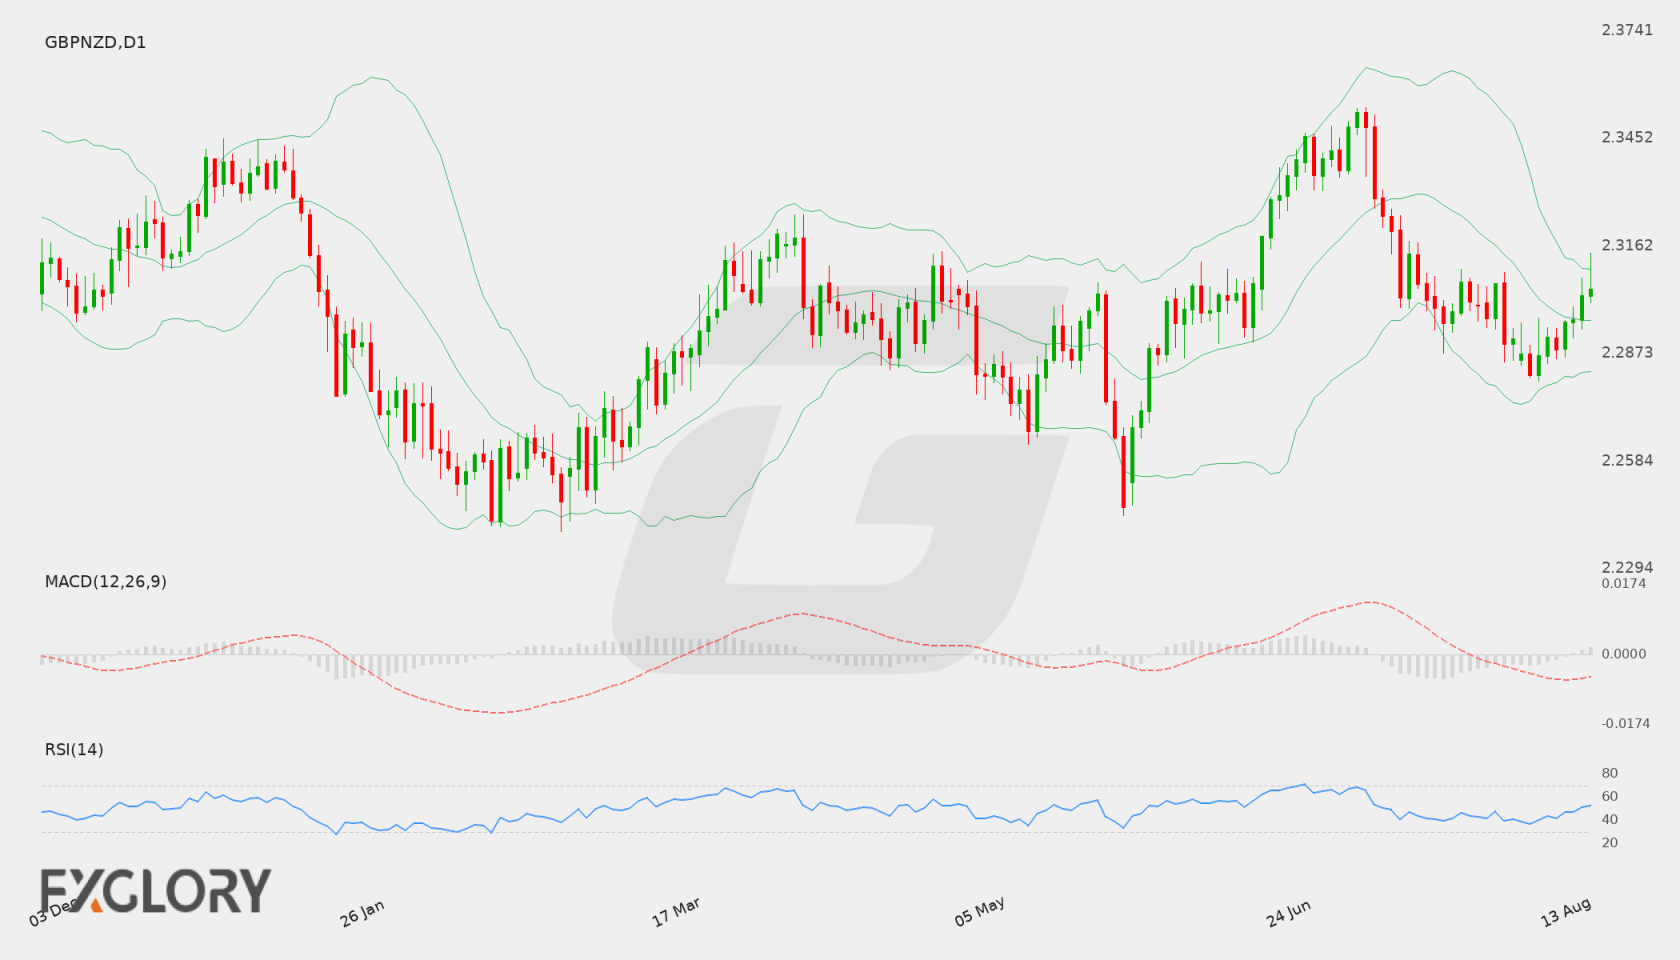
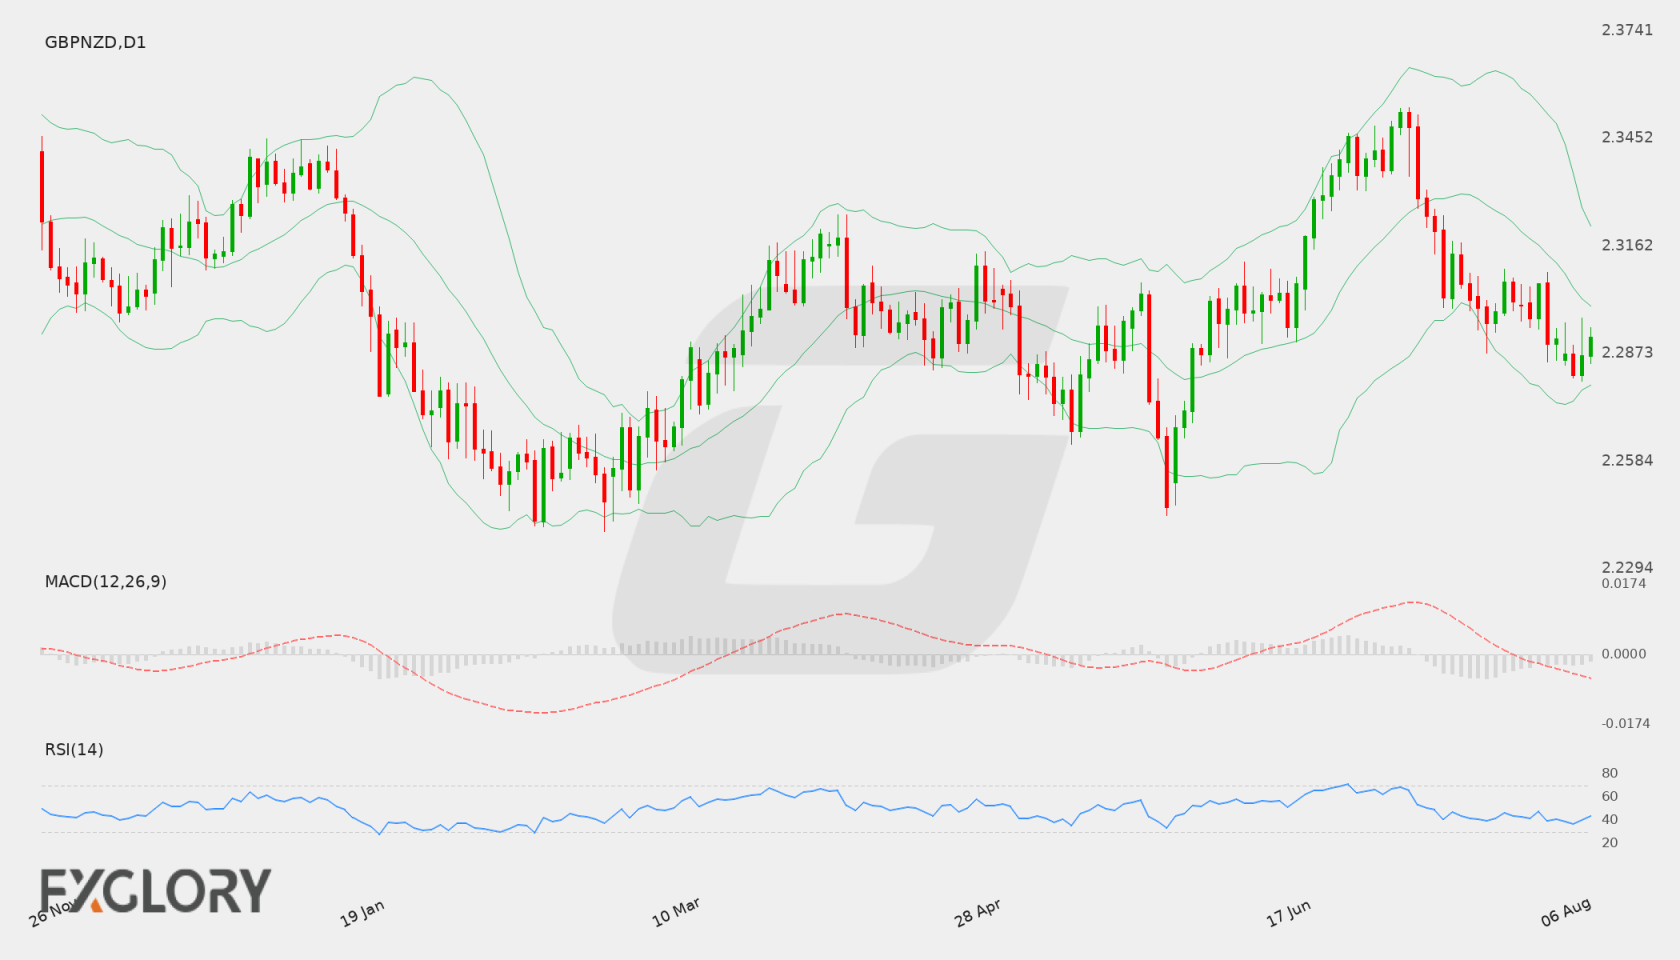
On the daily D1 chart, GBP/NZD closed at 2.29279 after oscillating between moderate highs near 2.3080 and recent lows around 2.2840. The market shows a phase of lateral consolidation, failing to establish a strong directional breakout above recent minor peaks. Price action remains bounded within a medium-term range, reflecting a balanced tug-of-war between buyers attempting to regain upward momentum and sellers pushing price lower toward recent swing support levels.
Key Technical Indicators:
Bollinger Bands: The daily Bollinger Bands highlight a consolidation structure with the middle band positioned at 2.29491. The upper band resides at 2.30785 while the lower band sits at 2.28196. The current close at 2.29279 sits slightly below the middle band, indicating a slight bearish tilt within the channel. A firm move above the middle band could open room toward the upper band at 2.30785, whereas persistent weakness beneath 2.29491 keeps the lower band at 2.28196 exposed.
RSI: The 14-day Relative Strength Index (RSI) registers at 45.58, keeping the indicator in neutral territory comfortably above oversold conditions. Sitting below the mid-50 threshold, the RSI signals a mild preference for sellers without confirming an extreme directional bias, allowing flexibility for price moves in either direction based on incoming fundamental catalysts.
MACD: The D1 MACD indicator is currently trading at -0.00319, residing below the zero line. This negative value reflects modest underlying bearish momentum and suggests that upside attempts remain restrained. However, the lack of steep downside divergence indicates that momentum is relatively stable rather than expanding rapidly to the downside.
Support and Resistance:
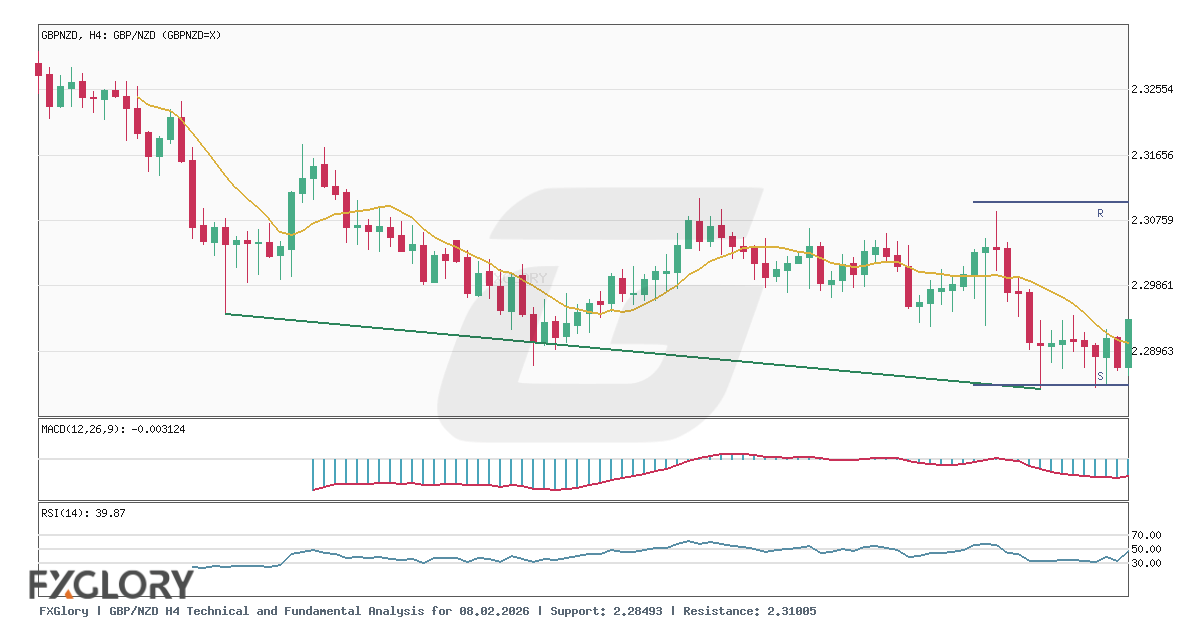
Key technical levels on the daily timeframe outline clear boundaries for GBP/NZD. Major overhead resistance is located at 2.35338, representing a key barrier for extended bullish continuation. On the downside, primary structural support is identified at 2.24369. Intermediary technical reference points remain defined by the Bollinger lower band at 2.28196 and the upper band near 2.30785.
News to Watch for GBPNZD This Week:
- RBNZ Monetary Policy Statement: This statement outlines central bank economic projections and policy decisions that can drive significant market movement.
- Official Cash Rate: The benchmark rate decision heavily influences yield expectations and valuation for the currency.
- RBNZ Rate Statement: This commentary clarifies the central bank policy stance and guides future rate expectations.
- RBNZ Press Conference: Remarks from monetary officials offer detailed context regarding inflation trends and future monetary policy.
- Monetary Policy Report Hearings: Central bank leaders address parliamentary inquiries, providing insights into economic conditions and policy outlook.
Weekly Outlook and Consideration:
The weekly outlook for GBP/NZD points toward a range-bound environment with potential volatility tied to upcoming central bank events. With price hovering near 2.29279, just beneath the daily Bollinger middle band at 2.29491, technical indicators like the RSI at 45.58 and MACD at -0.00319 present a neutral to slightly cautious tone. A sustained breakout above 2.30785 could pave the way toward resistance at 2.35338. Conversely, if selling pressure intensifies beneath 2.28196, price may gradually slide toward key support at 2.24369.
Disclaimer: The analysis provided for GBP/NZD is for informational purposes only and does not constitute investment advice. Traders are encouraged to perform their own analysis and research before making any trading decisions. Market conditions can change quickly, so staying informed with the latest data is essential.